 2020, Vol. 31


b Molecular Imaging Center, Department of Radiology, West China Hospital of Sichuan University, Chengdu 610093, China
As the most common primary malignant brain tumors, glioblastomas (GBM) remained a difficult treatment due to its heterogeneous, highly invasion and infiltration. In general, the clinical treatments of GBM were combined with chemotherapy and adjuvant radiotherapy after tumor resection [1]. However, because of its high aggression, tolerance and infiltration surrounding brain parenchyma, there was currently no good treatment efficiency of stereotactic radiosurgery or brachytherapy as a part of clinical treatment [2, 3], leading to a mean survival time of 15 months of GBM patients after the surgical resection [4]. Thus, the chemotherapy played an important role in the treatment of GBM. However, the chemotherapy drugs targeted effectively to GBM were very absent [5, 6]. Therefore, the diagnosis and effective targeting on glioblastomas is necessary.
In clinical, brain tumors were diagnosed with magnetic resonance imaging (MRI), due to their high spatial resolution of the soft tissue [7-9]. Compared with the computed tomography (CT), MRI could obtain the image information of different sections, conveniently to provide the shape and size of focal tissue [10, 11]. However, T1 relaxation between the diseased tissue and normal tissues did not cause significant difference, resulting in the blur edge of the lesion area in the MRI image [12]. In order to obtain clear MRI images with more pronounced contrast of tumor, contrast agents (CA) were often used to enhance the contrast of MRI [13-15]. Due to its higher sensitivity and soft tissue resolution, fluorescence imaging could be combined with MRI to enhance their ability to recognize the cancer cells [16]. Thus, it was necessary to develop a MR-fluorescent dual-mode imaging probe with higher resolution and sensitivity, for the diagnosis of brain tumors.
Compared to other elements of lanthanide, gadolinium Ⅲ (Gd3+) with 7 unpaired electrons in the outermost layer, led to its long electron relaxation time and the application of its chelate as T1 contrast agent in clinical practice [17-19]. In addition, lanthanide elements, such as erbium Er and europium Eu, were also used as fluorescence agents in optical imaging due to their excellent fluorescence property [20, 21]. Recently, Eu-doped nanomaterials could be used to enhance fluorescence image [22, 23], such as Eu-doped Gd2O3 (Eu-Gd2O3) nanomaterials with the excellent paramagnetic and luminescence properties. Arindam et al. reported that the multifunctional Eu:Gd2O3 triangular nanoplates could enhance the contrast of MR imaging and fluorescence imaging [24], leading to their application of tumor chemotherapeutic carrier material.
However, poor hydrophilicity of Eu-Gd2O3 nanorods (NRs) led to their bad intravenous administration, easy conglutination of proteins or phagocytization of the macrophage phagocytic system, so their surface needed to be linked with poly(ethylene glycol) (PEG), in order to increase of the circulation time of Eu-Gd2O3 NRs and enhance their permeability and retention effects (EPR) in vivo [25, 26]. Furthermore, these PEG-linked NRs could be connected with the drugs to render their anti-cancer therapy function [25, 27]. However, these clinical contrast agents and drug delivery vehicles did not target the tumor tissues, and their passive accumulation in tumor sites via EPR could lead to their lower imaging enhancement and therapy efficiency [16, 28]. Tumor-targeted peptides could be linked with NRs to enhance their recognition to cancer tissues in vivo through receptor-mediated endocytosis [29]. Deng et al. prepared the CTX-NaGdF4:Ho3+ NPs, and these NPs could significantly enhanced the in vivo contrast between normal tissue and glioma [30]. Huang et al. reported that Chlorotoxin (CTX)-modified dendrimer-based conjugate could targeted to the glioma in vivo and had the possibility on accurate tumor diagnosis [31]. CTX was a peptide consists of 36 amino acids, purified from the venom of Leiurus quinquestriatus [32-34], and it could easily target some tumor tissues, specifically binding with matrix metalloproteinase Ⅱ (MMP-2) on glioma sites to formed the complex of CTX-ClC-3/MMP-2 [35]. Moreover, MMP-2 was highly expressed in gliomas, hyloma and other neuroectodermal tumors, rarely expressed in normal cells [6, 36]. Therefore, CTX could be used as an effective glioblastomas-targeted peptide on brain tumor treatment [35]. Furthermore, as a chloride channel protein, ClC-3/MMP-2 promoted the invasion and migration of glioma cells by enhancing the efflux of chloride ionsand the corresponding obligatory movement of water, so the complex of CTX-ClC-3/MMP-2 could inhibit the volumetric contraction of tumor cells via blocking Cl ion channels, thereby reducing the metastatic ability of GBM [37, 38].
Some anti-cancer drugs were loaded in polymer nanocarriers to enhance their therapy efficiency on gliomas, such as curcumin, paclitaxel, doxorubicin (Dox) and so on [35, 39-42]. Dox could effectively treat many cancers by inhibiting the activity of topoisomerase Ⅱ and DNA synthesis in normal cells and cancer cells [43, 44]. However, Dox could also cause toxicity on cardio and bone marrow via enhanced reactive oxygen species (ROS) in these cells [45]. When Dox was combined with the peptide targeting tumor, its toxic effect on normal cells was decreased and its anti-tumor effect could be obviously enhanced. Moreover, the intratumoral pH values of GBM were around 6.5, while peritumoral pH values of GBM were around 7.4 [46]. Thus, a hydrazone bond (with pH response) between Dox and drug carriers could enhance the release of Dox in tumor cells [47].
In this study, Eu-Gd2O3 NRs were used as the tumor-targeted drug carriers, and their surface was coated with dual-functionalized PEG (called as PEG-NRs) via the reaction between succinimide of PEG chain and amino group on NRs, and then PEG-NRs were linked with Dox (called as Dox-NRs) via the formation of the hydrazone bond. Finally, CTX was connected with PEG-NRs (called as CTX-NRs) or Dox-NRs (called as CTX-NRs-Dox) via the reaction between the sulfhydryl groups of CTX and maleimides of PEG chain. MR and fluorescence imaging properties and the pH response ability of CTX-NRs-Dox were analyzed. The cytotoxicity and in vitro tumor-targeted ability of these materials were analyzed via their co-culture with glioma cells. Then, the in vivo targeting and therapy of CTX-NRs-Dox were evaluated in the model of nude mice with human glioma, and these mice were treated with prepared NRs to analyze the therapy ability of CTX-NRs-Dox on GBM.
Herein, to prepare the expected CTX-NRs-Dox, this study focused on the following works. First, 500 mg of prepared Eu-Gd2O3 NRs were mixed with 175 mL of tetramethylammonium hydroxide pentahydrate (7 wt%), and reacted at 180 ℃ for 6 h. The reaction products were washed three times with deionized water and ethanol, respectively, and then dried for 12 h to obtain the hydroxylated NRs (called as OH-NRs, as shown in Scheme S1a in Supporting information) [48]. Then, 300 mg of OH-NRs were dispersed in 72 mL of mixed solution (DMSO:CCl4 = 1:1), and 600 μL of aminopropyltriethoxysilane (APTES) was added into the OH-NRs suspension. After agitation at 60 ℃ for 8 h, the aminated NRs (called as NH2-NRs, as shown in Scheme S1b in Supporting information) were obtained. 500 mg of NH2-NRs were dispersed in 100 mL of DMSO, and reacted with 25 mg of succinimidyl carbonate-poly(ethylene glycol)-carboxymethyl (SC-PEG-CM) at room temperature (RT) for 24 h. After washed with redistilled water and dried, PEG-coated NRs (called as PEG-NRs) were obtained (Schemes S1b and c in Supporting information).
Then, 300 mL of PEG-NRs were dispersed in 15 mL of PBS (pH 7.2), and 30 mg of succinimidyl 4-N-maleimidomethyl cyclohexane-1-carboxylate (SMCC) was added into the PEG-NRs suspension. After the suspension was agitated for 1 h at RT, SMCC-NRs were prepared via the reaction between succinimide of SMCC and remained amino group on NRs (Scheme S1d in Supporting information). After washed with DMSO and dispersed in DMSO, PEG-NRs-SMCC suspensions were mixed with 1.8 g of 1-(3-dimethylaminopropyl)-3-ethyl carbodiimide hydrochloride(EDC) and 10 mL of hydrazine hydrate solution (pH 6.5), then the carboxyl of NRs-PEG-SMCC and hydrazine hydrate was reacted with the agitation for 12 h at RT (Scheme S1e in Supporting information). After washed with water and freeze-dried, the hydrazined NRs were divided into 3 groups, and dispersed in 10 mL of DMSO, respectively. Then 2 mL of Dox suspension (1 mg/mL in PBS, pH 6.5) was added into groups 2 and 3, while 2 mL of PBS (pH 6.5) was added into group 1. Three groups were reacted with the agitation at RT for 24 h. After the reaction, the supernatant liquid was collected for Dox loading test. Then 2 mL of thiolate CTX labeled with fluorescein isothiocyanate (SH-CTX-FITC) solution (0.5 mg/mL in DMSO) were added into groups 1 and 3, respectively, while group 2 was only added with 2 mL of DMSO. Three groups were reacted at RT for 24 h, and then the products were washed and freeze-dried, and CTX-NRs in group 1, Dox-NRs in group 2 and CTX-NRs-Dox in group 3 were obtained, respectively (Schemes S1f-h in Supporting information).
The values of MR relaxation rate (r) and T1-weighted MR imaging of Eu-Gd2O3 NRs and CTX-NRs-Dox were analyzed with 7.0 T MRI imaging system (Bruker biospec 70/30 USR). Eu-Gd2O3 NRs and CTX–NRs-Dox were dispersed into 0.5% agarosewith different concentrations of Gd3+ (0.25∼4.0 mmol/L). Then these suspensions in tubes were placed into the MRI system. The measurement conditions were as following: a field of view (FOV) of 40 mm × 40 mm, a slice thickness of 2.0 mm, the number of excitations (NEX) of 4, the flip angle of 30°, the size of the images of 256 × 256, the value of echo time (TE) of 6.0 ms, and repetition time (TR) of 180 ms. To analyze the targeting in vivo tumor, OTNM mice with brain U87 tumor were injected with dose of 5 mg[Gd]/kg[mice] via tail vein, subsequently T1-weighted images of these mice were collected with 7.0 T MR imaging system at different time (0, 2, 4 h) of post-injection of Dox-NRs and CTX-NRs-Dox. Then these mice were anesthetized via 2.0% isoflurane mixed pure O2, and the pre-injected MR image (0 h) was as the control. The brightness of brain tumor field of a serial of MRI images was obtained with soft of Photoshop 7.0, and the contrast intensity value was calculated with the following formula: Ī = Īinside tumor – Īaround tumor.
In order to investigate the loading capacity and pH-controlled release of Dox, a great deal of work were carried out. Pure Dox were dispersed in different pH values of PBS buffer (pH 5.0, 6.5 and 7.4), and their standard curve were measured by UV–vis. Then, the concentration of obtained supernatant liquid was determined based on the absorption intensity at the wavelength of 481 nm. Similarly, the suspension of CTX-NRs-Dox NRs was continuously shaken at different pH of PBS (pH 5.0, 6.5 and 7.4). The concentration of Dox released in supernatant liquid was analysed by measuring the UV absorption at the wavelength of 481 nm. The loading capacity of Dox on CTX-NRs-Dox was calculated by following Eq. (1):
|
(1) |
To explore the ability of various NRs on cell targeting and fluorescence, the U251 cells were placed in a 12-well plate with 105 cells/well and incubation for 12 h, then added by 2 mL of fresh DMEM containing different NRs (PEG-NRs, Dox-NRs, CTX-NRs, CTX-NRs-Dox, respectively). After co-cultured for 4 h, the cells were with PBS, and then co-cultured with 4% paraformaldehyde solution for 15 min, subsequently co-cultured with 300 μL of Triton-100 for 3 min, then co-cultured with 200 μL of DAPI for 5 min. After washed with PBS, the cells were observed by the laser scanning confocal microscopy (LSCM, Leica TCS SP5, Germany) with the exciting light wavelengths of 405 nm and 488 nm, respectively. The average optical density (called as AOD) of different materials were obtained with the image J soft. The physiological saline and CTX-NRs-Dox were injected into the tumor site of U87MG orthotopic xenograft tumor-bearing nude mice (named as OTNM mice) to observe the fluorescence property of CTX-NRs-Dox in vivo by a Maestro In-Vivo Imaging system (the excitation wavelength was 480 nm).
OTNM mice were sacrificed after treated for 4 d with different prepared NRs to investigate the in vivo bio-distribution evaluation of materials. Then, their heart, liver, spleen, lung, kidney and brain tissues were excised and washed with physiological saline. A half of each tissue was treated into 4% paraformaldehyde for 2 d, and observed under the IFM after section and H & E staining; then another half tissue was weighted, and digested with mixed acids (nitric acid : perchloric acid, v/v = 3/1). The concentration of Gd ions in the digesting solution of these tissues was determined by Inductively Coupled Plasma Atomoic (ICP-AES, IRIS Adv, USA). Finally, the bio-distribution of the different NRs in various tissues was calculated as the percentage of injected dose per gram of tissues (%ID/g), based on the results of ICP-AES.
Male BALB/c nude mice (4∼6 weeks) were injected with 100 μL U87MG cells suspension (about 1 × 10⁶ cells) in the hip subcutaneous (tumor-bearing nude mice, TBN mice). When the diameter of tumors reached 0.4∼0.5 cm [49], TBN mice were injected intravenously through the tail vein with 100 μL of physiological saline, PEG-NRs, Dox-NRs and CTX-NRs-Dox (concentration of 2 mg (Gd)/mL) with a dosage frequency of every 2 d (lasting for 10 d). The size of tumors was measured by vernier micrometer for every 3 d.
All data in this study were expressed by mean ± standard deviation (SD). Statistical analysis was performed by the one-way Analysis of Variance (ANOVA) test, and the differences between the two groups were evaluated by Least-Significant Difference (LSD), Student-Newman-Keuls (S-N-K) and Dunnett-t tests, respectively. The P value of less than 0.05 was as the level of statistically significant differences.
XRD pattern in Fig. S1a (Supporting information) demonstrated that the prepared NRs were cubic Gd2O3 phase (JCPDS No. 11-0604), and the slight shift of the NRs peaks indicated the slightly increase of interplanar crystal space due to the larger radius of Eu3+ doping into the Gd2O3 crystal lattice. TEM images in Figs. 1a and cshowed the uniform and disperse Eu-Gd2O3 NRs and CTX-NRs-Dox. The length distribution in Figs. S1b and c (Supporting information) showed that the mean size of Eu-Gd2O3 NRs and CTX-NRs-Dox were 90.9 ± 37 nm and 116.3 ± 52 nm, respectively. The crystal structure of NRs could be observed clearly in a HRTEMimage (Fig. 1b), and the fringe spacing was about 0.3148 nm, corresponding to the interplanar crystal spacing of (222) plane [3]. Furthermore, the selective area electronic diffraction pattern (SAED, inset in Fig. 1b) indicated the single crystalstructure of the prepared NRs, and the interplanar crystal spacing of the yellow line, green line and red line were 0.3164 nm, 0.2817 nm and 0.1988 nm, respectively. The energy dispersive spectroscopy (EDS) and the element contents of CTX-NRs-Dox were shown in Fig. S2 and Table S1 (Supporting information), respectively, suggesting that the Eu amount in Gd2O3 NRs was about 23%.

|
Download:
|
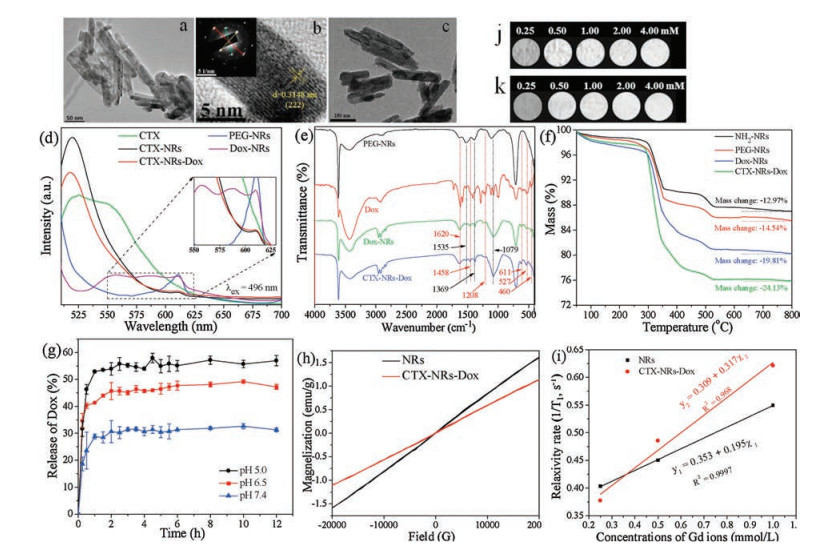
| Fig. 1. TEM images of Eu-Gd2O3 NRs (a) and CTX-NRs-Dox (c); HRTEM image of Eu-Gd2O3NRs (b), and SAED inseted in (b). Fluorescence emission spectra (d), FT-IR spectra (e), TG curves (f) of different NRs; Dox release curves of CTX-NRs-Dox in pH 5.0, 6.5 and 7.4 (g). Magnetization curve (h), the longitudinal relaxation rate r1 (1/T1) (i) of NRs and CTX-NRs-Dox; T1-weighted MR images of NRs (g) and CTX-NRs-Dox (k). | |
In Fig. 1d, there were the similar characteristic emission peaks at 510∼550 nm in the fluorescence patterns of pure CTX-FITC, CTX-NRs and CTX-NRs-Dox due to FITC linked with CTX; however, there was no the typical peak in the patterns of PEG-NRs and Dox-NRs, indicating that CTX was successfully linked with the corresponding NRs. The insert of Fig. 1d show that there were the weaker emission peaks at 610∼620 nm in the patterns of PEG-NRs, CTX-NRs, Dox-NRs and CTX-NRs-Dox due to the high-efficiency energy conversion between Gd3+ and Eu3+. The peak range from 550 nm to 600 nm was the fluorescence peak of Dox. However, the peak of Dox was hidden by the stronger peak of CTX in CTX-NRs-Dox. In Fig. S3 (Supporting information), there were the obvious UV absorption peaks in the range from 480 nm to 550 nm of the patterns of Dox, Dox-NRs and CTX-NRs-Dox, while there was no absorption peak in the pattern of PEG-NRs, indicating the successfully conjugation of Dox with NRs. FTIR patterns of pure Dox, PEG-NRs, Dox-NRs, CTX-NRs-Dox were shown in Fig. 1e. The peaks marked with the red and blue arrows were the vibration of the typical peaks of Dox and PEG-NRs, respectively. The broad band at 1079 cm−1 corresponded to the stretching vibration peak of Si-O band from 3-aminopropyl triethoxysilane, and the peak at 1369 cm−1 was attributed to the residual −NO3 group in NRs. The peaks at 1726 cm−1, 1620 cm−1 and 1208 cm−1 were assigned to the vibrations of C=O bond of Dox, N—H bond of the hydrazide bond and C=N group, respectively [50, 51]. Compared with the peaks of PEG-NRs, two peaks at 1620 cm−1 and 1208 cm−1 in the spectra of Dox-NRs and CTX-NRs-Dox appeared, demonstrating that a hydrazide bond was formed which contained C=N bond and N—H bond, and the typical peaks at about 1458 cm-1 and 527 cm-1 in the spectra of Dox-NRs and CTX-NRs-Dox were the stretching vibrations of benzoquinone and the anthracene in the linked Dox [52]. These results indicated that Dox was connected with PEG-NRs and CTX-NRs through hydrazone bond, respectively. TG curves of NH2-NRs, PEG-NRs, Dox-NRs and CTX-NRs-Dox were showed in Fig. 1f. The mass change difference between PEG-NRs and NH2-NRs was 1.57%, and the mass change difference between Dox-NRs and PEG-NRs was 5.27%, and the mass change difference between CTX-NRs-Dox and Dox-NRs was 4.32%, suggesting that the amounts of linked PEG, Dox and CTX peptides onto NRs were 1.57%, 5.27% and 4.32%, respectively.
UV absorption of Dox solution (PBS, pH 5.0, 6.5, 7.2) with different concentrations were measured by UV–vis at the wavelength of 481 nm, and then the standard curve of Dox in different pH values (pH 5.0, 6.5, 7.2) were shown in Fig. S4 (Supporting information). According to Eq. (1) and the standard curve of Dox in PBS (pH 6.5), the loading capacity of Dox in CTX-NR-Dox was about 69 wt%. The pH value in tumor was 6.5–7.2, while pH value of endosomes or lysosomes in tumor cells was 5.0–6.5 [53]. So pH-response NRs circulated in vivo, retained most of drug and released at the tumor site or in the lysosomal or endosomal of tumor cells, which could reduce the potential damage on normal cells [54, 55]. The release curves of Dox from CTX-NRs-Dox in different pH values (pH 5.0, 6.5 and 7.4) were shown in Fig. 1g, revealing that the release rate of Dox from CTX-NRs-Dox at pH 7.2 after 12 h was 31.21 ± 1.4 wt%. However, their release rates at pH 6.5 and 5.0 reached to 46.71 ± 1.65 wt% and 55.58 ± 1.68 wt%, respectively, which were 15.5 wt% and 24.37 wt% higher than that at pH 7.2, indicating that CTX-NRs-Dox possessed the pH-response capacity of releasing Dox.
The magnetization curves of NRs and CTX-NRs-Dox were shown in Fig. 1h, indicating the good paramagnetism of NRs and CTX-NRs-Dox. Because the linkage of CTX and Dox onto NRs resulted in the reduction of Gd3+ percentage in CTX-NRs-Dox, the mass magnetic value of NRs was higher than CTX-NRs-Dox at the same magnetization. Fig. 1i show that the longitudinal relaxation rate r1 of NRs and CTX-NRs-Dox were 0.195 L mmol−1s−1 and 0.317 L mmol−1s−1, respectively. The higher r1 value of CTX-NRs-Dox resulted from the fact that PEG and CTX linked on the NRs could increase the local hydrogen content and hydrophily of NRs, leading to the larger water content around NRs [29, 48]. Figs. 1j and k show a series of T1-weighted MR images of NRs and CTX-NRs-Dox in the range from 0.25 mmol/L to 4.0 mmol/L of Gd ions, suggesting that the signal intensity of T1-weighted MR images improved continuously with increasing Gd3+ concentration.
The morphology of cells (Fig. S5 in Supporting information) was obtained with a microscope, and these cells viability (Figs. S6a–d in Supporting information) was evaluated (by Eq. S1 in Supporting information) with MTT assay. With the increasing concentration of four NRs (horizontal comparison in Fig. S5), HUVEC cells did not present significant change, while the amount of U251 cells decreased gradually. Compared with PEG-NRs group, due to a high cytotoxicity of Dox on cells, the amount of cells in Dox-NRs and CTX-NRs-Dox groups decreased significantly, and the bodies of some cells contracted and their pseudopod disappeared (shown by white arrows in Fig. S5). The cells morphology in CTX-NRs-Dox group was worse than that in Dox-NRs group, because CTX could specifically bind with MMP-2 from glioma cells, leading to more NRs accessible to U251 cells and increasing the Dox cytotoxicity on cells. The results of MTT in Fig. S6a and b further indicated that, with their dose increase, PEG-NRs, CTX-NRs, Dox-NRs and CTX-NRs-Dox could obviously limit the viability of HUVEC and U251 cells (P < 0.05). Obviously, PEG-NRs presented lower toxic to HUVEC and U251 cells, compared with other three materials. Furthermore, there was no significant toxicity difference between Dox-NRs and CTX-NRs-Dox on HUVEC cells at the same concentration, due to the CTX-targeted MMP-2 rarely expressed by HUVEC cells, and little effect of linked CTX on HUVEC cells (Fig. S6c). On the contrary, the toxicity of CTX-NRs-Dox on U251 cells at the higher NRs concentration (≥ 100 μg/mL) was significantly higher than that of Dox-NRs (P < 0.05, Fig. S6d), due to the high expression of MMP-2 of U251 cells. Moreover, the toxicity of CTX-NRs-Dox on U251 cells was lower than that of Dox-NRs at the concentration of 25 μg/mL (P < 0.05), because the mass percentage of Dox in CTX-NRs-Dox was lower than that in Dox-NRs, and the role of Dox on cells was dominant at the low concentration of NRs. These MTT results indicated that the targeting property of linked CTX could enhance the inhibitory effect of NRs on U251 cells.
The ultrathin sections of U251 cells co-cultured with PEG-NRs, CTX-NRs, Dox-NRs and CTX-NRs-Dox were observed with TEM to analyze the inside structure of U251 cells (Figs. S6e and f in Supporting information). Obviously, there were several prepared NRs entered into cells in different groups, indicating PEG-NRs, CTX-NRs, Dox-NRs and CTX-NRs-Dox were internalized inside the U251 cells. Furthermore, the integrated membranes and karyotheca, plentiful mitochondria, integrated nucleus and small amount of vacuoles of U251 cells in Figs. S6e and f indicate that PEG-NRs and CTX-NRs had an influence on the cellular activity to a certain extent. However, the karyotheca was broken and the shape of nucleus was abnormal, besides, there were little integrated mitochondra and numerous vacuoles in cytoplasm Figs. S6g and h (Supporting information). These results indicated that compared with PEG-NRs and CTX-NRs, Dox-NRs and CTX-NRs-Dox could negatively influence the viability of U251 cells, which was consistent with the result of MTT.
Fluorescent images of U251 cells incubated with PEG-NRs, Dox-NRs, CTX-NRs, CTX-NRs-Dox were shown in Fig. 2. The blue-fluorescence of nuclei could present the number and position of U251 cells, and the red-fluorescence presented the number and position of tested NRs. The bright and overlapped images displayed the interaction between U251 cells and NRs. Compared to PEG-NRs group, other three groups had the higher average optical density (AOD) of red-fluorescence (Fig. S7 in Supporting information), and exhibited many obvious red-fluorescence particles around and inside the U251 cells, indicating that the connection with Dox and CTX could enhance fluorescent intensity of prepared CTX-NRs-Dox. Compared with Dox-NRs and PEG-NRs, there were more CTX-NRs and CTX-NRs-Dox around U251 cells (the green arrows, Fig. 2), and even entered into the cytoplasm (the yellow arrows, Fig. 2) of U251cells in dark fields, and AODs of red-fluorescence in CTX-NRs and CTX-NRs-Dox groups were significantly larger than those in Dox-NRs and PEG-NRs groups, suggesting that there were more materials entering into the cells (the yellow arrows, Fig. 2) due to the targeting behavior of linked CTX. AOD of CTX-NRs-Dox (Fig. S7) was larger than that of other NRs, and the overlapped image of CTX-NRs-Dox group in Fig. 2 showed a much clearly detectable red-fluorescence inside cells, indicating that there were a large number of CTX-NRs-Dox entered the interior of U251 cells. These results demonstrated that CTX-NRs-Dox possessed the targeting ability to U251 cells.

|
Download:
|
| Fig. 2. Fluorescence imaging of U251 cells co-cultured with 200 μg/mL of four NRs for 4 h. Scale bars: 10 μm. | |
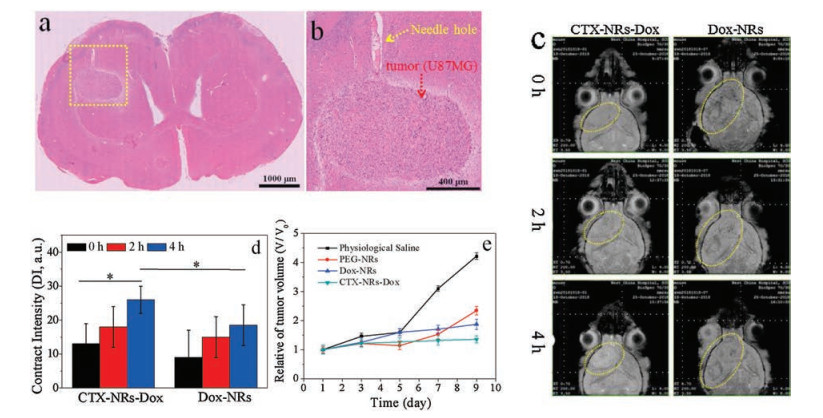
The body weight of OTNM mice of 30 d after the transplanted orthotopic glioma cells were recorded in Fig. S8 (Supporting information), indicating that there was little difference of body weight in 30 days, and the tumor did not significantly affect OTNM mice and their body weight in 30 days. The brain tissue section of OTNM rat at 2 week of post-translation of glioma cells was shown in Figs. 3a and b. The needle hole and tumor site in the brain tissue could be clearly observed, and the U87MG cells tended to spread from the edge of tumor to the brain, suggesting that the transplanted orthotopic glioma model has been successfully constructed. Furthermore, physiological saline and CTX-NRs-Dox was injected into the tumor site of OTNM mice to analyze the luminescence property of materials in vivo. As shown in Fig. S10 (Supporting information), the luminescence signals of the tumor site in OTNM mice injected with CTX-NRs-Dox could be obviously observed, while the luminescence signal in control group was not found, indicating that CTX-NRs-Dox has the potential to be used for in vivo fluorescence imaging.

|
Download:
|
| Fig. 3. (a, b) H & E–stained images of brain tissue of OTNM mice of transplanted orthotopic glioma established after 2 weeks. (c) T1-weighted MR images of the OTNM mice acquired 0 h (pre-injection), 2 h and 4 h of the post-injection of CTX-NRs-Dox and Dox-NRs, respectively, and yellow rings show the tumor field in above images; (d) The contrast intensity of tumor field, Ī = Īinside tumor ‒ Īaround tumor (* shows the significant difference between two corresponding groups, P < 0.05). (e) Changes of tumor volume during the tumor therapy assay. | |
T-weighted MR images in tumor fields at the different time after the tail-vein injections of NRs (0, 2 and 4 h) are shown in Fig. 3c, and their mean tumor brightness of MRI image of various condition is shown in Fig. 3d. Due to the denser blood vessels in the tumor field, Dox-NRs could slowly enter inside the tumor. At 0 h (pre-injection), the tumor filed presented hypointensity and lower contrast with periphery tissue. At 4 h of after tail-vein injection of prepared NRs, the brighter tumor fields obviously appeared, resulting from the targeting accumulation of CTX-NRs-Dox and the passive accumulation of Dox-NRs via blood circulation. However, there was no obvious change between the tumor fields at 0 h and 2 h of NRs injection. It is found from Fig. 3d that, the brightness of the tumor field in CTX-NRs-Dox group at 4 h of post-injection not only obviously increased (P < 0.05), but also significantly higher than that of Dox-NRs group, indicating that CTX linked with NRs could significantly guide NRs to target to the tumor field and enhance the contrast intensity of MR image, due to the specific recognition of CTX to MMP-2 over-expressed by glioma.
After the OTNM mice were treated via tail-vein injection for 4 d with physiological saline, PEG-NRs, Dox-NRs and CTX-NRs-Dox, respectively, their heart, liver, spleen, lung, kidney, brain and tumor were extracted, and their photograph were shown in Fig. S9a (Supporting information). There was no obvious abnormality in the morphologic and color of each organ, indicating that heart, liver, spleen, lung and kidney were not affected by prepared materials. The Gd ion distribution in each organ/tissue was determined by ICP-AES. As shown in Fig. S9b (Supporting information), the injected PEG-NRs and Dox-NRs mainly accumulated in the liver, spleen and lung due to the reticular endothelial system (RES) uptake via blood circulation [56], while CTX-NRs-Dox mainly accumulated in the liver, spleen, lung and tumor at 4 d of the post-injection. Moreover, the amounts of PEG-NRs, Dox-NRs in the tumor were higher than those in brain due to the EPR effect of the tumor [21]. However, the amount of CTX-NRs-Dox in the tumor (2.55% ID/g) was much more than those of organs/tissues, and about 5 times and 8.8 times of Dox-NRs and PEG-NRs in the tumor, respectively. These results further demonstrated the good tumor-targeting property of CTX-NRs-Dox.
The images of histological sections of these OTNM mice were showed in Fig. S11 (Supporting information). In four groups, there were a small amount of neutrophils (green arrows) in the spleen. Some pathologic changes, such as the degeneration or necrosis (yellow arrows) of some renal tubular epithelial cells, tumor cells (red arrows) metastasis in spleen and spleen atrophy, were observed in the histological sections of four groups, which might be related to the transplanted orthotopic glioma models. In Fig. S11, a small amount of tumor metastasis appeared in the liver tissue in physiological saline group, while other groups were not found, suggesting that NRs had a certain inhibitory effect on tumor growth. Compared with other groups, the volume of tumor tissue in brain in CTX-NRs-Dox group became smaller, and the necrotic area of tumor cells increased, and the arrangement of tumor cells was sparse, indicating that CTX-NRs-Dox had obvious therapeutic effect on the tumor tissue in brain. In addition, compared with the physiological saline group, CTX-NRs-Dox did not obviously damage cardiac, and the lesion degrees of spleen, liver, lung and kidney was reduced. This result not only suggested that there were no obvious toxic damages of CTX-NRs-Dox on the liver, lungs and kidneys, but also indicated that CTX-NRs-Dox could slightly limit the lesion from tumor metastasis on the heart and spleen.
The curves of OTBN mice weights in Fig. S9c indicated that there was hardly difference between four groups, suggesting the negligible side effects of prepared NRs on the OTBN mice weights. The change curves of the tumor volumes in Fig. 3e showed the effect of different NRs on U87MG tumors of TBN mice. Compared with physiological saline group, the tumor size of PEG-NRs, Dox-NRs and CTX-NRs-Dox-injected TBN mice groups only increased slowly, indicating that NRs could significantly inhibit the growth of U87MG tumor. The tumor size at 9th day of Dox-NRs group was obviously smaller than that of PEG-NRs group, owning to the therapeutic effect of connected Dox drug. Moreover, the growth (0.35) of tumor volume in CTX-NRs-Dox group at 9th day was obviously smaller than 0.87 of Dox-NRs group, suggesting that the targeting property of connected CTX could enhance the therapeutic effect of NRs-Dox on tumor, which was consistent with the result of MTT.
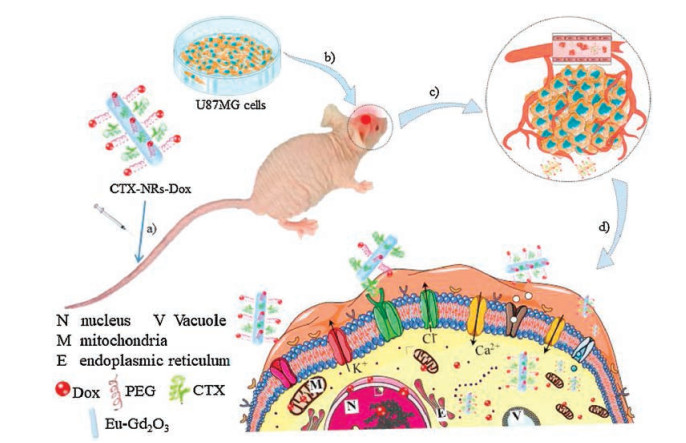
According to our above results, the synergetic mechanism of CTX-NRs-Dox on targeting and therapeutic brain tumor is proposed, as shown in Fig. 4. First, U87 cells were transplanted into the intracal of nude mice and grow out into brain tumor, namely OTNM, as shown in Figs. 3a and 4a. Then the sterilized CTX-NRs-Dox suspension were injected into the tail-vein of OTNM, as shown in Fig. 4b. Subsequently, most of CTX-NRs-Dox could reach to nascent blood vessel wall of the tumor via their long-time blood circulation, due to many MMP2 on the nascent blood vessel in the tumor [55]. Furthermore, CTX linked with NRs-Dox could target and accumulate around glioma tumor, in which there were many over-expressed MMP2 among tumor cells of tumor tissue. With the accumulation of CTX-NRs-Dox in or around the tumor field, as shown in Fig. 4c, T1-intensity of MR image in the tumor field was significantly enhanced, resulting in the obvious increase of the contrast intensity of tumor field, as shown in Fig. 3c. Then, CTX on the surface of NRs-Dox could specially bund with MMP2 into MMP2-CTX-NRs-Dox complexes. A part of MMP2-CTX-NRs-Dox complexes could block Cl‒ channels of glioma cells [56], limiting the active of U87 cells [35, 36], as shown in Fig. 4d. Other MMP2-CTX-NRs-Dox complexes could enter into U87 cells, and released Dox drugs from MMP2-CTX-NRs-Dox complexes due to the lower pH value in tumor tissue [45], and entered into nucleus leading to U87 cells apoptosis via inhibiting DNA synthesis; meanwhile the released Dox could enter into mitochondria to induce reactive oxygen species (ROS) in cells, resulting in the cellular inactivation. So the synergistic effect of CTX-NRs-Dox on tumor field to inhibit the tumor growth via blocking ions channels, limiting DNA synthesis and increasing ROS in tumor cells.

|
Download:
|
| Fig. 4. Schematic of orthotopic glioma models and synergistic mechanism of CTX- and Dox-dual-linked NRs (CTX-NRs-Dox) to target and limit the brain tumor: a) Establishment of brain tumor of OTNM rat; b) CTX-NRs-Dox were treated into OTNM via tail vein injection; c) CTX-NRs-Dox actively targeted into tumor field via blood circulation and special recognition of CTX with MMP2; d) The formed MMP2-CTX-NRs-Dox complex to block Cl− channels of U87 cells; e) the released Dox drugs from some CTX-NRs-Dox in tumor cells entered nucleus and mitocholndria, leading to cells apoptosis. | |
In summary, we prepared Eu-Gd2O3 NRs with uniform particle size were linked with Dox and CTX via PEGylation, hydrazone bond and sulfur bond. CTX-NRs-Dox had good paramagnetic, fluorescent properties, and excellent pH response properties. CTX-NRs-Dox and Dox-NRs had no significant toxicity on HUVEC cells, while the toxicity of CTX-NRs-Dox on U251 cells was higher than that of Dox-NRs, owing to the specifically binds between CTX on the surface of CTX-NRs-Dox and MMP2 from U251. The results of cells test of CTX-NRs-Dox also indicated their good adhesion, internalization and fluorescence properties on U251 cells. The transplanted orthotopic glioma models of OTBM were fabricated via the intracranial injection of U87 cells suspension and the in vivo culture, and the in vivo experiments after the tail-vein injection indicated that CTX-NRs-Dox had no significantly toxicity to normal organs, and could target and accumulate in the brain tumors via the long-time blood circulation, leading to the significant contrast enhancement of MRI images in the tumor field and inhibiting the growth and metastasis of brain tumors to a certain extent. A simple synergistic mechanism of targeting, dual-models imaging and inhabitation of CTX-NRs-Dox on the intracranial tumor is proposed. These results suggested that CTX-NRs-Dox has potential application prospect in the detection and treatment of glioblastomas.
AcknowledgmentsThis work has been supported by the National Natural Science Foundation of China (Nos. 51273122, 51872190) and Sichuan Science and Technology Project (No. 2018JY0535). This work was also supported by the Fundamental of Research Funds for the Central University (Nos. SCU2017A001, 2018SCUH0024).
Appendix A. Supplementary dataSupplementary material related to this article canbefound, inthe online version, at doi:https://doi.org/10.1016/j.cclet.2019.04.018.
| [1] |
N.A.O. Bush, S.M. Chang, M.S. Berger, Neurosurg. Rev. 40 (2017) 1-14. DOI:10.1007/s10143-016-0709-8 |
| [2] |
A. Omuro, L.M. DeAngelis, JAMA 310 (2013) 1842-1850. DOI:10.1001/jama.2013.280319 |
| [3] |
Z. Wu, Z. Huang, G. Yin, et al., J. Meter. Chem. B 5 (2017) 4863-4875. DOI:10.1039/C7TB00833C |
| [4] |
H. Noushmehr, D.J. Weisenberger, K. Diefes, et al., Cancer Cell 17 (2010) 510-522. DOI:10.1016/j.ccr.2010.03.017 |
| [5] |
Z. Dai, S. Li, P. Zhu, et al., Bioorg. Med. Chem. Lett. 27 (2017) 2863-2867. DOI:10.1016/j.bmcl.2017.04.075 |
| [6] |
R. Huang, W. Ke, L. Han, et al., Biomaterials 32 (2011) 2399-2406. DOI:10.1016/j.biomaterials.2010.11.079 |
| [7] |
H. Kao, S. Chiang, H. Chung, F.Y. Tsai, C. Chen, Biomed. Res. Int. 2013 (2013) 1-14. |
| [8] |
M. Ideguchi, K. Kajiwara, H. Goto, et al., J. Neuro-Oncol. 123 (2015) 289-297. DOI:10.1007/s11060-015-1797-y |
| [9] |
C. Wu, G. Lin, Z. Lin, et al., World J. Surg. Oncol. 13 (2015) 97. DOI:10.1186/s12957-015-0496-7 |
| [10] |
N.R. Datta, R. David, R.K. Gupta, J. Cancer Res. Ther. 67 (2018) 9-13. |
| [11] |
M. Milosevic, S. Voruganti, R. Blend, et al., Radiother. Oncol. 47 (1998) 277-284. DOI:10.1016/S0167-8140(97)00232-6 |
| [12] |
K.I. Ly, E.R. Gerstner, Curr. Treat Option Oncol. 19 (2018) 40. DOI:10.1007/s11864-018-0558-5 |
| [13] |
M. Toussaint, S. Pinel, F. Auger, et al., Theranostics 7 (2017) 436-451. DOI:10.7150/thno.17218 |
| [14] |
J. Hempel, C. Brendle, B. Bender, et al., J. Neuro-Oncol. 139 (2018) 373-381. DOI:10.1007/s11060-018-2872-y |
| [15] |
T. Xie, X. Chen, J. Fang, et al., J. Magn. Reson. Imaging 47 (2018) 1099-1111. DOI:10.1002/jmri.25835 |
| [16] |
C.I. Olariu, H.H.P. Yiu, L. Bouffier, et al., J. Mater. Chem. 21 (2011) 12650. DOI:10.1039/c1jm11370d |
| [17] |
P. Lebdusková, A. Sour, L. Helm, et al., Dalton Trans. 28 (2006) 3399-3406. |
| [18] |
J. Li, S. Wang, C. Wu, Y. Dai, et al., Biosens. Bioelectron. 86 (2016) 1047-1053. DOI:10.1016/j.bios.2016.07.044 |
| [19] |
L. Wang, H. Lin, L. Ma, J. Jin, et al., Nanoscale 13 (2017) 4516-4523. |
| [20] |
W. Fang, Y. Wei, J. Innov. Opt. Health Sci. 9 (2016) 1630006. DOI:10.1142/S1793545816300068 |
| [21] |
B. Cai, Z. Huang, Z. Wu, et al., Dalton Trans. 45 (2016) 14063-14070. DOI:10.1039/C6DT02304E |
| [22] |
S.L. Mekuria, T.A. Debele, H. Tsai, ACS Appl. Mater. Interfaces 9 (2017) 6782-6795. DOI:10.1021/acsami.6b14075 |
| [23] |
J. Liu, X. Tian, N. Luo, et al., Langmuir 30 (2014) 13005-13013. DOI:10.1021/la503228v |
| [24] |
A. Saha, S.C. Mohanta, K. Deka, P. Deb, P.S. Devi, ACS Appl. Mater. Interfaces 9 (2017) 4126-4141. DOI:10.1021/acsami.6b12804 |
| [25] |
A. Rammohan, G. Mishra, B. Mahaling, et al., ACS Appl. Mater. Interfaces 8 (2016) 350-362. DOI:10.1021/acsami.5b08885 |
| [26] |
C. Zhou, H. Wu, C. Huang, M. Wang, N. Jia, Part. Part. Syst. Charact. 31 (2014) 675-684. DOI:10.1002/ppsc.201300342 |
| [27] |
M. Ahre'n, L. Selegård, A. Klasson, et al., Langmuir 26 (2010) 5753-5762. DOI:10.1021/la903566y |
| [28] |
C. Sun, O. Veiseh, J. Gunn, et al., Small 4 (2008) 372-379. DOI:10.1002/smll.200700784 |
| [29] |
P. Caravan, J.J. Ellison, Chem. Rev. 99 (1999) 2293-2352. DOI:10.1021/cr980440x |
| [30] |
Y. Deng, H. Wang, W. Gu, et al., J. Mater. Chem. B 2 (2014) 1521-1529. DOI:10.1039/C3TB21613F |
| [31] |
R. Huang, L. Han, J. Li, et al., Biomaterials 32 (2011) 5177-5186. DOI:10.1016/j.biomaterials.2011.03.075 |
| [32] |
O. Cohen-Inbar, M. Zaaroor, J. Clin. Neurosci. 33 (2016) 52-58. DOI:10.1016/j.jocn.2016.04.012 |
| [33] |
F.M. Kievit, O. Veiseh, C. Fang, et al., ACS Nano 4 (2010) 4587-4594. DOI:10.1021/nn1008512 |
| [34] |
W. Qiao, L. Zhao, S. Wu, et al., J. Neuro-Oncol. 133 (2017) 287-295. DOI:10.1007/s11060-017-2456-2 |
| [35] |
Y. Yang, Z. Huang, X. Pu, et al., Cell Proliferat. (2018) e12486. |
| [36] |
L. Zhao, J. Zhu, ACS Appl. Mater. Interfaces 7 (2015) 19798-19808. DOI:10.1021/acsami.5b05836 |
| [37] |
X.S. Wu, X.C. Jian, B. Yin, Z.J. He, Chin. J. Cancer 29 (2010) 626-630. DOI:10.5732/cjc.009.10359 |
| [38] |
Y. Cheng, J. Zhao, W. Qiao, K. Chen, Am. J. Nucl. Med. Mol. Imaging 4 (2014) 385-405. |
| [39] |
M. Li, M. Gao, Y. Fu, et al., Colloid Surf. B 140 (2016) 11-18. DOI:10.1016/j.colsurfb.2015.12.025 |
| [40] |
Q. Mu, M. Jeon, M. Hsiao, et al., Adv. Healthc. Mater. 4 (2015) 1236-1245. |
| [41] |
G. NH, J. Li, Nanomed-Nanotechnol. 7 (2016) 1000393. |
| [42] |
Y. Cui, M. Zhang, F. Zeng, et al., ACS Appl. Mater. Interfaces 8 (2016) 32159-32169. DOI:10.1021/acsami.6b10175 |
| [43] |
R. Mustafa, Y. Luo, Y. Wu, R. Guo, X. Shi, Nanomater.-Basel 5 (2015) 1716-1731. DOI:10.3390/nano5041716 |
| [44] |
J. Sui, Y. Cui, H. Cai, et al., Nanoscale 9 (2017) 2755-2767. DOI:10.1039/C6NR09639E |
| [45] |
C. Carvalho, Curr. Med. Chem. 16 (2009) 3267-3285. DOI:10.2174/092986709788803312 |
| [46] |
D. Coman, Y. Huang, J.U. Nmr, Biomedicine 29 (2016) 309-319. |
| [47] |
A. Ponta, Y. Bae, Pharm. Res-Dordr. 27 (2010) 2330-2342. DOI:10.1007/s11095-010-0120-z |
| [48] |
Z. Wu, Z. Huang, G. Yin, L. Wang, F. Gao, J. Colloid Interface Sci. 466 (2016) 1-11. DOI:10.1016/j.jcis.2015.10.048 |
| [49] |
G. Gu, Q. Hu, X. Feng, et al., Biomaterials 35 (2014) 8215-8226. DOI:10.1016/j.biomaterials.2014.06.022 |
| [50] |
D. Lu, X. Wen, J. Liang, X. Zhang, et al., Chin. J. Polym. Sci. 26 (2008) 369-374. DOI:10.1142/S0256767908003023 |
| [51] |
S. Yu, Z. Wang, G. Wu, Y. Wang, et al., Acta Polym. Sin. 12 (2012) 427-432. DOI:10.3724/SP.J.1105.2012.11222 |
| [52] |
H. Li, S. Bian, Y. Huang, et al., J. Biomed. Mater. Res. A 102 (2014) 150-159. DOI:10.1002/jbm.a.34680 |
| [53] |
F. Meng, Y. Zhong, R. Cheng, C. Deng, Z. Zhong, Nanomed.-UK 9 (2014) 487-499. DOI:10.2217/nnm.13.212 |
| [54] |
D. Bi, L. Zhao, R. Yu, et al., Drug Deliv. 25 (2018) 564-575. DOI:10.1080/10717544.2018.1440447 |
| [55] |
W. Cheng, C. Liang, L. Xu, et al., Small 13 (2017) 1700623. DOI:10.1002/smll.201700623 |
| [56] |
Y. Lin, W. Yao, Y. Cheng, et al., J. Mater. Chem. 22 (2012) 5684. DOI:10.1039/c2jm15133b |