 2020, Vol. 31

b Yiyang Wanjingyuan Electronics Co., Ltd., Yiyang 413000, China;
c College of Traffic Engineering, Hunan University of Technology, Zhuzhou 412008, China;
d Key Laboratory of Materials Processing and Mold (Zhengzhou University), Ministry of Education, Zhengzhou University, Zhengzhou 450002, China;
e State Key Lab of Chemical Engineering, School of Chemical Engineering and Technology, Tianjin University, Tianjin 300072 China
The increasing cost hinders the development of lithium-ion batteries (LIBs) in stationary power sources, although they have been regarded as the most promising power source for electric vehicles (EVs) [1-4]. In recent years, sodium ion batteries (SIBs) and potassium ion batteries (KIBs) have attracted great attention for their inexpensive prices and global widespread resources [5-8]. Unfortunately, the commercialization of SIBs and KIBs is sluggish due to the lack of suitable host electrode materials. Compared with SIBs, KIBs have two advantages. Firstly, the standard electrochemical potential of K+/K is lower than that of Na+/Na, which brings higher working voltage and energy density for KIBs. Secondly, potassium ion has the higher ionic conductivity and mobility in organic electrolyte than that of lithium and sodium ions, due to its weak Lewis acidity [9]. Therefore, KIBs are a potential technology for stationary power sources.
Up to now, some advances have been achieved to find the host electrode with good potassium storage property in recent few years. For cathodes, Prussian blue and Prussian white analogues have been studied widely for the high energy density and low cost [10-12]. Besides, layered transition-metal oxides and organic cathodes have also been developed for KIBs [13-17]. Meanwhile, several kinds of materials are regarded as potential anode materials for KIBs, including metal oxides/chalcogenides [18-22], alloy-type materials [23, 24], organic materials [25] and carbonaceous anodes [26]. Among those candidates, carbonaceous anodes have attracted most attention due to the low cost and easy availability [27, 28]. Graphite suffers from a large volume expansion of 61% during potassiation because of the large radius of potassium ion [29]. It can only deliver very limited cyclic performance and rate capability. Carbonaceous materials with expanded interlayer spacing are demonstrated to deliver high electrochemical performance as anode for KIBs, like hard carbon [30, 31]. Ji's group reported the potassium storage property of hard carbon [32]. They prepared spherical hard carbon that showed good cycling stability. However, it delivered inferior rate capability. The huge capacity loss at high rates is due to the sluggish reaction kinetics, which is the main challenge for hard carbon. To overcome this problem, the strategy of heteroatom doping has been developed [33]. Ding et al. reported a S-doped hollow carbon spheres prepared by SiO2-template [34]. During potassiation/depotassiation process, this material showed a high ion diffusion coefficient in the range of 10−10-10-12 cm2/s. Xia and co-workers synthesized a N/O co-doped mesoporous carbon through carbonizing Cu-BTC MOF precursor [35]. The N/O co-doped carbon showed a reversible capacity of 110 mAh/g at 1 A/g, since the co-doping of N and O elements remarkably enhanced the electronegativity and electrical conductivity of hard carbon.
Biomass carbon is considered to be promising materials for energy storage due to low cost and abundant sources, e.g., like reed [36], cotton [37], bamboo [38], etc. Some examples on biomass carbon have been reported in KIBs. For examples, Wang's group prepared a loofah-derived carbon to store potassium with a reversible capacity of about 155 mAh/g over 200 cycles att 100 mA/g [39]. Lu and co-workers obtained a porous carbon by using potato as the precursor [40]. Benefited by the porous structure, it showed a capacity of 152 mAh/g at 1000 mA/g.
In this work, the cotton-derived O/S co-doped hard carbon was prepared through hydrolyzation/sulfuration processes. Benefited from the simultaneous introduction of S and O co-dopants, the final product exhibited a good cyclic stability over 500 cycles with the high Coulombic efficiencies over 99%. Notably, a high reversible capacity of 135 mAh/g was achieved at 2 A/g, indicating the superior rate capability. Furthermore, the influences of hydrolyzation and sulfuration on the structure and potassium storage property were explored.
The used skimmed cotton was bought from a nearby pharmacy store (Jianerkang Co., Ltd., Soochow). To prepare the hydrolytic cotton-derived oxygen/sulfur co-doped carbon (denoted as H-OS-C), the hydrolyzation/sulfuration processes are necessary. In a typical synthesis, the absorbent cotton was immersed into 0.5 mol/L HCl aqueous solution for 24 h at 60 ℃, firstly. Then, the partially hydrolytic cotton was washed with deionized water (DI water) several times to remove residuary HCl. After drying at 80 ℃ overnight, the cottons were calcined with sublimed sulphur powder at 850 ℃ (hearting rate: 5 ℃/min) in Argon flow. The mass ratio between cotton and sulphur powder was 2:1. At last, the fabricated O/S co-doped carbon was immersed into CS2 to wash residuary S out. For comparison, another three samples were also prepared. The hydrolytic cotton-derived O-doped carbon (denoted as H-O-C) was fabricated by carbonizing hydrolytic cotton without sublimed Sulphur powder. The O/S-doped carbon (denoted as OS-C) was synthesized without the hydrolyzation process and the cotton-derived O-doped carbon (denoted as O-C) was obtained by carbonizing skimmed cotton in Argon flow directly.
The X-ray powder diffraction (XRD, Rigaku D/max-2500 X-ray diffractometer) was performed with Cu Kα radiation (λ = 0.154056 nm) at a scan rate of 8°/min. The morphologies were characterized by scanning electron microscopy (SEM, Hitachi S4800) and transmission electron microscopy (TEM, Tecnai G2 F20). The Raman spectra were carried out by a 532 nm Raman spectrometer (HORIBA LabRAM HR Evolution Raman spectrometer). The thermogravimetric analysis was conducted in air with a heating rate of 10 ℃/min (TGA, STD Q600 thermogravimetric analyzer). The Brunauer-Emmett-Teller (BET) surface areas and pore size distributions of the four samples were determined by the Nitrogen absorption/desorption measurement (Nova 2000e volumetric adsorption analyzer). The X-ray photoelectron spectroscope (XPS, Thermo scientific Kα spectrometer) was conducted by utilizing Al Kα as the ray source. The Fourier transform infrared spectrometry (FT-IR, NICOLET NEXUS 470) was also employed.
To fabricate the work electrode, the four cotton-derived carbon samples were grinded in the agate mortar to form powder firstly. Then, the carbon powder was mixed with acetylene black and polyvinylidene fluoride with a mass ratio of 80:10:10, as active material, conductive agent, and binder, respectively. The above mixture was stirred in N-methyl pyrrolidone (NMP) to form a slurry. Lastly, the as-prepared slurry was coated on Cu foil and dried at 80 ℃ overnight. A thin potassium plate was used as the counter electrode and a layer of glass fiber (Whatman, grade GF/D) played the role of separator. The electrolyte was 1 mol/L KPF6 dissolved in dimethyl ether (DME). The CR2025 type coin cells were assembled in a glove box filled with Argon atmosphere. Galvanostatic charge/discharge measurements were conducted on a Neware Battery Testing System. The cyclic voltammetry (CV) and electrochemical impedance spectroscopy (EIS) were carried out on an IVIUM electrochemical workstation.
The H—OS—C was prepared through a hydrolyzation reaction, followed by a calcination process. During the hydrolyzation process, the cotton was partially hydrolyzed and its color turned into grayish yellow from white. During the calcination process, the cellulose in cotton fiber was carbonized. Meanwhile, the sulphur powder was sublimed to react with the oxygen-group on the surface of cotton fibers to form O/S- defect sites. At last, the color turned into black, as displayed in Fig. S1 (Supporting information). As shown in the SEM image of H—O—C (Fig. 1a), the H—O—C fibers have a length of several hundreds of micrometers with the diameter of dozens of micrometers. In Fig. 1b, the surface of H—O—C fiber was relatively smooth with some tiny carbon sheet. For the H—OS—C in SEM images (Figs. 1c and d), although it had the similar length and diameter with H—O—C, its surface was much rougher. The S-doping caused this rough surface, leading to increasing its surface area. As can be seen in Figs. 1e and f, there exists no lattice fringes which can be observed, meaning the amorphous structure of these two cotton-derived hard carbons. The SEM images of OS—C and O—C are presented in Fig. S2 (Supporting information). It can be seen that those carbon fibers had a hollow structure and would break into carbon sheets. The large-size carbon fibers will not lead to the terrible potassium storage property, because of the rich defect-sites and hollow structure.

|
Download:
|
| Fig. 1. (a, b) SEM images of H-O-C; (c, d) SEM images of H-OS-C; (e, f) TEM images of H-O-C and H-OS-C. | |
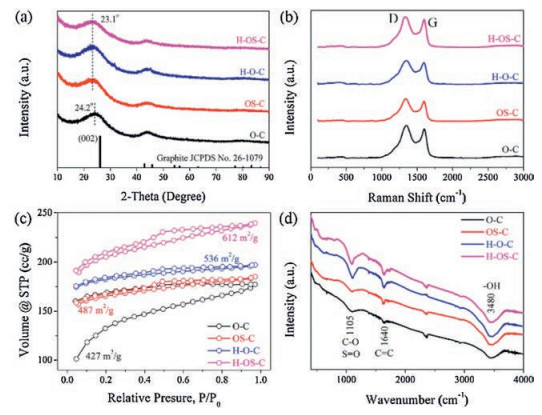
To obtain the structural information of the cotton-derived carbon samples, XRD, Raman, BET and FT-IR techniques were carried out, respectively. The XRD patterns in Fig. 2a have two broad peaks located at about 24° and 44°, which can be assigned to the planes of (002) and (100) in graphitic carbon (JCPDS No. 26-1079). It should be noted that the (002) peaks of OSC, H—O—C, and H—OS—C samples show slight shift to low angles, compared with that of C sample. This means that the S-doping and hydrolyzation strategies could broaden the d-spacing of (002) plane [41, 42], which are beneficial to the storage of potassium ions. The low peak intensity and broad peak width suggest the amorphous structure, which is corresponding to the TEM image shown in Figs. 1e and f. As can be seen from the Raman spectra shown in Fig. 2b, there exist two peaks, namely, D peak (about 1330 cm−1) and G peak (about 1590 cm−1). The D peak is caused by the disordered aromatic structure of saturated carbons, meaning the defect-sites, while the G peak is due to the str etching vibration mode E2g for sp2 carbons [43]. All the four Raman spectra have the similar sharp, a higher D peak and a lower G peak, suggesting the low crystallinity and rich defect-sites. The intensity ratios (ID:IG) of OC, OSC, H—O—C, and H—OS—C samples are 1.08, 1.09, 1.13 and 1.11, respectively. It means the H—O—C and H—OS—C have more defect-sites than OS—C and O—C samples, because the hydrolyzation will bring more oxygen groups (−OH, −COOH). Defect sites can play the role of channel for the diffusion of potassium ions, and more defect sites could bring a better rate performance for potassium storage. Fig. 2c shows the nitrogen adsorption/desorption isotherms of the four samples. Obviously, the H—OS—C has the largest specific surface area of 612 m2/g. The profiles of OSC, H—O—C, and H—OS—C three samples present the same type, the type-Ⅳ adsorption/desorption hysteresis, which suggests the mesoporous structure. On the contrary, the C sample has the smallest specific surface area of 427 m2/g and the different type of adsorption/desorption hysteresis. The pore sizes of the above four samples are centered at about 1.88 nm, indicating the mesoporous structure, as shown in Fig. S3 (Supporting information). As shown in Fig. 2d, the FT-IR spectra prove the existences of CC, C–O, and −OH bonds. In detail, all the four samples have the broad peak at 3480 cm−1 and the small peak at 1640 cm−1, which can be attributed to the str etching vibrations of −OH group and the str etching vibrations of CC bond in aromatic rings. The existence of −OH group means O-defect sites and the CC bonds suggests the successful carbonization. Only the two hydrolyzed cotton-derived samples have the sharp peaks at about 1105 cm−1.

|
Download:
|
| Fig. 2. (a) XRD patterns, (b) Raman spectra, (c) Nitrogen adsorption/desorption isotherms and (d) FT-IR profiles of the O-C, OS-C, H-O-C and H-OS-C samples. | |
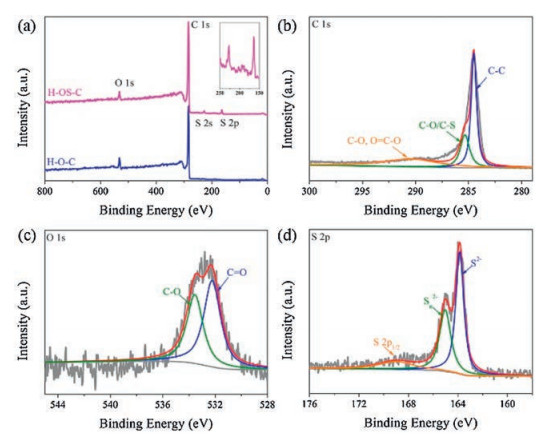
Furthermore, XPS measurements were conducted to determine the elemental composition. Fig. 3a shows the survey spectrum of H-OS-C and H-O-C samples. For H-OS-C, there exist four peaks assigned to S 2s, S 2p, C 1s, and O 1s, located at about 164 eV, 230 eV, 284.6 eV, and 532 eV, respectively. From the relative peak intensities, it can be known that the content of carbon element is high. Besides, the survey spectrum of H-O-C only shows the peaks of C 1s and O 1s. As can be seen from the C 1s spectrum of H-OS-C (Fig. 3b), the carbon peak can be divided into three different parts, including C-C peak (284.6 eV), C–O/C-S peak (285.5 eV) and the broad C—O/O═C—O peak (289 eV) [31]. The O 1s spectrum (Fig. 3c) also reveals the existences of C—O and C═O peaks, which corresponded to the FT-IR spectrum of H-OS-C. In Fig. 3d, the S 2p spectrum is fitted by three peaks. The two peaks assigned to S2− (163.8 eV) and polysulfides (Sn2−, 164.5 eV) indicate the successful doping of S element enhances the electronic conductivity and diffusion rates of potassium ions. The peak located at about 169 eV is the spin-orbit of S 2p1/2 [44]. The atomic contents of C, O, S for H-OS-C are 93.48%, 4.45% and 2.06%, respectively. The high-resolution C 1s and O 1s spectra of H-O-C display the similar shapes with those of H-OS-C, as shown in Fig. S4 (Supporting information).

|
Download:
|
| Fig. 3. XPS spectra. (a) Survey spectrum of H-OS-C and H-O-C. High-resolution C 1s spectrum (b), O 1s spectrum (c) and S 2p spectrum of H-OS-C (d). | |
To evaluate the potassium storage of the as-prepared cotton-derived carbon samples, CV and galvanostatic charge/discharge measurements were carried out. Fig. 4a displays the CV curves of the H-OS-C in the initial three cycles at a sweeping rate of 0.2 mV/s. A large cathodic peak at 0.05 V was observed, which was caused by the insertion of potassium ions. On contrast, as shown in Figs. S5a and c (Supporting information), the corresponding cathodic peaks of O-C and OS-C samples were located at 0.2 V. According to some previous works [26, 29, 45, 46], the intercalation reaction potential of graphite anode is lower than that of hard carbon anode. Thus, this difference suggests that O-C and OS-C samples have more graphite crystallite structures and less defect-sites than H-OS-C sample, which are corresponding to the results of FT-IR and Raman spectra. A smaller peak at about 0.7 V was displayed in the first cycle, which was attributed to the reversible electrochemical adsorption and the irreversible formation of solid electrolyte interfaces (SEI) [47]. Correspondingly, two broad peaks at about 0.25 V and higher voltage range were measured, which indicated the extraction of potassium ions and the desorption behavior, respectively. In subsequent cycles, the CV curves did not change a lot, suggesting the good structure stability of H-OS-C during potassiation/depotassiation. The charge/discharge curves in the first three cycles at 0.1 A/g is shown in Fig. 4b. The H-OS-C delivered a high initial discharge capacity of 1278 mAh/g with a low Coulombic efficiency of 46.4%, since the large surface area needs much electrolyte to form the SEI film, leading to these high discharge capacity and low Coulombic efficiency. In the subsequent cycles, there was a significant decrease in discharge capacity to 428 mAh/g in the second cycle and 409 mAh/g in the third cycle. As shown in Fig. S5 (Supporting information), the three samples, H-O-C, OS-C and O-C showed the same capacity degradation trends between the first and second cycles, with H-OS-C. However, their reversible capacities were lower than H-OS-C, especially the O-C sample.

|
Download:
|
| Fig. 4. Electrochemical performances. (a) CV curves at 0.2 mV/s and (b) galvanostatic charge/discharge curves at 0.1 A/g of H-OS-C. (c) Rate capabilities at various current densities and (d) cyclic performances at 1 A/g of the O-C, OS-C, H-O-C, and H-OS-C electrodes. (e) Long-term cyclability of H-OS-C at 2 A/g. | |
The outstanding rate capability of the H-OS-C anode was also demonstrated at various current density from 0.1 A/g to 2 A/g, as displayed in Fig. 4c. The H-OS-C delivered the high capacities of 409, 322, 255, and 185 mAh/g at 0.1, 0.2, 0.5 and 1 A/g, respectively. At the high current density of 2 A/g, it still maintained a reversible capacity of 135 mAh/g, much higher than those of H—O—C, OS—C and O—C samples. Furthermore, when the rate capability was examined at 0.1 A/g one again, the discharge capacity recovered to 399 mAh/g. This surprising rate performance could be attributed to the porous structure, rich O/S-defect sites and large reaction surface. The cycling performance of the four cotton-derived carbon electrodes is shown in Fig. 4d. Although there was large capacity decay between the first and second cycles, all the four samples showed good cycling stabilities at 1 A/g over 100 cycles. It is believed that the broader d-spacing of (002) plane is attributed to this good cyclic performance. Moreover, as shown in Fig. 4e, prolonged charge/discharge measurements were carried out at 2 A/g to evaluate the cyclic durability of H-OS-C. The initial discharge capacity and Coulombic efficiency were 454 mAh/g and 44.1%, respectively. Subsequently, the discharge capacity decreased to 145 mAh/g and became stable and the Coulombic efficiency gradually increased to about 99.7%. After 500 cycles, a capacity of about 120 mAh/g was still maintained. It demonstrates the ultra-high cycle stability of the H-OS-C electrode (Table 1).
|
|
Table 1 Fitted EIS parameters at the states of before galvanostatic test and after the third charging process. |

To understand the kinetics of potassium storage reaction well, the EIS measurements were conducted. The fitted Nyquist plots of those four samples before and after 3 cycles are shown in Fig. 5. Generally, the EIS can be divided into three parts: The electrolyte resistance in high frequency region (Rs), charge transfer resistance in the middle frequency range (Rct), and a straight line in the low frequency area (capacitance-controlled process). Those three parts can be presented as the fitting circuit in insets. All the EIS patterns can be fitted by the same circuit, where resistor 1 (R1) represents the Rs, the parallel-circuit consisting of a CPE unit (CPE1) and another resistor (R2) denotes the Rct, and the other CPE unit symbolizes the capacitance-controlled process. The R2 value of OS—C is smaller than that of OC, suggesting the better electronic conductivity, because of the S-doping. The increasing contents of the CO and CO bonds will decrease the conductivity of hydrolytic cotton-derived samples. Thus, the H—O—C and H—OS—C have the larger R2 values than the other two samples. After 3 cycles, the all the four R2 values increased because the SEI formed. The CPE-P is a parameter of CPE unit and its values of 0.5 and 1 suggest the diffusion-controlled process and capacitance-controlled process, respectively [48, 49]. Like R2, the value of CPE-P decreased after galvanostatic test. It reveals that potassium ions show a lower diffusion rate in SEI than that in carbon host. More importantly, after three cycles, H—OS—C had the largest CPE-P among four samples, meaning the fastest kinetics of capacitance-controlled process. The rich O/S-defect sites provide the diffusion channel for potassium ions and play the role of activated reaction site, leading to this fast kinetics. According to above discussion, it can be concluded that with enough electronic conductivity, the rate-limited reason of hard carbon is the potassium ion diffusion rate. The hydrolyzation and sulfuration strategies can enhance the ion diffusion rate effectively.

|
Download:
|
| Fig. 5. Fitted EIS patterns at the states of before galvanostatic test and after the third charging process. (a) O-C, (b) OS-C, (c) H-O-C and (d) H-OS-C. The insets show the fitting circuit. | |
In summary, we have successfully converted cotton into O, S-co-doped hard carbon by hydrolyzation/sulfuration processes. The S heteroatom enhance the electronic conductivity and the rich-defect sites structure improves the diffusion rates of potassium ions. When this O/S co-doped carbon served as the anode for KIBs, it exhibited a high reversible specific capacity of 409 mAh/g at low current density of 0.1 A/g, outstanding rate capability (135 mAh/g at 2 A/g), and long cyclic stability (~120 mAh/g overt 500 cycles at 2 A/g) with Coulombic efficiency closed to 100%. Moreover, the potassium storage kinetics was also explored. Its superior potassium storage property was mainly contributed from the capacitance process, especially at large current densities.
Declaration of competing interestThe authors declare that they have no known competing financial interests or personal relationships that could have appeared to influence the work reported in this paper.
AcknowledgmentsThis work was supported by the Natural Science Foundation of Hunan Province (No. 2017JJ1008), the National Natural Science Foundation of China (Nos. 21905086, 51971090) and the Key Research and Development Program of Hunan Province of China (No. 2018GK2031).
Appendix A. Supplementary dataSupplementary material related to this article can be found, in the online version, at doi:https://doi.org/10.1016/j.cclet.2019.10.009.
| [1] |
X. Xie, M. Mao, S. Qi, J. Ma, CrystEngComm 21 (2019) 3755-3769. DOI:10.1039/C9CE00531E |
| [2] |
D. Wu, C. Wang, M. Wu, et al., J. Energy Chem. 43 (2020) 24-32. DOI:10.1016/j.jechem.2019.08.003 |
| [3] |
S. Qi, D. Wu, Y. Dong, et al., Chem. Eng. J. 370 (2019) 185-207. DOI:10.1016/j.cej.2019.03.166 |
| [4] |
L. Wang, X. Xie, K.N. Dinh, Q. Yan, J. Ma, Coord. Chem. Rev. 397 (2019) 138-167. DOI:10.1016/j.ccr.2019.06.015 |
| [5] |
S. Qi, B. Xu, V.T. Tiong, J. Hu, J. Ma, Chem. Eng. J. 379 (2020) 122261. DOI:10.1016/j.cej.2019.122261 |
| [6] |
M. Wu, B. Xu, Y. Zhang, et al., Chem. Eng. J. 381 (2020) 122558. DOI:10.1016/j.cej.2019.122558 |
| [7] |
M. Wu, W. Ni, J. Hu, J. Ma, Nano-Micro Lett. 11 (2019) 44. DOI:10.1007/s40820-019-0273-1 |
| [8] |
W. Chen, X. Zhang, L. Mi, et al., Adv. Mater. 31 (2019) e1806664. DOI:10.1002/adma.201806664 |
| [9] |
S. Qi, X. Xie, X. Peng, et al., Phys. Status Solidi-RRL 13 (2019) 1900209. DOI:10.1002/pssr.201900209 |
| [10] |
M. Morant-Giner, R. Sanchis-Gual, J. Romero, et al., Adv. Funct. Mater. 28 (2018) 1706125.. DOI:10.1002/adfm.201706125 |
| [11] |
C. Zhang, Y. Xu, M. Zhou, et al., Adv. Funct. Mater. 27 (2017) 1604307. DOI:10.1002/adfm.201604307 |
| [12] |
C. Li, X.S. Wang, W.J. Deng, et al., Chemelectrochem 5 (2018) 3887-3892. DOI:10.1002/celc.201801277 |
| [13] |
C.L. Liu, S.H. Luo, H.H. Huang, Y.C. Zhai, Z.W. Wang, Chem.Eng. J. 356 (2019) 53-59. DOI:10.1016/j.cej.2018.09.012 |
| [14] |
K. Lei, F. Li, C. Mu, et al., Energy Environ. Sci. 10 (2017) 552-557. DOI:10.1039/C6EE03185D |
| [15] |
M. Zhou, M. Liu, J. Wang, et al., Chem. Commun. 55 (2019) 6054-6057. DOI:10.1039/C9CC01859J |
| [16] |
M. Tang, Y. Wu, Y. Chen, et al., J. Mater. Chem. A 7 (2019) 486-492. DOI:10.1039/C8TA09960J |
| [17] |
C. Zhang, C. Lu, F. Zhang, et al., J. Energy Chem. 27 (2018) 86-98. DOI:10.1016/j.jechem.2017.11.008 |
| [18] |
C. Chen, Y. Yang, X. Tang, et al., Small 15 (2019) e1804740. DOI:10.1002/smll.201804740 |
| [19] |
M. Wu, J. Yang, D.H.L. Ng, J. Ma, Phys. Status Solidi-RRL 13 (2019) 1900329. DOI:10.1002/pssr.201900329 |
| [20] |
L. Li, W. Zhang, X. Wang, et al., ACS Nano 13 (2019) 7939-7948. DOI:10.1021/acsnano.9b02384 |
| [21] |
L. Wang, J. Zou, S. Chen, et al., Energy Storage Mater. 12 (2018) 216-222. DOI:10.1016/j.ensm.2017.12.018 |
| [22] |
L. Tao, Z. Qiang, J. Nat. Gas Chem. 27 (2017) 373-374. |
| [23] |
J. Huang, X. Lin, H. Tan, B. Zhang, Adv. Energy Mater. 8 (2018) 1703496. |
| [24] |
K. Lei, C. Wang, L. Liu, et al., Angew. Chem. Int. Ed. 57 (2018) 4687-4691. DOI:10.1002/anie.201801389 |
| [25] |
Q. Zhao, J. Wang, Y. Lu, et al., Angew. Chem. Int. Ed. 55 (2016) 12528-12532. DOI:10.1002/anie.201607194 |
| [26] |
Z. Jian, W. Luo, X. Ji, J. Am. Chem. Soc. 137 (2015) 11566-11569. DOI:10.1021/jacs.5b06809 |
| [27] |
J. Yang, Z. Ju, Y. Jiang, et al., Adv. Mater. 30 (2018) 1700104. DOI:10.1002/adma.201700104 |
| [28] |
Y. Liu, C. Yang, Q. Pan, et al., J. Mater. Chem. A 6 (2018) 15162-15169. DOI:10.1039/C8TA04694H |
| [29] |
J. Zhao, X. Zou, Y. Zhu, Y. Xu, C. Wang, Adv. Funct. Mater. 26 (2016) 8103-8110. DOI:10.1002/adfm.201602248 |
| [30] |
P. Bai, Y. He, X. Zou, et al., Adv. Energy Mater. 8 (2018) 1703217. |
| [31] |
P. Xiong, X. Zhao, Y. Xu, ChemSusChem 11 (2018) 202-208. DOI:10.1002/cssc.201701759 |
| [32] |
Z. Jian, S. Hwang, Z. Li, et al., Adv. Funct. Mater. 27 (2017) 1700324. DOI:10.1002/adfm.201700324 |
| [33] |
Z. Ju, P. Li, G. Ma, et al., Energy Storage Mater. 11 (2018) 38-46. DOI:10.1016/j.ensm.2017.09.009 |
| [34] |
J. Ding, H. Zhang, H. Zhou, et al., Adv. Mater. 31 (2019) 1900429. |
| [35] |
G. Xia, C. Wang, P. Jiang, et al., J. Mater. Chem. A 7 (2019) 12317-12324. DOI:10.1039/C8TA12504J |
| [36] |
J. Liu, P. Kopold, P.A. van Aken, J. Maier, Y. Yu, Angew. Chem. Int. Ed. 54 (2015) 9632-9636. DOI:10.1002/anie.201503150 |
| [37] |
X. He, J. Liao, Z. Tang, et al., J. Power Sources 396 (2018) 533-541. DOI:10.1016/j.jpowsour.2018.06.073 |
| [38] |
G.X. Zhang, Y.M. Chen, Y.G. Chen, H.B. Guo, Mater. Res. Bull. 102 (2018) 391-398. DOI:10.1016/j.materresbull.2018.03.006 |
| [39] |
Z. Wu, L. Wang, J. Huang, et al., Electrochim. Acta 306 (2019) 446-453. DOI:10.1016/j.electacta.2019.03.165 |
| [40] |
W. Cao, E. Zhang, J. Wang, et al., Electrochim. Acta 293 (2019) 364-370. DOI:10.1016/j.electacta.2018.10.036 |
| [41] |
X.L. Ma, X.Y. Song, Z.Q. Yu, et al., Carbon 149 (2019) 646-654. DOI:10.1016/j.carbon.2019.04.110 |
| [42] |
Y. Wu, C. Zhu, L. Shu, et al., Appl. Surf. Sci. 489 (2019) 528-537. DOI:10.1016/j.apsusc.2019.06.011 |
| [43] |
L.M. Malard, M.A. Pimenta, G. Dresselhaus, M.S. Dresselhaus, Phys. Rep. 473 (2009) 51-87. DOI:10.1016/j.physrep.2009.02.003 |
| [44] |
B.H. Hou, Y.Y. Wang, J.Z. Guo, et al., Nanoscale 10 (2018) 9218-9225. DOI:10.1039/C7NR09674G |
| [45] |
K. Beltrop, S. Beuker, A. Heckmann, M. Winter, T. Placke, Energy Environ. Sci. 10 (2007) 2090-2094. |
| [46] |
W. Luo, J. Wan, B. Ozdemir, et al., Nano Lett. 15 (2015) 7671-7677. DOI:10.1021/acs.nanolett.5b03667 |
| [47] |
E. Peled, S. Menkin, J. Electrochem. Soc. 164 (2017) A1703-A1719. DOI:10.1149/2.1441707jes |
| [48] |
L. Yang, Y.E. Zhu, J. Sheng, et al., Small 13 (2017) 1702588. DOI:10.1002/smll.201702588 |
| [49] |
H. Yang, R. Xu, Y. Yao, et al., Adv. Funct. Mater. 29 (2019) 1809195. DOI:10.1002/adfm.201809195 |