 2020, Vol. 31


b Department of Chemistry, Tsinghua University, Beijing 100084, China;
c Department of Pharmacology and Pharmaceutical Sciences, School of Medicine, Tsinghua University, Beijing 100084, China
Proteins serve various and significant functions in biological processes, such as enzymatic activity, transporting signals in cells, and mobilizing intracellular responses, due to their diverse three-dimensional physical structures [1, 2]. Therefore, more and more proteins are regarded as biomarkers for tumors, neurodegenerative diseases, inflammation and other diseases, which are evaluated as indicators of physiological or pathological processes. Remarkably abnormal expression of biomarkers, compared to healthy expression, reveals the presence of pathological dysfunction in an organism, precise and accurate detection of biomarkers is highly important [3, 4]. To date, many biosensors, such as fluorescent, electrochemical, and colorimetric biosensors, have been reported [5-10], among which fluorescent biosensors have attracted the most attention due to their high sensitivity and facile operation.
Aptamers, artificial single-stranded nucleic ligands obtained via systematic evolution of ligands by exponential enrichment (SELEX), can specifically bind to their targets, such as proteins, nucleic acids, small molecules, cells, and even bacteria [11, 12]. Compared to antibodies, aptamers are more easily synthesized, more stable, and cost less. In recent years, much research interest has been focused on coupling aptamers with sensors to create multi-functional aptasensors. As such, several aptasensors have been prepared with nanoparticles, graphene, quantum dots, polymers [13-17], and magnetic beads [18, 19], where the latter has shown greater advantages in complex aptasensor systems due to their large surface-to-volume ratio and easy separation.
The DNA G-quadruplex secondary structure is primarily regarded as an important drug target for cancers and other diseases since it displays great biological significance. The secondary structure is formed from a guanine-rich sequence through Hoogstee hydrogen bonding in the presence of specific monovalent cations, such as Na+ and K+ [20]. G-quadruplex, also used as an optical sensing element, can interact with G-quadruplex antibodies and molecular probes and can catalyze enzymatic reactions to produce clear fluorescence or visible signals [21, 22]. N-Methylmesoporphyrin Ⅸ (NMM), an anionic macrocyclic compound probe, is inserted into the sheet-like structure of G-quadruplex to construct a fluorescent biosensor. Although the fluorescence intensity of free NMM is very weak, it exhibits strong fluorescence enhancement upon binding with the G-quadruplex at an excitation of 399 nm [23, 24]. Numerous researchers have investigated this chromogenic method, as it avoids the modification of fluorophores and is easier-to-use and inexpensive.
Exonuclease Ⅲ (Exo Ⅲ) can recognize and cleave the 3′ blunt and sticky end of double-stranded DNA into DNA fragments, which assists the cycle amplification in the detection of specific targets, such as DNA [23]. Detection signals accumulate and increase via several Exo Ⅲ-aided amplification cycles, greatly improving the sensitivity of the detection [25, 26]. In this study, we developed a sensitive and selective fluorescent aptasensor for target detection, integrating the excellent specificity between the aptamer and target, high sensitivity of the fluorescence signal provided by G-quadruplex and Exo Ⅲ-aided recycling amplification. MUC1, a typical tumor biomarker distributed and abundantly expressed on the surface of cancer cells, was chosen as the proof-of-concept target. The proposed aptasensor strategy showed strong anti-interference in the biosystem, suggesting its great potential in practical applications and disease diagnoses.
As shown in Fig. 1, this sensing process consists of a recognition step and an amplification step. In the recognition step, the aptamer strand binds to magnetic beads through biotin-streptavidin interaction, while the ssDNA strand hybridizes with the aptamer. In presence of the target, the aptamer recognizes the target and forms a specific conformation to bind with the target, disturbing the hybridization and causing the ssDNA to release from the aptamer strand after magnetic separation. The free ssDNA as a trigger initiates the amplification by hybridizing with part of the hairpin DNA sequence, which opens the hairpin structure. The other part of the hairpin DNA sequence forms a G-quadruplex structure in the presence of K+, which is locked in the hairpin structure. In the amplification step, Exo-Ⅲ recognizes the 3′ blunt end of the duplex sequence and cleaves the strand from 3′ to 5′ into oligonucleotides. It is worth mentioning that 7-T bases are added at the 3′ end of the ssDNA sequence that could not be paired with the hairpin in order to avoid the recognition of the Exo Ⅲ. After Exo Ⅲ digestion, the ssDNA becomes free and enters into the next cycle, while the G-quadruplex structure remains intact. Subsequently, NMM can insert into the sheet-like structure of G-quadruplex and result in an obvious fluorescence enhancement excited at 399 nm, which is enlarged significantly after several cycles. Comparatively, in the absence of the target, ssDNA is paired and thus cannot initiate the amplification or enhance the signal change.

|
Download:
|
| Fig. 1. Schematic diagram of turn-on fluorescence assay for target proteins. | |
MUC1 is a highly glycosylated protein expressed by the MUC1 gene, a transmembrane molecule. It has been found to be overexpressed in most human adenocarcinomas, such as breast, gastric, colorectal, lung, prostate, ovarian, pancreatic, and bladder carcinomas [27, 28]. Since it is regarded as an important tumor biomarker due to its abnormal expression in tumor tissues, we employed MUC1 as the model target to verify the feasibility of the strategy. A commonly used aptamer, 5′-GCAGTTGATCCTTTGGATACCCTGG-3′, was selected to specifically recognize MUC1.
Fig. 2 shows that the fluorescence intensity at 610 nm increased after amplification by Exo Ⅲ compared to the control groups. The fluorescence intensity of the amplification strategy is much stronger than that of the non-amplification strategy, indicating that our strategy successfully detected the target protein.

|
Download:
|
| Fig. 2. Fluorescence emission spectra under different conditions: With MUC1 + with Exo Ⅲ (curve a), without MUC1 + with Exo Ⅲ (curve b), with MUC1 + without Exo Ⅲ (curve c), and with only NMM and Tris-HCl buffer (curve d). | |
In order to reduce the experimental background interference and improve the efficiency of the reaction, we optimized the stem length of the hairpin DNA and the bases of the complementary pairing between the aptamer and ssDNA, respectively.
The bases of the complementary pairing between the aptamer and single strand DNA (ssDNA) determine the efficiency of the reaction with MUC1. We optimized the paired bases from 6 nt to 17 nt (ssDNA1 to ssDNA5 sequences are displayed in Table S1 in Supporting information). As shown in Fig. S1A (Supporting information), with 6 nt or 9 nt complementary bases (ssDNA1 or ssDNA2), the combination between the aptamer and ssDNA was extremely unstable so that the ssDNA was eliminated during the washing process. Only a small amount ssDNA retained and was collected to enter the amplification part, resulting in low fluorescence intensity. With 15 nt or 17 nt complementary bases (ssDNA4 or ssDNA5), the combination between the aptamer and ssDNA was so tight that the ssDNA could not be released easily when incubated with MUC1. Again, a small portion of ssDNA was released and entered the amplification part, causing low fluorescence. As a result, we chose 12 nt complementary bases (ssDNA3) to pair with the aptamer for subsequent experiments.
The length of the hairpin's stem directly affects its stability and hybridization with ssDNA. As shown in Table S1, we synthesized 5 hairpin DNA sequences, including hairpins 6, 7, 3, 8, and 9 with the stem lengths of 13, 15, 17, 19, and 21 bases, respectively. Fig. S1B (Supporting information) displays the difference in fluorescence intensity before and after the reaction, where fluorescence increased with larger stem lengths of the hairpin DNA. Fluorescence intensity was low when the stem length was 13 or 15 bases and enhanced when the stem length increased to 17 bases. As a result, we selected the hairpin3 sequence with a stem length of 17 bases for subsequent experiments.
To optimize detection of the target protein, we determined the most suitable conditions based on factors affecting the strategy, including pH, incubation and amplification times, and concentrations of metal ions, Exo Ⅲ, hairpin DNA, and NMM.
In detection biosystems, pH directly is highly significant since it correlates to the stability, enzyme activity, and other reaction elements. Therefore, we investigated the best pH value of the buffer in our detection system. Fig. S2A (Supporting information) shows that the maximum fluorescence intensity was reached at pH 7.5, the neutral physiological condition under which DNA is most stable. Therefore, pH 7.5 was one optimal condition used in the following experiments.
The concentration of metal ions crucially affects the formation of G-quadruplex, which is directly related to the fluorescence signal. As shown in Fig. S2B (Supporting information), the fluorescence intensity enhanced gradually with the increasing concentration of K+ and reached a plateau when the concentration of K+was 100 mmol/L, indicating that the released G-quadruplex-forming strands fully formatted the G-quadruplex structure. Thus, 100 mmol/L was chosen for the following experiments. Considering that Mg2+ has been reported as an essential influence of Exo Ⅲ activity and also inhibits the stability of G-quadruplex, we explored the optimal concentration of Mg2+. In Fig. S2C (Supporting information), the fluorescence intensity reached a maximum when the concentration of Mg2+ was 8 mmol/L. A larger concentration of Mg2+ dramatically decreased the fluorescence signal, which can be attributed to the destruction of the G-quadruplex stability by the over-dosage of Mg2+ [24]. Thus, 8 mmol/L Mg2+ was determined as the optimal concentration.
Exo Ⅲ plays a crucial role in the cycle amplification process. Compared with the non-amplification strategy, our strategy demonstrated a four-fold enhancement in fluorescence intensity. Fig. S2D (Supporting information) shows a rapidly enhanced fluorescence intensity when Exo Ⅲ increased from 0 to 50 U, confirming that the cycle amplification process occurred as expected. Thus, 50 U of Exo Ⅲ was employed for the next experiments.
As a substrate of the Exo Ⅲ-aided amplification, the concentration of hairpin structure directly affects the activity of Exo Ⅲ. Because hairpin3 with stem length of 17 base pairs was chosen as the optimal structure and resulted in the best signal as previously described, we further investigated the optimal concentration of hairpin3. Like other common enzymatic dynamic reactions, a rapid and obvious fluorescence signal enhancement was obtained when the concentration of hairpin3 increased from 0 to 1000 nmol/L and reached a plateau at 1000 nmol/L. This finding indicates that the enzymatic reaction occurred quickly at first and achieved dynamic equilibrium gradually (Fig. S2E in Supporting information). Thus, 1000 nmol/L hairpin3 was utilized in subsequent experiments.
NMM is another significant factor affecting the detection sensitivity since it inserts into the G-quadruplex to further produce the fluorescence signal. As shown in Fig. S2F (Supporting information), the fluorescence intensity increased with the addition of NMM. When the concentration of NMM was 10 μmol/L, the fluorescence intensity reached an equilibrium state, while greater addition of NMM did not contribute to further enhancement of fluorescence intensity. This suggests that a saturation state exists between NMM and G-quadruplex, and thus, 10 μmol/L NMM was chosen as the optimal concentration.
For an aptasensor to fully recognize a target, a certain incubation time is required, which is directly related to signal production. Fig. S2G (Supporting information) shows that the fluorescence intensity increased rapidly when the incubation time was prolonged, evincing that there was a gradual binding process between MUC1 and the aptamer. The fluorescence intensity exhibited little change when the incubation time exceeded 1 h, indicating that the ssDNA was fully released; thus, 1 h was determined as the optimal incubation time.
The amplification time heavily influences the efficiency of the aptasensor system. Fig. S2H (Supporting information) shows that increasing the amplification time from 0 to 1.5 h, the fluorescence intensity enhanced, suggesting the constant release of G-quadruplex. The fluorescence intensity plateaued when the amplification time was 1.5 h, demonstrating that hairpin3 fully reacted. As a result, we chose 1.5 h as the amplification time for the following experiments.
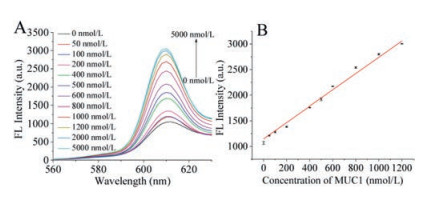
The sensitivity of the system was investigated in 20 mmol/L Tris-HCl buffer solution. As shown in Fig. 3A, the fluorescence intensity markedly enhanced with the addition of MUC1. The spectra displayed good linearity between fluorescence and MUC1 concentrations in the range of 0–1200 nmol/L, suggesting that MUC1 could be quantitatively detected by the biosensor in the buffer solution. The limit of detection was calculated to be 3.68 nmol/L.

|
Download:
|
| Fig. 3. (A) Fluorescence emission spectra under different concentrations of MUC1 in 20 mmol/L Tris-HCl buffer. (B) The calibration curve of MUC1 concentration ranging from 0 to 1200 nmol/L in 20 mmol/L Tris-HCl buffer (pH 7.5). | |
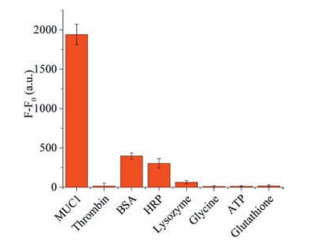
Specificity is one of the most essential parameters to evaluate the validity of a detection system. Therefore, BSA, lysozyme, HRP, thrombin, glycine, ATP, and glutathione (10 μmol/L each) were selected as interferences to test the specificity of the biosensor for MUC1 (5 μmol/L). As shown in Fig. 4, the fluorescence intensity of MUC1 was obviously stronger than those of the interference proteins, which demonstrates that our strategy has great specificity.

|
Download:
|
| Fig. 4. The difference of fluorescence intensity of the biosensor in the presence of MUC1 (5 μmol/L), thrombin (10 μmol/L), BSA (10 μmol/L), HRP (10 μmol/L), lysozyme (10 μmol/L), glycine (10 μmol/L), ATP (10 μmol/L), and glutathione (10 μmol/L) respectively. | |
To evaluate the use of the aptasensor in biological samples, we also tested the proposed aptasensor in 10% serum. Fig. S3A (Supporting information) shows that the fluorescence intensity at different concentrations dropped nearly three-fold due to the influence of the complex components in the serum. In addition, good linearity was observed between the fluorescence and MUC1 concentration in the range of 0–1000 nmol/L, and the limit of detection was calculated to be 12.83 nmol/L in 10% serum system (Fig. S3B in Supporting information). A further recovery test was carried out by adding different concentrations (200, 600 and 1000 nmol/L) of MUC1 in the 10% serum samples. The results in Table S3 (Supporting information) reveal good recoveries were obtained from 86.12% to 109.11% with relative standard deviations (RSD) from 2.42% to 5.15%, which demonstrate that our strategy is reliable, quantitative, and sensitive enough for the detection of target proteins in both buffer and serum samples.
In conclusion, a simple, universal, highly sensitive, and selective fluorescence signal amplification biosensor based on G-quadruplex and Exo Ⅲ was developed for the detection of target protein MUC1. Our strategy consists of a recognition part and an amplification part. The recognition part, involving magnetic beads and the aptamer, is used to capture target proteins and release ssDNA as a trigger DNA, while the amplification part includes Exo Ⅲ-aided recycling amplification to magnify the fluorescence signal. Our biosensor exhibited good sensitivity and selectivity in both a buffer solution and 10% serum system, indicating its strong anti-interference in biosystems. In addition, our strategy can be universally applied for the detection of other proteins by simply replacing the aptamer and, thus, has potential value in the diagnosis and therapeutic evaluation of numerous diseases.
AcknowledgmentsThis work is supported by grants from the National Natural Science Foundation of China (No. 21472060), Shenzhen Municipal government (Nos. JCYJ20160301153959476 and JCYJ20160324163734374), Shenzhen Reform Commission (Disciplinary Development Program for Chemical Biology).
Appendix A. Supplementary dataSupplementary material related to this article can befound, in the online version, at doi:https://doi.org/10.1016/j.cclet.2019.06.020.
| [1] |
H. Li, Y. Huang, Y. Yu, et al., Biosens. Bioelectron. 80 (2016) 560-565. DOI:10.1016/j.bios.2016.02.012 |
| [2] |
X.M. Fu, Z.J. Liu, S.X. Cai, et al., Chin. Chem. Lett. 27 (2016) 920-926. DOI:10.1016/j.cclet.2016.04.014 |
| [3] |
V. Thilo, A. Angelo, B. Daniela, et al., Alzheimer's Dementia 11 (2019) 301-309. |
| [4] |
D. Yue, M. Wang, F. Deng, et al., Chin. Chem. Lett. 29 (2018) 648-656. DOI:10.1016/j.cclet.2018.01.046 |
| [5] |
L. Chang, H. Wu, X. He, et al., Anal. Chim. Acta 995 (2017) 91-98. DOI:10.1016/j.aca.2017.09.037 |
| [6] |
M. Devillers, L. Ahmad, H. Korri-Youssoufi, et al., Biosens. Bioelectron. 96 (2017) 178-185. DOI:10.1016/j.bios.2017.04.031 |
| [7] |
C.C. Chang, C.Y. Chen, T.L. Chuang, et al., Biosens. Bioelectron. 78 (2016) 200-205. DOI:10.1016/j.bios.2015.11.051 |
| [8] |
S. Huang, S. Lu, C. Huang, et al., Sensor. Actuat. B-Chem. 224 (2016) 22-30. DOI:10.1016/j.snb.2015.10.008 |
| [9] |
S. Wang, L. Wang, X.W. Xu, et al., Anal. Chim. Acta 1063 (2019) 152-158. DOI:10.1016/j.aca.2019.02.049 |
| [10] |
C. Chen, X. Ji, Chin. Chem. Lett. 29 (2018) 1287-1290. DOI:10.1016/j.cclet.2017.10.013 |
| [11] |
M. Mckeague, E.M. Mcconnell, J. Cruz-Toledo, et al., J. Mol. Evol. 81 (2015) 150-161. DOI:10.1007/s00239-015-9708-6 |
| [12] |
A. Qureshi, Y. Gurbuz, J.H. Niazi, Sensor. Actuat. B-Chem. 209 (2015) 645-651. DOI:10.1016/j.snb.2014.12.040 |
| [13] |
Y.H. Lao, C.W. Chi, S.M. Friedrich, et al., ACS Appl. Mater. Inter. 8 (2016) 12048-12055. DOI:10.1021/acsami.6b02871 |
| [14] |
A.L. Sun, Y.F. Zhang, G.P. Sun, et al., Biosens. Bioelectron. 89 (2017) 659-665. DOI:10.1016/j.bios.2015.12.032 |
| [15] |
W. Ding, C. Song, T.L. Li, et al., Talanta 199 (2019) 442-448. DOI:10.1016/j.talanta.2019.02.002 |
| [16] |
H.Y. Zhu, S.N. Ding, Biosens. Bioelectron. 134 (2019) 109-116. DOI:10.1016/j.bios.2019.04.005 |
| [17] |
X. Liu, L. Meng, J. Chen, et al., Chin. Chem. Lett. 29 (2018) 1321-1322. DOI:10.1016/j.cclet.2018.03.004 |
| [18] |
H. Modh, T. Scheper, J.G. Walter, Sensors 18 (2018) 1041-1062. DOI:10.3390/s18041041 |
| [19] |
H. Modh, M. Witt, K. Urmann, et al., Talanta 172 (2017) 199-205. DOI:10.1016/j.talanta.2017.05.037 |
| [20] |
T. Ishizuka, A. Yamashita, Y. Asada, et al., ACS Omega 2 (2017) 8843-8848. DOI:10.1021/acsomega.7b01405 |
| [21] |
P. Zhu, Y. Zhang, S. Xu, X. Zhang, Chin. Chem. Lett. 30 (2019) 58-62. DOI:10.1016/j.cclet.2018.02.003 |
| [22] |
T.X. Chen, F. Ning, H.S. Liu, et al., Chin. Chem. Lett. 28 (2017) 1380-1384. DOI:10.1016/j.cclet.2017.01.006 |
| [23] |
H. Yue, C. Wang, Q. Zhao, et al., Talanta 172 (2017) 171-175. DOI:10.1016/j.talanta.2017.05.041 |
| [24] |
Y. Liu, R. Liao, H. Wang, et al., Talanta 176 (2017) 422-427. |
| [25] |
X. Lei, S. Xin, B. Li, et al., Anal. Chim. Acta 980 (2017) 58-64. DOI:10.1016/j.aca.2017.05.015 |
| [26] |
L.L. Wang, L.H. Dong, G. Liu, et al., Microchim. Acta 186 (2019) 286-291. DOI:10.1007/s00604-019-3368-y |
| [27] |
S. Satomi, M. Atsushi, O. Hideyuki, et al., J. Surg. Res. 238 (2019) 79-89. DOI:10.1016/j.jss.2019.01.006 |
| [28] |
Z. Zhou, H. Lin, C. Li, et al., Chin. Chem. Lett. 29 (2018) 19-26. DOI:10.1016/j.cclet.2017.09.047 |