 2020, Vol. 31


b Engineering Center for Environmental Pollution Control, Chinese Research Academy of Environmental Sciences, Beijing 100012, China;
c National Engineering Laboratory for Lake Pollution Control and Ecological Restoration, Chinese Research Academy of Environmental Sciences, Beijing 100012, China;
d State Environmental Protection Key Laboratory for Lake Pollution Control, Chinese Research Academy of Environmental Sciences, Beijing 100012, China
About 10 Gt CO2-eq total anthropogenic greenhouse gas (GHG) had increased in each year between 2000 and 2010, which was mainly from energy consumption, industrial production, transportation and building activities, and the emissions of methane (CH4), nitrous oxide (N2O), and fluorinated gases accounted for 27% of the total non-CO2 GHG emissions in 2010 [1]. Since the beginning of industrialization, N2O concentration in the atmosphere increased 1.2 times, which accounted for 6.2% of the total anthropogenic GHG emissions in 2010. In 2011, atmospheric N2O reached 324 ppb, which has increased steadily at 0.73 0.03 ppb per year in the past three decades, and was 40% higher than that of pre-industrialization period [2]. Compared with CO2, the global warming potential of N2O is about 265-fold higher and its temperature influence capacity is 234-fold greater on a 100-year time horizon. The mean residence time of N2O in the atmosphere is 121 years, which results in the difficulty of self-purification [3]. Moreover, it is predicted to be the strongest ozone layer depleting substance [4]. N2O can transform into nitric oxide (NO) and nitrogen dioxide (NO2), thus leads to the destruction of stratospheric ozone layer [5, 6] and the formation of photochemical smog and acid rain, which increases the risk of skin cancer and other illnesses of human beings [7]. In addition to its impacts on the atmosphere, N2O has great biological influences for its inactivation of vitamin B12 (cobalamin) [8].
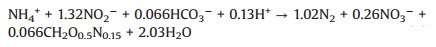
Soil ecosystem is the dominant N2O emission source, and more than 65% of the atmospheric N2O is derived from the nitrification and denitrification processes in this ecosystem [9]. Agricultural soils approximately account for 50% of the world's anthropogenic N2O emissions [10], which is mainly resulted from fertilizer utilization [1]. Marine and forest ecosystems, followed by fossil fuels burning and chemical production processes are important N2O emission sources as well [3]. Wastewater treatment plants (WWTPs) have been proved to be a key anthropogenic source of atmospheric N2O [11-14], and N2O from wastewater treatment accounts for 3.2%-10.0% of the total emissions including N2O emissions from cultivated soils, biomass burning, combustion, industrial and waste treatment processes [15-17]. Some studies reported that N2O emissions contribute to more than 80% of the total GHG discharged from WWTPs [18, 19]. N2O emission from WWTPs increases rapidly with the fast construction of WWTPs in these years. Tallec et al. reported that global N2O emissions rise at certain rate with the increase of N2O emission from WWTPs [20], which is mainly resulted from the introduction of anoxic zones and low dissolved oxygen (DO) concentration for nitrogen removal improvement to meet the stricter legislation [21]. An inventory of USEPA [22] shows that N2O emission from domestic wastewater treatment systems increases 1.6 Tg CO2-eq during 20 years, and it contributes to 1.6% of the global N2O emissions in 2010. Brandes et al. estimated that N2O from WWTPs accounts for 2.3% of its total emissions in Netherlands [23]. Even if 0.5% of the removed nitrogen transforms into N2O, the GHG footprint of N2O emission is comparable to that of the indirect CO2 emission caused by energy consumption in conventional biological nutrient removal WWTPs [24]. Several enhanced biological nitrogen removal (BNR) processes including partial nitritation-anaerobic ammonium oxidation (anammox) (PNA) and simultaneous nitrification and denitrification (SND), are developed to make up for the cost and effect deficiencies of conventional BNR processes for the treatment of high ammonium (NH4+) wastewater [25, 26]. PNA reactions are illustrated at Eqs. (1) and (2) [27], in which about half of the influent NH4+ converts to NO2- by ammonia-oxidizing bacteria (AOB), while the residual NH4+ reacts with the generated NO2- to produce N2 by anammox bacteria, and small amount of NO3- is generated simultaneously.

|
(1) |
|
(2) |
PNA can be classified into one-stage and two-stage systems. The one-stage system integrate the partial nitritation process and anammox process in a single reactor, while the two-stage system separate them into two reactors. The critical step of partial nitritation is AOB enrichment and nitrite-oxidizing bacteria (NOB) suppression achieved by the control of DO and related chemical substances.
One-stage PNA is usually applied in the side-flow treatment process, and the two-stage system can be applied in mainstream treatment processes under different conditions, such as low effluent concentration requirement, low temperature and high hydraulic loading [28]. Compared with conventional processes, PNA systems can substantially save energy because of less oxygen consumption, no external carbon source addition and lower sludge production [29]. However, N2O emission of PNA systems is obviously higher than traditional nitrification/denitrification systems, which might be resulted from the high NO2- accumulation and NH4+ conversion rates [30]. Kampschreur et al. reported that N2O emission from one-stage PNA systems is lower than that from two-stage systems [31].
In this paper, the N2O emission mechanisms in PNA processes are reviewed, and then the N2O emission data in different scale PNA processes are compared. The key N2O emission influencing factors such as DO, pH, inorganic carbon (IC)/alkalinity/IC to nitrogen ratio (IC/N) ratio, temperature and NO2- concentration are thoroughly discussed as well. Furthermore, different N2O sampling and analytical techniques for gas-phase, liquid-phase and sludge granule N2O are introduced. N2O emission related microbial communities in separate partial nitritation or anammox reactor of two-stage PNA as well as one-stage PNA reactor are analyzed. Finally, the perspectives of N2O emission control in PNA are put forward.
2. N2O production mechanisms in PNA 2.1. N2O production mechanisms in partial nitritationDuring partial nitritation process, N2O is generated by AOB in two different pathways (Fig. 1). One is AOB denitrification, i.e., the reduction of NO2- to N2O via NO reaction by AOB. AOB including Nitrosomonas europaea and N. eutropha affiliated with the order Nitrosomonadales contains homologues of nirK and norQB that encode periplasmic copper containing NO2- reductase (NirK) and NO reductase (Nor), respectively [32]. Under high NO2-, oxygen limiting, complete anoxia or aerobic conditions, AOB can reduce NO2- with hydrogen gas or pyruvate as possible electron donor to produce certain amounts of N2O and NO. The other pathway is hydroxylamine (NH2OH) oxidation, i.e., N2O is produced as by-product during incomplete oxidation of NH2OH to NO2- [29, 33, 34]. During the oxidation of NH2OH to NO2-, nitrosyl radical (NOH) or NO acts as intermediate, and N2O can be generated from both NOH decomposition and NO reduction [35]. Harper et al. discovered a novel abiotic N2O generation reaction between NH2OH and NO2- in activated sludge system (Eq. (3)), and its generation rate was 1-3 orders of magnitude greater than the biological generation rate. What is more, the existence of activated sludge strengthens the abiotic N2O production rate [36].

|
(3) |

|
Download:
|
| Fig. 1. N2O production pathways during PNA process. | |
N2O emission via abiotic pathway accounts for 1.1% of the total nitrogen loading in partial nitritation reactor [37], which is comparable with the N2O emission via biological pathways in anoxic condition recovery process during AOB cultivation [38].
N2O can be generated simultaneously by the pathway of NH2OH oxidation and AOB denitrification, which is verified by isotope labeling technique [39]. In the initial aeration phase of a lab-scale granular SBR partial nitritation for the treatment of 300[9T$DIF] 400 mg N L-1 synthetic wastewater, N2O generation by NH2OH oxidation accounts for 65% of the total N2O production, and in the latter phase N2O production via AOB denitrification is almost equivalent with that via NH2OH oxidation [39]. AOB denitrification is the dominant N2O production pathway during the partial nitritation process [32, 40, 41].
2.2. N2O production mechanisms in anammoxAnammox process accounts for a small part of N2O emission in PNA. The most likely N2O emission pathway in anammox reactor is heterotrophic denitrifiers denitrification occurred in the inner part of anammox granule (Fig. 1) [42]. Complete heterotrophic denitrification process contains four steps, i.e., NO3-→NO2-→NO→N2O→N2, and N2O discharge is caused by inappropriate DO, C:N ratio limitation, low pH, NO3- and NO2- concentration inhibition, etc. [43, 44].
It is reported that N2O emission in anammox process account for 0.10% ± 0.07% [42], 1.67% [45] and 0.46% [46] of nitrogen loading, and the predicted N2O production factor of mechanistic model range from 1.7% to 2.9% [47]. Ali et al. reported that 70% N2O emission occurred in the AOB-dominated aerobic surface zone of a one-stage PNA granular reactor while 30% occurred in the anammox bacteria-dominated anoxic zone, and NH2OH oxidation and AOB denitrification had almost the same contribution for N2O emission by AOB-related pathways [48]. In full-scale two-stage PNA reactor, N2O emission in anammox process is always negligible [49].
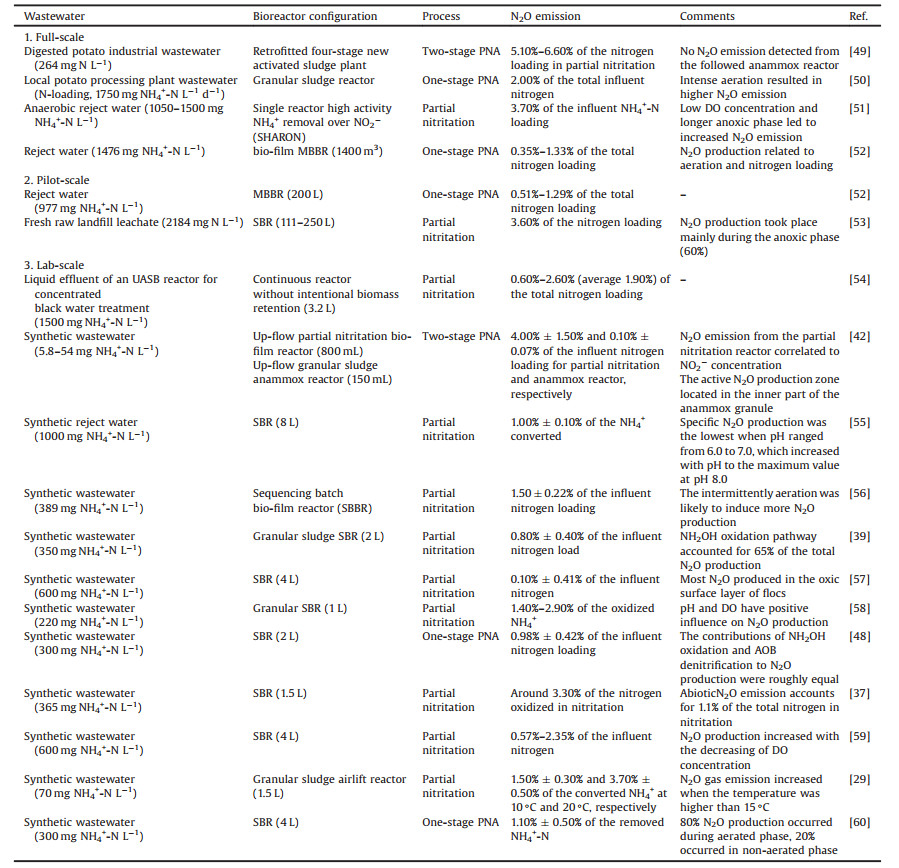
3. N2O emission comparisonN2O emission varies greatly for different scale partial nitritation and PNA processes (Table 1), which accounts for 0.35%-6.60% [49-52] of nitrogen loading for full-scale plants, 0.51%-3.60% [52, 53]for pilot-scale reactors and 0.08%-4.00% [54-60] for labscale reactors. The operational conditions, bioreactor configurations and processes are probably the key reasons for N2O emission variation, while the monitoring systems and quantitative methods also have influences on the results. Since N2O emission proportion of both nitrogen loading and converted/oxidized/removed NH4+ are frequently used in different studies, the N2O emission data listed in Table 1 are incomparable. Therefore, standardized monitoring and quantification methods are urgently needed for the comparison of N2O emission in different studies and the exploration of N2O generation mechanisms, and unified N2O emission evaluation method will benefit all of the studies. Up to now, most studies focus on lab-scale researches for synthetic wastewater treatment, and further studies should be carried out for pilot-scale and full-scale biological treatment of practical wastewater, thus to assess the contribution of N2O emission in PNA process to the GHG footprint.
|
|
Table 1 N2O emission data reported during partial nitritation and PNA process for different scales. |
4. Influencing factors 4.1. DO 4.1.1. DO concentration
N2O generation and emission in PNA are significantly influenced by DO concentration, e.g., N2O emission decreases from 2.35% 0.32% to 0.57% 0.08% of the influent nitrogen loading when DO increases from 0.35 mg/L to 0.85 mg/L in an autotrophic partial nitritation reactor for high-NH4+ (600 mg NH4+-N L-1) wastewater treatment [59]. N2O generation by NH2OH oxidation way is suppressed when the increasing DO inspires the nitrifying activity of complete conversion of NH2OH to NO2-, and the comparatively large N2O emission decrease indicates that NH2OH related way is an important pattern of N2O production [59]. Similar conclusions are obtained in a granular airlift nitritation reactor, in which N2O emission increases with DO decrease in the range of 1-4.5 mg O2 L-1 [61], and this phenomenon might be caused by the variation of N2O production pathway. N2O emission increases with DO increase (with maximum to 0.2 mg/L) in a one-stage PNA reactor, which is resulted from the enhanced nitrifier denitrification related to NO2- accumulation [62]. In autotrophic partial nitritation process, DO increase in the bulk (from 1.1 mg/L to 2.3 mg/L) stimulates N2O production [58] due to the reinforcement of NH3/NH4+ oxidation, NO2- accumulation and nitrifier denitrification in the reactor.
It is difficult to distinguish the influence of DO and NO2- concentration on N2O emission because DO always influences N2O emission via NO2- accumulation. N2O emission decreases prelim-inarily with DO increase as the N2O emission via NH2OH oxidation is suppressed. However, when NO2- accumulates to certain amount in the reactor, N2O emission increases with DO increase for the inducement of AOB denitrification by high NO2- concentration. The influences of NO2- accumulation on its oxidation and N2O emission under high DO conditions are not discussed in the researches mentioned above, and the influencing mechanisms of DO on N2O emission should be further investigated by advanced technologies.
4.1.2. Aerobic or anoxic conditionsN2O production during the aerobic or anoxic periods varies in different studies. Aerated zones in WWTPs have greater probability of N2O emission compared with non-aerated zones or anoxic conditions [12, 63]. In a full-scale one-step intermittent aeration PNA process, over 90% N2O emits from the aerated stage, and less than 8% emits form the non-aerated stage [52]. In a lab-scale one-stage intermittent aeration SBR PNA process with 300 mg NH4+-N L-1 influent, about 80% N2O emits from the aerated phase while 20% from the non-aerated phases [60]. Even though the aerobic phase is 4 times longer than the anoxic phase, the latter produces 60% of the N2O of partial nitritation SBR reactors for treatment of fresh landfill leachate. Higher rate of NO2- denitrification than N2O denitrification in anoxic phase is the main reason for high N2O accumulation [53]. Similar conclusion is obtained in a full-scale partial nitritation SBR, and 66% N2O is generated in the anoxic phase, which accounts for only 36% of the whole cycle time [51].
4.1.3. Aeration patternThe aeration pattern (the transition of aeration intensity and time) influences N2O emission strongly by impacting the pathway and rate of N2O formation and stripping during PNA process [50, 52, 60].
Intense aeration improves DO concentration and then increases N2O emission during the PNA processes, while DO decreases during mild aeration periods and then strengthens N2O production by heterotrophic denitrification. Since PNA processes have high susceptibility of DO concentration, both one-stage and two-stage processes are affected by aeration pattern. The N2O emission rate during intense aeration is higher than that in mild aeration period, which is mainly caused by the enhanced N2O stripping and the higher rate of NO2- accumulation [50]. Transient aeration patterns, i.e., improving the DO from low level to high level in a short time, have higher N2O emission rate than continuous aeration patterns in a full-scale granular PNA process [50]. Yu et al. demonstrated that the metabolism imbalance of nitrifying bacteria for recovery from transient anoxic period generates N2O during nitrification [32].
Frequent switch of anoxic-oxic conditions also produces much N2O by AOB. When the continuous NH3 feed system changes from strict anoxic to oxic condition, high NH3 oxidation rate causes the transient accumulation of NH2OH and then increases N2O production through NH2OH oxidation pathway [35]. Nevertheless, this conclusion is inferred only from the substrate and electron equilibrium theory, and the mechanism of N2O production increase by AOB in transient anoxic-oxic condition remains to be verified experimentally. However, since the heterotrophic denitrifying bacteria often exist in one-stage PNA reactor, the frequent switch of anoxic-oxic conditions suppresses heterotro-phic denitrifying bacteria activity and then decreases N2O generation through heterotrophic denitrification pathway [52]. The N2O generation trend is complicated during intermittent aeration. N2O concentration increases to a peak rapidly at the beginning of aerated phase, and gradually decreases to a transient minimum, then increases again as aeration continued. When the aeration stopped, N2O reduces to nearly the background concen-tration in a lab-scale intermittent aerated SBR [60]. The importance of N2O production through the pathway of triggering AOB or suppressing heterotrophic denitrifying bacteria in PNA with intermittent aeration should be further studied. The aeration intervals also influence N2O emission during PNA process. Prolonged aeration period enhances N2O generation, and short aeration time is recommended to reduce N2O emission [50, 64].
It seems that smooth and low frequency transition between different aeration patterns reduce N2O emission while sudden and frequent switch strengthen N2O emission in PNA reactors.
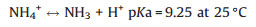
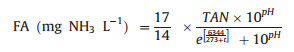
4.2. pHpH has been widely used as controlling factor for the improvement of nitrogen removal efficiency in PNA reactor, and its remarkable influence on N2O production is reported in different studies [40, 55, 58, 65]. The effect of pH on N2O production in PNA can be classified in two pathways, one is realized by direct influence on bacteria activity while the other is achieved indirectly influence on bacteria activity while the other is achieved indirectly by the influence of free ammonia (FA) and free nitrous acid (FNA) concentration (Eqs. (4) and (5)) [55].
|
(4) |

|
(5) |
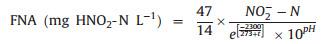
FA is reported as the true substrate used by AOB [66], which increases with the increase of pH and thus inhibits AOB activity [67]. FNA is the protonated species of NO2- depending on the accumulated NO2- and pH in BNR systems (Eq. (5)). The decrease of pH increases FNA concentration, which inhibits the activity of both AOB and NOB, and thus influences N2O production accordingly [68]. In addition, FNA is reported as the actual inhibitor of N2O reduction. 0.004 mg HNO2-N L-1 FNA can inhibit N2O reduction completely in denitrification using the denitrifyingenhanced biological phosphorus removal sludge [69].
The probable mechanism of FNA influence on N2O reduction is as follows: the two metal centers, i.e., CuA (a binuclear copper center) and CuZ (a tetranuclear copper-sulfide center), are contained by N2O reductase, and FNA inhibits N2O reduction by binding to the active sites of Cu-containing enzymes [70]. Similar conclusion is obtained in BNR sludge, and NO3- reduction is totally inhibited when FNA is greater than 0.2 mg HNO2-N L-1. NO2- reduction is also inhibited by FNA, but the inhibitory effect on NO2- reduction is weaker than that on NO3- reduction [71]. AOB activity decreases 50% when 0.42 - 1.72 mg HNO2-N L-1 FNA is applied in BNR system [70], and 50% AOB activity inhibition occurs in a partial nitritation reactor with 1.32 mg HNO2-N L-1 FNA [72]. As shown in Eqs. (6) and (7), FNA [73] and FA [74] are related with NO2- concentration, total NH3-nitrogen concentration, pH and temperature.
|
(6) |
|
(7) |
In PNA process, N2O is principally generated through AOB denitrification, NH2OH oxidation and denitrifiers denitrification. In high AOB enriched partial nitritation system fed with synthetic anaerobic digester liquor, the maximum N2O production occurs at pH 8.0 and the minimum production occurs in pH 6.0-7.0. When pH ranges from 6.0 to 8.5, positive linear relationship between N2O production rate and NH4+ oxidation rate is observed [55], which indicates that pH affect N2O production by direct influence on AOB activity. N2O production decreases in a partial nitritation SBR while pH decreases gradually from 8 to 6.5 [75]. Similarly, N2O production rates increase with pH increase after influent addition in two lab-scale nitritation SBRs, and the dominant N2O generation pathway is AOB denitrification during the whole nitritation process [40]. The exact mechanisms of pH influence on enzymes, N2O production pathways and relative bacteria are not revealed. However, opposite conclusion is obtained in a lab-scale partial nitritation SBR, in which N2O production decreases when pH increases from 7.5 to 8.5 during the aeration period of a single cycle, and AOB denitrification is the dominant N2O generation pathway at pH 7.0 and 7.5 while NH2OH oxidation becomes the dominant pathway at pH 8.0 and 8.5 [76]. The above-mentioned phenomenon indicates that lower pH is favorable for N2O production through AOB denitrification pathway. When pH increases from 7.5 to 8.0, the decrease of AOB denitrification N2O production is greater than the increase of NH2OH oxidation N2O production.
The indirect pH influence on N2O production through FNA pathway during PNA process is also studied. The highest N2O emission is obtained at pH 7.5 in the pH range of 7.0 to 8.5, and the FNA concentrations at pH 6.5 and 7.5 are high enough to inhibit N2O reductase completely according to equation (Eq. (6)). Furthermore, N2O emission via AOB denitrification decreases as pH increases from 6.5/7.5 to 8.5 in partial nitritation granules, which is resulted from the increase of N2O reduction activity caused by FNA decrease [58].
N2O emission in PNA is influenced by pH directly or indirectly. It seems that N2O generation via AOB denitrification decreases while that via NH2OH oxidation increases with the pH increase. The overall N2O production in PNA reactor depends on the proportion of the two reported pathways, NO2-/NH3 concentration and DO level. Up to date, most researches focus on the pH influence on N2O emission in PNA process, and the exact mechanisms of pH influence on enzymes, bacteria and pathways of N2O production as well as the optimum pH for minimum N2O emission need further investigation.
4.3. IC, alkalinity and IC/N ratioIC is competitively used by AOB, NOB and anammox bacteria, which are all autotrophic microorganisms, as the preferred assimilative carbon source in PNA system. Sufficient IC is required to guarantee high nitrogen removal efficiency. The popular IC, i.e., bicarbonate, is usually served as alkalinity to buffer pH in PNA process. Alkalinity is often consumed to neutralize pH during the partial nitritation stage, which leads to acid production, and contrary phenomenon happens in the anammox stage. Therefore, IC is a crucial factor for N2O generation in PNA process. Alkalinity (mostly contributed by IC) varies greatly for different wastewaters, which ranges from 1.5 mmol C L-1 to 3.5 mmol C L-1 for domestic wastewater and reaches 20 mmol C L-1 for high-strength leachate, septic sludge and digester supernatant [77]. Since alkalinity has close relation with IC concentration, it can also affect N2O production during PNA process.
Large number of studies focus on the effect of IC concentration on microbial activity and diversity. The responses of AOB, NOB and anammox bacteria to IC limitation are quite different in PNA. The bioactivities of AOB and anammox bacteria are suppressed by low IC or IC shortage while that of NOB is slightly affected even at 0.1 mmol C L-1 IC [27, [78], [79], [80]], and 250 mmol C L-1 influent IC is suggested as the optimal value for PNA process [27]. Researches demonstrate that NOB can utilize small amount of CO2, which is produced by heterotrophic biomass, to sustain their slow growth. Another explanation is that NOB can grow mixotrophically, i.e., they can grow in heterotrophic mode with limited IC [78, 79, 81, 82]. The increase of IC enhances the activity of AOB, NOB and anammox bacteria [83], but anammox bacteria limitation occurs at too high IC concentration in one-stage granular PNA reactor [48]. Sufficient IC is necessary in PNA to sustain bacterial activity and nitrogen removal efficiency, and sufficient IC is usually supplied to avoid negative effects in engineering applications [84].
Moreover, IC/N is another index for the evaluation of IC influence on bacteria activity and diversity in PNA reactor. 1.2 [85] and 1.5-2.0 C/N [80] are recommended for stable high-rate PNA in consideration of the low IC/N inhibition on AOB activity and high IC/N inhibition on anammox activity. The IC/N direct influence on N2O emission has not been studied.
Researches about the relationship of N2O emission and IC concentration are quite limited. Decrease of IC addition increases N2O emission in PNA process, and the N2O is supposed to be produced by AOB-related pathway [79]. The possible reason is that decreased IC suppress AOB activity and then strengthen N2O generation via NH2OH oxidation. N2O emission in anammox correlates positively with IC concentration within the range of 20-180 mg/L at fixed nitrogen loading rate, and 55-130 mg/L IC are optimal for relatively high nitrogen removal rate and low N2O emission [84]. N2O emission increases in both excessive and limited IC conditions [86]. Quite a few studies investigate the IC influence on N2O production-related microbial communities, but few focus on the effect of IC on N2O production pathway and its emission. More studies should be carried out to research the N2O production mechanism under different IC conditions in PNA system, thus to support practical applications.
4.4. TemperatureTwo-stage and one-stage PNA processes are usually operated at similar temperature ranges. In two-stage PNA processes, partial nitritation reactors are often operated at 30-35 ℃ [55, 56] due to the higher growth rate of AOB than NOB at this scope [87], and anammox reactors are successfully performed in a wider range of 30-37 ℃. In one-stage PNA system, the reactors are frequently operated at 29-37 ℃ to guarantee high nitrogen removal efficiency [48, 50, 60, 88]. Low temperatures as 16 ℃ [89], 15.3 ℃ [90] and 15 ℃ [91] are applied to PNA process to decrease energy consumption [92], and 15 ℃ is successfully applied in lab-scale one-stage PNA systems [88, 93], which implies the possibility of economical and effective application of PNA for low-temperature wastewater treatment in cold areas. However, the anammox growth rate decreases at 15 ℃ [94] or high temperature as 40 ℃, and the biomass starts to lyse at 45 ℃ [95].
Temperature influences N2O generation by affecting bacteria activity and N2O stripping rate. The increase of temperature enhances the AOB growth rate and the specific growth rate discrepancy between AOB and NOB, thus eliminates NOB gradually and further stimulates N2O production via AOB denitrification and NH2OH oxidation [96]. Besides, high temperature also enhances N2O stripping. Temperature also affects AOB activity through influencing FA and FNA. FA inhibition of AOB activity happens mainly at 25℃ while both FA and FNA inhibition occurs at 35 ℃ in partial nitritation SBR [97], which is resulted from the strong dependence of FA and FNA on temperature (Eqs. (6) and (7)).
In an enriched nitrifying granular sludge reactor with 37 ± 8 mg/L influent NH4+-N, which performs partial nitritation at 10-20 ℃, the highest N2O production is observed at 20 ℃, and 3.7% ± 0.5% NH4+-N is converted. Furthermore, it is speculated that high N2O generation rate and stripping ratio result in great N2O emission at high temperature [29], but the exact reason is still unclear. N2O is less soluble at 25 ℃ or higher temperatures, so its stripping from wastewater to gas phase is more intensive, which leads to N2O emission enhancement [29, 98].
4.5. NO2- concentrationNO2- concentration can influence N2O production amount (rate) and its main generation approach because it is involved in both partial nitritation and anammox processes. NO2- increase enhances N2O emission during nitritation process [30, 31, 99], but NO2- variation slightly influences N2O emission in anammox process [31]. In a lab-scale nitrification activated sludge reactor, N2O emissions are significantly enhanced by adding NO2- to 10 mg/L at different DO concentrations [21]. Similar trend is also observed in SBR with nitrification mixed culture, and N2O emission attains to 37.5% when NO2- increases to 15 mg N L-1 [100]. In another lab-scale nitrification activated sludge bioreactor, N2O production by AOB denitrification is enormously enhanced when NO2- is added to the NH4+-oxidizing system, and the N2O emission rate increases slightly with the increase of NO2-concentration [33]. Both intermittent (5-50 mg NO2--N L-1) and continuous (0-150 mg NO2--N L-1) NO2- addition obviously stimulate N2O generation during NH4+oxidation in a nitrification lab-scale reactor [30]. NO2- increase promotes AOB denitrification by stimulating nirK gene expression [101] and inhibiting N2O reductase activity [102], thus leads to higher N2O production via AOB denitrification pathway.
However, NO2- stimulating effect on N2O production only exists in specific NO2-range in AOB culture, and N2O production decreases when the NO2- of nitritation system is too high, which is resulted from the suppress of AOB denitrification by NO2-. In an AOB culture enriched SBR, NO2- stimulation on N2O production rate occurs when NO2- is below 50 mg N L-1, and AOB related N2O production rate decreases gradually when NO2- ranged from 50 mg N L-1 to 500 mg N L-1, which is about zero when NO2- is above 500 mg N L-1 [103].
NO2- concentration also influences the dominant N2O pathway. AOB denitrification is the dominant N2O production pathway under low DO, moderate NO2-, low NH3concentration conditions while NH2OH oxidation is dominant at high DO, low (e.g., under 11.5 mg N L-1) or high (e.g. exceeded 500 mg N L-1) NO2- and high NH3conditions [104]. Few studies focus on the NO2- influence on N2O emission in anammox process. No obvious N2O emission fluctuation is observed with the variation of NO2- in a full-scale anammox reactor [31].
Current studies mainly focus on the influence of NO2- on AOB-related N2O emission in mixed nitrifying culture. AOB-related N2O emission is also dominate in one-stage PNA and the partial nitritation reactor of two-stage PNA, and further studies are needed to investigate the influence of NO2- on N2O production in PNA systems.
5. N2O measurementN2O emission varies greatly for different PNA bioreactors and operating conditions. Apart from the inherent differences of bioreactors and operation conditions, the sampling, measuring and analytical methods also play important roles in the high disparity of N2O emissions, and thus influence the investigation of N2O generation and its transfer mechanisms.
5.1. Sampling methodsFor off-line analysis, gas or liquid samples are needed for analysis. In lab-scale bio-reactors, the gas-phase samples are usually grasped by gas sampling bag, which is equipped with turning screw open/close valve at specific time of cycle operation and located at the upper part of the bioreactor. The accurate volume is measured using inverted cylinder filled tap water at pH 3 [84]. Then, the gas samples are injected into evacuated glass serum vials which are sealed with rubber stopper and aluminum cap for sample preservation [48]. In full-scale WWTPs, closed chambers are commonly used to measure the gas fluxes from water surface. The dissolved N2O strip from the liquid phase to gas phase during aeration, and the gas is blown into the chamber headspace for sampling in non-aerated stages. The samples are obtained from the headspace manually or automatically at specific intervals [17]. The sampling chamber is placed over the water surface to collect and then analyze N2O change for a period of time [105]. For off-line liquid phase N2O analysis, samples are collected directly from the bioreactor. Then the dissolved N2O will be extracted by headspace equilibration technique through heating the samples at constant temperature and shaking them to reach partition equilibrium quickly. The concept of equilibrium solubilities implies that there is a partition equilibrium between gas-phase and liquid-phase N2O at constant temperature equilibrium state. Therefore, the headspace equilibration technique can be used to calculate the dissolved N2O from the equilibrated concentration in the headspace gas-phase N2O [106]. The headspace equilibration technique is simple, reliable and can be applied to determine various GHGs [107]. However, the diverging ratios of carrier gas:water (v/v) and shaking time affect the equilibration efficiencies for different samples [107]. N2O in sludge granules can't be captured and measured off-line.
On-line N2O gas analysis is usually realized by computer-controlled sampling systems [31]. The off gas is continuously sampled from the reactor headspace and injected to on-line analyzer via gas tube [29], and filter is applied to prevent moisture from entering the on-line analyzer. To avoid overpressure in the analysis system, a T-shape joint is equipped on the pipeline connecting the gas outlet of the reactor and the gas analyzer to release the excessive gas. During the whole analysis process, the gas flow rate of the analyzer sampling pump is lower than the total gas flow rate in the reactor [34, 108].
5.2. Analytical techniques 5.2.1. Gas-phase N2OFor off-line N2O measurement, the samples are usually injected into gas chromatograph (GC) equipped with electron-capture detector (ECD), and argon or nitrogen gas is often applied as carrier gas for their enhancement of ECD response to N2O [109]. GC method is firstly used for N2O emission analysis of a full-scale wastewater treatment plant in 1995 [110]. GC is less expensive than other analytical methods, and its results can be easily compared with the large amount of previous research data obtained by GC technique. Moreover, isotopomer ratios of N2O in the samples can be measured by gas chromatograph isotope ratio monitoring mass spectrometry (GC-IRMS) if N2O is labeled by isotope tracer method [33, 48]. However, N2O analysis by GC takes relatively long time, i.e., 4-6 min per sample [105], which impedes its application in on-line measuring. Off-line sampling and analysis systems can only capture gas samples at specific time intervals, which can not reveal the real-time changes of N2O concentration and generation.
On-line monitoring can achieve real-time capture and analysis of N2O in gas-phase, thus increase the accuracy of N2O emission analysis. The most widely used on-line sensors are infrared analyzers due to their wide N2O measurement range up to 2000 ppm [17], low detection limit as less than 1.0 ppm [21] and short data logging time varied from 15 s to 1 min for different apparatus [62]. Less calibration requirements is another advantage of the infrared analyzers compared with GC methods. Fourier-transform infrared (FTIR) spectroscopy is the most frequently used analytical instrument for continuously gaseous N2O flux analysis, which can measure multiple components, reanalyze spectra, detect isotopomers with the same molecular massdirectly, and has lower calibration requirements. However, FTIR also has the disadvantages of high cost and complicated data analysis. Laser absorption spectroscopy is a rapid and sensitive analytical technique. It can hardly be interfered by other trace gases, but requires cryogenic cooling and allows only a single species or pair measurement per laser [105]. Other on-line sensors include chemiluminescence and mass spectrometry, and chemiluminescence is the higher sensitive one with detection limit of parts per trillion [17].
Some new methods have been developed to measure gaseous N2O. Since SnO2 reacts with N2O [111], the prototype sensors with modified-SnO2 surfaces are employed for N2O detection in air, whose detection scope ranges from 10 to 300 ppm at 500 ℃ [105]. Traditional dissolved N2O Clark-Type sensor is used for on-line assessment of gaseous N2O emission in full-scale WWTPs (Fig. 2). N2O Clark-type sensor is a reliable alternative to conventional methods when N2O concentration is above 500 ppm, which is more accurate than commercial N2O on-line analyzer [112].

|
Download:
|
| Fig. 2. (A) Full-scale N2O gas sensor and controller box; (B) Full-scale dissolved N2O sensor and controller box; (C) Close-up of gas sensor placed in the sampling hood; (D) Sampling hood placed in full-scale activated sludge SBR. Copied with permission [112]. Copyright 2019, Elsevier. | |
Both gaseous and liquid phase N2O can be measured by micro-sensors [113]. Various micro-sensors are used to detect GHGs including electrochemical sensors, resistive semi-conductor sensors and non-dispersive infrared sensors. Electrochemical gas sensors, which use the current generated by the reaction between gas and electrode materials to determine the gas concentration, have the characteristics of low power consumption, high measurement accuracy and strong anti-interference [114]. Because the resistance value of semiconductor device will change when the gas contacts with it, the gas concentration can be measured by resistive semi-conductor sensors. Non-dispersive infrared sensors determine the gas concentrations according to the near-infrared spectroscopy selective absorption characteristics and the relationship between gas concentration and absorption intensity (Lambert-Beer law). A N2O measurement system is conducted based on electrochemical gas sensors with gold working electrode and silver quasi reference electrode, and the N2O detection limit is 0.07% (v/v) [115]. N2O can also be measured by photoacoustic spectroscopy with excellent repeatability and accuracy, and these methods can be used for N2O detection in various substances as gas, liquid and solid phases [116]. Nanotubes have the advantages of high surface, high sensitivity and quick response, and their application for gas adsorption become an attractive subject. N2O can be weakly adsorbed on pristine magnesium oxide nanotubes, which is beneficial to N2O micro-sensor production [117]. Samadizadeh et al. replaced a boron atom of boron nitride sheet with an aluminum atom, and the constructed "two-dimensional" materials presented higher van der Waals forcesreactivity with N2O molecule than boron nitride sheet, which can be used to detect N2O [118].
Seven atmospheric N2O analytical instruments as GC instrument (Agilent), FTIR spectrometer (Ecotech), cavity ring-down spectrometer/quantum cascade laser (CRDS-QCL), G5101-I instrument (Picarro), IRIS 4600 (Thermo Fisher Scientific), OA-ICOS-QCL instrument (Los Gatos Research) and QCL Mini Monitor (Aerodyne) are compared in seven aspects, i.e., continuous measurement repeatability and drift, short-term repeatability (STR), long-term repeatability, linearity, stabilization time, temperature dependence and water vapor correction [119], which shows that new techniques demand less maintenance and lower operational cost than traditional GC method for the elimination of unnecessary consumables as carrier gas, and these new techniques have the potential to replace GC methods.
5.2.2. Liquid-phase N2OFor off-line liquid-phase N2O assessment, GC analysis has been widely used both in lab-scale reactors and full-scale plants. Dissolved N2O cannot be measured directly by GC instrument, and it must be calculated according to headspace equilibration technique mentioned in Section 5.1 based on the equilibrated concentration of N2O gas.
On-line dissolved N2O measurement can be achieved by N2O micro-sensors. N2O-R Clark-type micro-sensor (UNISENSE A/S, Århus, Denmark) is used for liquid N2O analysis of a nitrifier-denitrification system, and the device linked to the micro-sensor records data every 30 s [40]. N2O micro-sensor with wide range is applied to the measurement of liquid N2O concentration continuously in partial nitritation reactors with high nitrogen loading [53].
However, traditional GC analysis and Clark type electrode methods also have disadvantages. It is reported that on-site sampling method with GC analysis can't be used for on-line N2O measurement due to its complicated operation. On-line micro-sensor measurement needs relatively strict operational process, which is mainly caused by the delicate, easily contaminated electrode and its short service time (generally 4-6 months). Based on gas stripping method, the on-line monitoring device is integrated by a gas stripping flask, a scum trap flask and an Emerson MLT4 Rosemount FTIR analyzer [120]. When the continuous liquid sample stream enters the stripping flask at certain rate, the N2O generated from sample can be carried out by the constant-flow nitrogen stripping gas to the Emerson MLT4 Rosemount FTIR analyzer, and the entrained scum in the liquid flow of stripping flask is collected by the scum trap flask (Fig. 3). Liquid-phase N2O can be measured by this method, and its variation can be observed accurately.

|
Download:
|
| Fig. 3. Novel method for on-line monitoring of dissolved N2O by gas stripping device. Copied with permission [120]. Copyright 2019, Taylor & Francis Group. | |
5.2.3. N2O in sludge granules
Micro-electrode is a kind of electrode with micro or nanoscale size, which has the advantages of fast response, high signal/noise ratio, strong spatial resolution and small impact on samples due to its tiny size [121]. Micro-electrode can be used to determine fast or transient electrochemical reactions, high resistance system and rapid displacement rate constants, thus to achieve on-line in situ N2O monitoring in sludge granules and bio-film [122]. N2O spatial distribution in sludge granules or bio-film of PNA reactors are generally measured by micro-electrodes. Combined with fluorescence in situ hybridization (FISH) results, the micro-profiles detected by micro-electrode can be used to investigate and explain the N2O generation, migration and transformation. However, only qualitative mechanism of N2O emission can be obtained by the methods mentioned above, and more techniques as isotopomer analysis are needed to research the exact mechanisms.
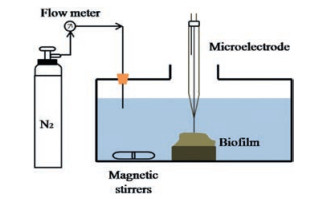
For micro-electrode measurement, 2-3 mm sludge granules are sampled and positioned by 3-5 insect needles in a flow chamber (2-4 L), which is filled with synthetic medium for the pre-incubation and profile-stabilization of the granules. The medium used for pre-incubation is consistent with the reactor influent, and the DO of which is kept at certain value by continuous bubbling with N2 gas (99.9%) and/or atmospheric air, and the bubbling provides sufficient mixing at the same time. The sludge granule acclimation time usually lasts for 1-3 h, and the N2O profile is measured only once for a granule to prevent bacteria activity deterioration. Based on the average steady-state N2O concentration profiles, Fick's second law of diffusion is used to estimate the net N2O volumetric production rates in the granules [39, 42, 48].
Micro-electrode is applied to measure the steady-state N2O production of the granules in a single partial nitritation reactor, and the results illustrate that net N2O production rate in oxic layer (within 300 μm) is higher than that of other layers [39]. Similar conclusion is obtained in a partial nitritation reactor by micro-electrode, which shows that N2O generation mainly occur in oxic layer (upper 200 μm) and increase with bulk DO [58]. N2O distribution in anammox granules is analyzed by the same micro-electrode method, and the inner part of the granule is identified as the active N2O production zone in a lab-scale two-stage PNA [42]. The steady-state N2O concentration profiles in sludge granules of one-stage PNA reactor can be also measured by micro-electrode, and the calculated net volumetric N2O production rates suggest that about 70% of the total N2O generation occur in oxic zone [48]. In the bio-film of a PNA nitrogen removal system, the N2O concentrations measured by micro-electrode (Fig. 4) are all under 40 mmol/L and 1-2 orders of magnitude less than NH4+ and NO2- concentrations, which indicates that only a small fraction of nitrogen is transformed to N2O [122].

|
Download:
|
| Fig. 4. Schematic of the batch test system for the measurement of bio-film N2O. Copied with permission [122]. Copyright 2019, Elsevier. | |
6. N2O emission related microbial community 6.1. In partial nitritation process
The existence of AOB and NOB in partial nitritation granules can be detected by FISH [123], real-time quantitative polymerase chain reaction detecting system (QPCR), denaturing gradient gel electrophoresis (DGGE) and other combined molecular biological analysis methods. Since low DO and high NO2- concentration favor AOB growth and suppress NOB activity, NOB are much less than AOB in partial nitritation granules (Fig. 5) [55]. Besides, high temperature and controlled aeration can also wash out NOB as the genera of Arcobacter and Nitrospira from the bio-film [56]. The phyla of Sphingobacteria, Flavobacteria, Bacteroidetes and Proteobacteria (including the classes of Alphaproteobacteria, Betaproteobacteria and Gammaproteobacteria) have been detected in partial nitritation granules. Furthermore, the classes of Alphaproteobacteria and Betaproteobacteria can denitrify N2O to N2 using endogenous organic matter and the influent easy-biodegradable COD during anoxic periods, and the phylum Bacteroidetes can oxidize the remaining biodegradable COD during aerobic phases [53]. In partial nitritation reactors, the order Nitrosomonadales of AOB, which accounts for 62.1% ± 5.6% [58] or 67.0% ± 7.0% [55] of the total microorganisms, is the most abundant bacteria and the dominant N2O production group [58]. Moreover, the unconventional phylum Acidobacteria, the orders of Burkholderiales, Rhodocyclales and Cytophagales, the family Hyphomicrobiaceae, the genera of Nitrosospira and Nitrosococcus are also found in partial nitritation bio-film reactor [56]. The genus Nitrotoga is observed in partial nitritation at low temperature, whose population is enhanced in wastewater treatment systems [124], and 10 ℃ is the optimal temperature for its growth [125]. The spatial distribution of microbial community can be explored by micro-sensormeasurements combined with FISH, QPCR and other molecular biological techniques. AOB are primarily detected in the oxic surface layer of partial nitritation granules [39, 58, 126].

|
Download:
|
| Fig. 5. Fluorescence in situ hybridization (FISH) images during the partial nitritation-SBR operation. Semi-quantification was based on a minimum of n = 30. Copied with permission [123]. Copyright 2019, Elsevier. | |
6.2. In anammox granules
Except anammox bacteria, AOB and uncultured microorganisms are also observed in granules of different anammox systems. The anammox bacteria distribute throughout the anammox granules, which account for over 90% of the total bacteria in anammox reactor, and Candidatus Brocadia anammoxidans and Candidatus Kuenenia stuttgartiensis are the dominant species. What is more, AOB are detected in the anammox granule surface and around anammox bacteria clusters with the main genera of Nitrosomonas europaea, Nitrosomonas halophila and Nitrosomonas eutropha[42]. The phyla of Planctomycetes, Chloroflexi and Chlorobi and uncultured microorganisms are also found in anammox reactor [84]. The genus Denitratisoma and the heterotrophic denitrifying bacteria in the deep layer of anammox granules, which do not belong to AOB, NOB and anammox bacteria, are reported as N2O generation bacteria [42, 84].
6.3. In one-stage PNA processAOB, NOB, anammox bacteria and other heterotrophic communities can be detected in one-stage PNA reactor. Anammox bacteria are the main fraction of the biomass, and AOB account for less while NOB even less in PNA reactor. In a one-stage PNA granular reactor for synthetic wastewater treatment, the 16S r-RNA gene amplicon deep sequencing illustrates that anammox bacteria, AOB and NOB account for 12.5% ± 0.6%, 5.0% ± 0.4% and 12.1% ± 0.3% of the total bacteria [48]. The microbial communities of an intermittently aerated PNA reactor are analyzed by QPCR, and the anammox bacteria, AOB, NOB and other bacteria account for about 30%, 18%, 0.2% and 52% of the total bacteria, respectively [60]. The dominant groups of anammox bacteria, AOB and NOB are the species Candidatus Brocadia, the order Nitrosomonadales, the genera of Nitrotoga, Nitrospira and Nitrobacter accordingly in one-stage PNA reactors [48, 127]. Besides, heterotrophic bacterial communities also exist in one-stage PNA reactor [127].
Moreover, the obvious stratified distribution of AOB, NOB and anammox bacteria in the PNA granules is observed by FISH. AOB is detected in the granular surface layer and NOB is detected under AOB layer, both of AOB and NOB layers are quite thin. Anammox bacteria mainly exist inside of the PNA granule [48]. The bacteria stratified distribution in one-stage PNA is almost consistent with that in respective partial nitritation and anammox reactor [58, 126].
7. ConclusionsAs an important GHG, N2O has great global warming potential as well as biological toxic impact, and its content in the atmosphere increases continuously in recent years. PNA process emits higher N2O than traditional nitrogen removal process. During PNA process, N2O production mainly occurs in three different pathways, i.e., the AOB denitrification, NH2OH oxidation and the heterotrophic denitrifiers denitrification.
N2O emission varies greatly in different scale partial nitritation/PNA processes, which accounts for 0.35%-6.60% of nitrogen loading in full-scale plants, 0.51%-3.60% in pilot-scale reactors and 0.08%-4.00% in lab-scale reactors. The operational conditions, bioreactor configurations and processes are probably the key reasons for the significant variation of N2O emissions, while the monitoring systems and quantitative methods also influence the results.
N2O emission and dominant generation pathway in PNA are influenced by various factors as DO, pH, IC/N, temperature and NO2- concentration. Under the common operational parameter scopes of PNA, N2O emission via NH2OH oxidation dominates at relative low DO, low IC, high pH or low NO2- concentration, while N2O emission via AOB denitrification dominates at relative high DO, high IC, low pH or high NO2- concentration. Besides, the increase of temperature always enhances N2O production via AOB denitrification and N2O stripping. The influencing mechanisms of these factors on N2O production pathways and their optimal control range are rarely studied.
GC and GC-IRMS are popular methods for off-line N2O measurement. The N2O on-line sensors include infrared analyzers, chemiluminescence, mass spectrometry, laser absorption spectroscopy, micro-sensor, etc. Liquid phase N2O is usually measured by GC and micro-sensor, and the latter is often used to explore N2O concentration and its spatial distribution in sludge granules or bio-films in PNA reactor. However, disadvantages of these methods impact their popularization and application, and the measuring methods should be improved urgently.
AOB are highly enriched while NOB are rarely found in partial nitritation process, and the order Nitrosomonadales of AOB is the dominant group and N2O producer. Anammox bacteria, AOB and certain amount of heterotrophic denitrifying bacteria are observed in anammox process, and Candidatus Brocadia anammoxidans and Candidatus Kuenenia stuttgartiensis are the dominant anammox bacteria species. The genus Denitratisoma and the heterotrophic denitrifying bacteria in the deep layer of anammox granules are the dominant N2O generation bacteria.
The microbial diversity, community and N2O producers in one-stage PNA reactors are similar with those in two-stage PNA reactors. In one-stage PNA reactors, anammox bacteria account for a large fraction of the biomass, AOB account for a small portion, and NOB account for even less. The dominant anammox bacteria, AOB and NOB in one-stage PNA are the species Candidatus Brocadia, the genera of Nitrotoga, Nitrospira and Nitrobacter, and the genus Nitrosomonas, respectively. AOB are detected in the granule surface, while NOB are observed under the AOB layer and anammox bacteria are inside the granule.
Further studies should be carried out to illustrate the accurate N2O production pathway, and then optimize the key operational factors to reduce N2O emission in PNA. More attention should be paid to the relations between N2O emission pathways and microbial communities.
AcknowledgmentsThis work was supported by the National Major Science and Technology Program for Water Pollution Control and Treatment (Nos. 2017ZX07401003-05-01, 2014ZX07216-001) and China Scholarship Council Foundation (No. 2011911098).
| [1] |
IPCC, Climate Change 2014 Synthesis Report, Topic 3: Future Pathways for Adaptation, Mitigation and Sustainable Development, (2014). https://www.ipcc.ch/site/assets/uploads/2018/05/SYR_AR5_FINAL_full_wcover.pdf.
|
| [2] |
IPCC, Climate Change 2014 United Kingdom and New York, 2014.
|
| [3] |
IPCC, Climate Change 2013 Cambridge, United Kingdom and New York, 2013.
|
| [4] |
A.R. Ravishankara, J.S. Daniel, R.W. Portmann, Science 326 (2009) 123-125. DOI:10.1126/science.1176985 |
| [5] |
N. Adouani, T. Lendormi, L. Limousy, O. Sire, Resour. Conserv. Recycl. 54 (2010) 299-302. DOI:10.1016/j.resconrec.2009.07.011 |
| [6] |
R.W. Portmann, J.S. Daniel, A.R. Ravishankara, Philos. Trans. R. Soc. Lond. B: Biol. Sci. 367 (2012) 1256-1264. DOI:10.1098/rstb.2011.0377 |
| [7] |
P.J. Crutzen, Atmospheric chemical processes of the oxides of nitrogen including nitrous oxide, in: C.C. Delwiche (Ed.), Denitrification, Nitrification and Atmospheric N2O, Wiley, Chichester, 1981, pp. 17-44.
|
| [8] |
J. Weimann, Best Pract. Res. Clin. Anaes. 17 (2003) 47-61. DOI:10.1053/bean.2002.0264 |
| [9] |
A.F. Bouwman, Soils and the Greenhouse Effect, Wiley, Chichester, 1990.
|
| [10] |
IPCC, Climate Change 2001: Impacts, Adaptation and Vulnerability, (2001). https://www.ipcc.ch/site/assets/uploads/2018/03/WGII_TAR_full_report-2.pdf.
|
| [11] |
M.J. Kampschreur, H. Temmink, R. Kleerebezem, et al., Water Res. 43 (2009) 4093-4103. DOI:10.1016/j.watres.2009.03.001 |
| [12] |
J.H. Ahn, S. Kim, H. Park, et al., Environ. Sci. Technol. 44 (2010) 4505-4511. DOI:10.1021/es903845y |
| [13] |
J. Foley, D.D. Haas, Z.G. Yuan, et al., Water Res. 44 (2010) 831-844. DOI:10.1016/j.watres.2009.10.033 |
| [14] |
L. Ye, B.J. Ni, Y. Law, et al., Water Res. 48 (2014) 257-268. DOI:10.1016/j.watres.2013.09.037 |
| [15] |
A. Mosier, C. Kroeze, C. Nevison, et al., Environ. Sci. Policy 2 (1999) 325-333. DOI:10.1016/S1462-9011(99)00022-2 |
| [16] |
E.A. Scheehle, D. Kruger, Energy J. 27 (2006) 33-44. DOI:10.2307/23297074 |
| [17] |
Y. Law, L. Ye, Y. Pan, et al., Philos. Trans. R. Soc. Lond. B: Biol. Sci. 367 (2012) 1265-1277. DOI:10.1098/rstb.2011.0317 |
| [18] |
M.R. Daelman, B.B. De, M.C. van Loosdrecht, et al., Water Res. 47 (2013) 3120-3130. DOI:10.1016/j.watres.2013.03.016 |
| [19] |
M.R. Daelman, E.M. van Voorthuizen, L.G. van Dongen, Water Sci. Technol. 67 (2013) 2350-2355. DOI:10.2166/wst.2013.109 |
| [20] |
G. Tallec, J. Garnier, G. Billen, et al., Bioresour. Technol. 99 (2008) 2200-2209. DOI:10.1016/j.biortech.2007.05.025 |
| [21] |
G. Tallec, J. Garnier, G. Billen, et al., Water Res. 40 (2006) 2972-2980. DOI:10.1016/j.watres.2006.05.037 |
| [22] |
USEPA, Inventory of U.S. Greenhouse Gas Emissions and Sinks: 1990-2010 Washington, (2012).
|
| [23] |
L.J. Brandes, P.G. Ruyssenaars, H.H.J. Vreuls, et al., Greenhouse Gas Emissions in the Netherlands 1990-2005, National Inventory Report, (2007). https://www.pbl.nl/sites/default/files/cms/publicaties/500080006.pdf.
|
| [24] |
Y. Law, B.J. Ni, P. Lant, et al., Water Res. 46 (2012) 3409-3419. DOI:10.1016/j.watres.2012.03.043 |
| [25] |
S.W.H.V. Hulle, H.J.P. Vandeweyer, B.D. Meesschaert, et al., Chem. Eng. J. 162 (2010) 1-20. DOI:10.1016/j.cej.2010.05.037 |
| [26] |
X. Zhu, Y. Chen, Environ. Sci. Technol. 45 (2011) 2137-2143. DOI:10.1021/es102900h |
| [27] |
Y.P. Chen, S. Li, F. Fang, et al., Environ. Technol. 33 (2012) 2611-2617. DOI:10.1080/09593330.2012.672474 |
| [28] |
C. Reino, V.L. Mcm, J. Carrera, J. Pérez, Chemosphere 185 (2017) 336-343. DOI:10.1016/j.chemosphere.2017.07.017 |
| [29] |
B. Kartal, J.G. Kuenen, M.C.M.V. Loosdrecht, Science 328 (2010) 702-703. DOI:10.1126/science.1185941 |
| [30] |
C.M. Castro-Barros, A. Rodríguez-Caballero, E.I.P. Volcke, et al., Chem. Eng. J. 287 (2016) 269-276. DOI:10.1016/j.cej.2015.10.121 |
| [31] |
M.J. Kampschreur, V.D.S. Wr, H.A. Wielders, et al., Water Res. 42 (2008) 812-826. DOI:10.1016/j.watres.2007.08.022 |
| [32] |
R. Yu, M.J. Kampschreur, M.C.M.V. Loosdrecht, et al., Environ. Sci. Technol. 44 (2010) 1313-1319. DOI:10.1021/es902794a |
| [33] |
S.W. Kim, M. Miyahara, S. Fushinobu, et al., Bioresour. Technol. 101 (2010) 3958-3963. DOI:10.1016/j.biortech.2010.01.030 |
| [34] |
L. Peng, B.J. Ni, L. Ye, et al., Water Res. 73 (2015) 29-36. DOI:10.1016/j.watres.2015.01.021 |
| [35] |
K. Chandran, L.Y. Stein, M.G. Klotz, et al., Biochem. Soc. Trans. 39 (2011) 1832-1837. DOI:10.1042/BST20110717 |
| [36] |
W.F. Harper, Y. Takeuchi, S. Riya, et al., Chem. Eng. J. 281 (2015) 1017-1023. DOI:10.1016/j.cej.2015.06.109 |
| [37] |
A. Soler-Jofra, B. Stevens, M. Hoekstra, et al., Chem. Eng. J. 287 (2016) 720-726. DOI:10.1016/j.cej.2015.11.073 |
| [38] |
A. Soler-Jofra, C. Picioreanu, R. Yu, K. Chandran, et al., Chem. Eng. J. 335 (2017) 756-762. |
| [39] |
R.M. Rathnayake, Y. Song, A. Tumendelger, et al., Water Res. 47 (2013) 7078-7086. DOI:10.1016/j.watres.2013.07.055 |
| [40] |
Q. Su, C. Ma, C. Domingo-Félez, et al., Water Res. 123 (2017) 429-438. DOI:10.1016/j.watres.2017.06.067 |
| [41] |
P. Wunderlin, M.F. Lehmann, H. Siegrist, et al., Environ. Sci. Technol. 47 (2013) 1339-1348. DOI:10.1021/es303174x |
| [42] |
S. Okabe, M. Oshiki, Y. Takahashi, et al., Water Res. 45 (2011) 6461-6470. DOI:10.1016/j.watres.2011.09.040 |
| [43] |
H.J. Lu, K. Chandran, Biotechnol. Bioeng. 106 (2010) 390-398. DOI:10.1002/bit.22704 |
| [44] |
N. Wrage, G.L. Velthof, M.L.V. Beusichem, et al., Soil Biol. Biochem. 33 (2001) 1723-1732. DOI:10.1016/S0038-0717(01)00096-7 |
| [45] |
Y. Jin, D.Q. Wang, W.J. Zhang, SpringerPlus 5 (2016) 741. DOI:10.1186/s40064-016-2392-1 |
| [46] |
M. Jia, C.M. Castro-Barros, M. Winkler, et al., Environ. Sci.-Wat. Res. Technol. 4 (2018) 1035-1046. DOI:10.1039/C8EW00125A |
| [47] |
X. Lu, T D.S.P., H.E. Al-Hazmi, J. Majtacz, et al., Environ. Sci. Technol. 52 (2018) 2800-2809. DOI:10.1021/acs.est.7b05611 |
| [48] |
M. Ali, R.M. Rathnayake, L. Zhang, et al., Water Res. 102 (2016) 147-157. DOI:10.1016/j.watres.2016.06.034 |
| [49] |
J. Desloover, H.D. Clippeleir, P. Boeckx, et al., Water Res. 45 (2011) 2811-2821. DOI:10.1016/j.watres.2011.02.028 |
| [50] |
C.M. Castro-Barros, M.R. Daelman, K.E. Mampaey, et al., Water Res. 68 (2015) 793-803. DOI:10.1016/j.watres.2014.10.056 |
| [51] |
K.E. Mampaey, M.K. De Kreuk, U.G. van Dongen, et al., Water Res. 88 (2016) 575-585. DOI:10.1016/j.watres.2015.10.047 |
| [52] |
J. Yang, J. Trela, E. Plaza, Water Sci. Technol. 74 (2016) 2870-2878. DOI:10.2166/wst.2016.454 |
| [53] |
J. Gabarró, P. González-Cárcamo, M. Ruscalleda, et al., Bioresour. Technol. 163 (2014) 92-99. DOI:10.1016/j.biortech.2014.04.019 |
| [54] |
M.S. de Graaff, G. Zeeman, H. Temmink, et al., Water Res. 44 (2010) 2171-2178. DOI:10.1016/j.watres.2009.12.039 |
| [55] |
Y. Law, P. Lant, Z. Yuan, Water Res. 45 (2011) 5934-5944. DOI:10.1016/j.watres.2011.08.055 |
| [56] |
Q. Kong, J. Zhang, M. Miao, et al., Chem. Eng. J. 217 (2013) 435-441. DOI:10.1016/j.cej.2012.10.093 |
| [57] |
K. Ju, L. Wang, Y. Lv, et al., J. Biosci. Bioeng. 120 (2015) 419-425. DOI:10.1016/j.jbiosc.2015.02.005 |
| [58] |
R.M. Rathnayake, M. Oshiki, S. Ishii, et al., Bioresour. Technol. 197 (2015) 15-22. DOI:10.1016/j.biortech.2015.08.054 |
| [59] |
Y. Lv, K. Ju, T. Sun, et al., Int. Biodeterior. Biodegrad. 114 (2016) 209-215. DOI:10.1016/j.ibiod.2016.01.022 |
| [60] |
J.M. Blum, M.M. Jensen, B.F. Smets, Chem. Eng. J. 335 (2018) 458-466. DOI:10.1016/j.cej.2017.10.146 |
| [61] |
M. Pijuan, J. Torã, A. RodrãGuez-Caballero, et al., Water Res. 49 (2014) 23-33. DOI:10.1016/j.watres.2013.11.009 |
| [62] |
E. Harris, A. Joss, L. Emmenegger, et al., Water Res. 83 (2015) 258-270. DOI:10.1016/j.watres.2015.06.040 |
| [63] |
J.H. Ahn, S.P. Kim, H.K. Park, et al., Water Environ. Res. 82 (2010) 2362-2372. DOI:10.2175/106143010X12681059116897 |
| [64] |
C. Domingo-Félez, A.G. Mutlu, M.M. Jensen, et al., Environ. Sci. Technol. 48 (2014) 8679-8687. DOI:10.1021/es501819n |
| [65] |
Y. Pan, L. Ye, B.J. Ni, et al., Water Res. 47 (2013) 8408-8415. DOI:10.1093/toxsci/kft083 |
| [66] |
I. Suzuki, U. Dular, S.C. Kwok, J. Bacteriol. 120 (1974) 556-558. DOI:10.1128/JB.120.1.556-558.1974 |
| [67] |
V.M. Vadivelu, J. Keller, Z. Yuan, Water Res. 41 (2007) 826-834. DOI:10.1016/j.watres.2006.11.030 |
| [68] |
V.M. Vadivelu, Z. Yuan, C. Fux, et al., Environ. Sci. Technol. 40 (2006) 4442-4448. DOI:10.1021/es051694k |
| [69] |
Y. Zhou, M. Pijuan, R.J. Zeng, et al., Environ. Sci. Technol. 42 (2008) 8260-8265. DOI:10.1021/es800650j |
| [70] |
Y. Zhou, A. Oehmen, M. Lim, et al., Water Res. 45 (2011) 4672-4682. DOI:10.1016/j.watres.2011.06.025 |
| [71] |
J. Ma, Q. Yang, S. Wang, et al., Hazard. Mater. 175 (2010) 518-523. DOI:10.1016/j.jhazmat.2009.10.036 |
| [72] |
J. Claros, E. Jiménez, D. Aguado, et al., Water Sci. Technol. 67 (2013) 2587-2594. DOI:10.2166/wst.2013.132 |
| [73] |
S. Qiao, Y. Kawakubo, T. Koyama, et al., J. Biosci. Bioeng. 106 (2008) 433-441. DOI:10.1263/jbb.106.433 |
| [74] |
T. Yamamoto, K. Takaki, T. Koyama, et al., Bioresour. Technol. 99 (2008) 6419-6425. DOI:10.1016/j.biortech.2007.11.052 |
| [75] |
A. Ribera-Guardia, M. Pijuan, Chem. Eng. J. 321 (2017) 358-365. DOI:10.1016/j.cej.2017.03.122 |
| [76] |
Y. Lv, K. Ju, L. Wang, et al., Process Biochem. 51 (2016) 765-771. DOI:10.1016/j.procbio.2016.02.017 |
| [77] |
M. Henze, Prog. Col. Polym. Sci. 49 (2002) 747-752. DOI:10.2166/wst.2002.0500 |
| [78] |
A. Guisasola, S. Petzet, J.A. Baeza, et al., Water Res. 41 (2007) 277-286. DOI:10.1016/j.watres.2006.10.030 |
| [79] |
Y. Ma, S. Sundar, H. Park, et al., Water Res. 70 (2015) 246-254. DOI:10.1016/j.watres.2014.12.006 |
| [80] |
X. Zhang, B. Yu, N. Zhang, et al., Bioresour. Technol. 202 (2016) 113-118. DOI:10.1016/j.biortech.2015.11.083 |
| [81] |
X. Wei, L.A. Sayavedra-Soto, D.J. Arp, Microbiology 150 (2004) 1869-1879. DOI:10.1099/mic.0.26785-0 |
| [82] |
S. Lücker, M. Wagner, F. Maixner, et al., Proc. Natl. Acad. Sci. U. S. A. 107 (2010) 13479-13484. DOI:10.1073/pnas.1003860107 |
| [83] |
R.C. Jin, J.J. Yu, C. Ma, et al., Appl. Microbiol. Biotechnol. 98 (2014) 1377-1388. DOI:10.1007/s00253-013-5004-9 |
| [84] |
W. Zhang, D. Wang, Y. Jin, Bioresour. Technol. 250 (2017) 124-130. DOI:10.1016/j.biortech.2017.11.027 |
| [85] |
X. Yue, G. Yu, Z. Liu, et al., Bioresour. Technol. 254 (2018) 347-352. DOI:10.1016/j.biortech.2018.01.107 |
| [86] |
D. Jiang, W.O. Khunjar, B. Wett, et al., Environ. Sci. Technol. 49 (2015) 2523-2531. DOI:10.1021/es5043222 |
| [87] |
C. Hellinga, A.A.J.C. Schellen, J.W. Mulder, et al., Water Sci. Technol. 37 (1998) 135-142. DOI:10.2166/wst.1998.0350 |
| [88] |
D. Clippeleir, Haydee Vlaeminck, et al., Appl. Microbiol. Biotechnol. 97 (2013) 10199-10210. DOI:10.1007/s00253-013-4744-x |
| [89] |
B. Ma, Y. Peng, S. Zhang, et al., Bioresour. Technol. 129 (2013) 606-611. DOI:10.1016/j.biortech.2012.11.025 |
| [90] |
T. Zeng, D. Li, H. Zeng, et al., Water Sci. Technol. 71 (2015) 725-733. DOI:10.2166/wst.2015.019 |
| [91] |
T. Awata, Y. Goto, T. Kindaichi, et al., Water Sci. Technol. 72 (2015) 2148-2153. DOI:10.2166/wst.2015.436 |
| [92] |
M. Tomaszewski, G. Cema, A. Ziembińska-Buczyńska, Chemosphere 182 (2017) 203-214. DOI:10.1016/j.chemosphere.2017.05.003 |
| [93] |
M. Laureni, P. Falås, O. Robin, et al., Water Res. 101 (2016) 628-639. DOI:10.1016/j.watres.2016.05.005 |
| [94] |
M. Laureni, D.G. Weissbrodt, I. Szivák, O. Robin, et al., Water Res. 80 (2015) 325-336. DOI:10.1016/j.watres.2015.04.026 |
| [95] |
J. Dosta, I. Fernández, J.R. Vázquez-Padín, et al., J. Hazard. Mater. 154 (2008) 688-693. DOI:10.1016/j.jhazmat.2007.10.082 |
| [96] |
J. Gluhak-Heinrich, L. Ye, L.F. Bonewald, et al., J. Hazard. Mater. 179 (2010) 471-479. DOI:10.1016/j.jhazmat.2010.03.027 |
| [97] |
J. Gabarró, R. Ganigué, F. Gich, et al., Bioresour. Technol. 126 (2012) 283-289. DOI:10.1016/j.biortech.2012.09.011 |
| [98] |
L.S. Poh, X. Jiang, Z. Zhang, et al., Appl.Microbiol.Biotechnol. 99 (2015) 9215-9226. DOI:10.1007/s00253-015-6742-7 |
| [99] |
B.B. Colliver, T. Stephenson, Biotechnol. Adv. 18 (2000) 219-232. DOI:10.1016/S0734-9750(00)00035-5 |
| [100] |
P. Chain, J. Lamerdin, F. Larimer, et al., J. Bacteriol. 185 (2003) 2759-2773. DOI:10.1128/JB.185.9.2759-2773.2003 |
| [101] |
H. Beaumont, S. Lens, Wnm, et al., Mol. Microbiol. 54 (2010) 148-158. |
| [102] |
F. Sabba, C. Picioreanu, R. Nerenberg, J. Bone Miner. Res. 17 (2017) 753-757. DOI:10.1002/bit.26399 |
| [103] |
Y. Law, P. Lant, Z. Yuan, Environ. Sci. Technol. 47 (2013) 7186-7194. DOI:10.1021/es4009689 |
| [104] |
B.J. Ni, L. Peng, Y. Law, et al., Environ. Sci. Technol. 48 (2014) 3916-3924. DOI:10.1021/es405592h |
| [105] |
T.D. Rapson, H. Dacres, Trac-Trends Anal. Chem. 54 (2014) 65-74. DOI:10.1016/j.trac.2013.11.004 |
| [106] |
S. Lammers, E. Suess, Mar. Chem. 47 (1994) 115-125. DOI:10.1016/0304-4203(94)90103-1 |
| [107] |
M.M.R. Jahangir, P. Johnston, M.I. Khalil, et al., J. Environ. Manage. 111 (2012) 208-212. DOI:10.1016/j.jenvman.2012.06.033 |
| [108] |
L. Peng, B.J. Ni, L. Ye, et al., Water Res. 74 (2015) 58-66. DOI:10.1016/j.watres.2015.02.003 |
| [109] |
W. Jia, Y. Chen, J. Zhang, et al., Bioresour. Technol. 261 (2018) 19-27. DOI:10.1016/j.biortech.2018.03.137 |
| [110] |
P. Czepiel, P. Crill, R. Harriss, Environ. Sci. Technol. 29 (1995) 2352-2356. DOI:10.1021/es00009a030 |
| [111] |
B. Ruhland, T. Becker, G. Müller, Sens. Actuators. B-Chem. 50 (1998) 85-94. DOI:10.1016/S0925-4005(98)00160-9 |
| [112] |
R. Marques, A. Rodriguez-Caballero, A. Oehmen, et al., Water Res. 99 (2016) 171-179. DOI:10.1016/j.watres.2016.04.052 |
| [113] |
W. Liang, C. Yu, H. Ren, et al., Bioresour. Technol. 198 (2015) 172-180. DOI:10.1016/j.biortech.2015.08.075 |
| [114] |
K. Arshak, E. Moore, G.M. Lyons, et al., Sensor. Rev. 24 (2004) 181-198. DOI:10.1108/02602280410525977 |
| [115] |
S. Siswoyo, K.C. Persaud, V.R. Phillips, et al., AIP Conference Proceedings (2017), doi: http://dx.doi.org/10.1063/1.4975283.
|
| [116] |
S. Kang, S. Kim, S. Kang, et al., Sensors 14 (2014) 14400-14410. |
| [117] |
A.A. Peyghan, M.T. Baei, S. Hashemian, et al., Chin. Chem. Lett. 23 (2012) 1275-1278. DOI:10.1016/j.cclet.2012.09.008 |
| [118] |
M. Samadizadeh, A.A. Peyghan, S.F. Rastegar, et al., Chin. Chem. Lett. 26 (2015) 1042-1045. DOI:10.1016/j.cclet.2015.05.048 |
| [119] |
B. Lebegue, M. Schmidt, M. Ramonet, et al., Atmos. Meas. Tech. 8 (2016) 10937-10982. |
| [120] |
K.E. Mampaey, U.G.J.M.V. Dongen, M.C.M.V. Loosdrecht, et al., Environ. Technol. 36 (2015) 1680-1690. DOI:10.1080/09593330.2015.1005029 |
| [121] |
J.M. Hinzman, J.L. Gibson, R.D. Tackla, et al., Biosens. Bioelectron. 74 (2015) 512-517. DOI:10.1016/j.bios.2015.06.074 |
| [122] |
X.X. Wang, F. Fang, Y.P. Chen, et al., Chemosphere. 175 (2017) 482-489. DOI:10.1016/j.chemosphere.2017.02.026 |
| [123] |
J. Gabarro, E. Hernandez-del Amo, F. Gich, et al., Water Res. 47 (2013) 7066-7077. DOI:10.1016/j.watres.2013.07.057 |
| [124] |
J. Hüpeden, S. Wegen, S. Off, et al., Appl. Environ. Microbiol. 82 (2016) 1838-1845. DOI:10.1128/AEM.03163-15 |
| [125] |
M. Alawi, A. Lipski, T. Sanders, et al., ISME J. 1 (2007) 256-264. DOI:10.1038/ismej.2007.34 |
| [126] |
Y.J. Shi, X.H. Wang, H.B. Yu, et al., Bioresour. Technol. 102 (2011) 2536-2541. DOI:10.1016/j.biortech.2010.11.081 |
| [127] |
F. Persson, C. Suarez, M. Hermansson, et al., Microb. Biotechnol. 10 (2017) 761-772. DOI:10.1111/1751-7915.12435 |