 2019, Vol. 30


b Hunan Provincial Key Lab of Dark Tea and Jin-Hua, School of Materials and Chemical Engineering, Hunan City University, Yiyang 413000, China;
c School of Chemistry and Chemical Engineering, Southeast University, Nanjing 211189, China;
d Hunan Key Laboratory of Biomedical Nanomaterials and Devices, Hunan University of Technology, Zhuzhou 412007, China;
e National Center for International Bio-targeting Theranostics, Guangxi Key Laboratory of Bio-targeting Theranostics, Collaborative Innovation Center for Targeting Tumor Theranostics, Guangxi Medical University, Nanning 530021, China
The most important characteristics of AuNPs are localized surface plasmon resonance (LSPR). The LSPR of AuNPs is related to their shape, size, and inter-particle distance [1, 2]. AuNPs exhibit strong and well-defined colors and its color could change from red to blue through aggregation. Based on its strong distance dependent optical, AuNPs could be used as visual signals for detecting DNA, RNA, and cells. Currently, there are two classes of AuNPs based visual assays. One is sandwich hybridization assay, which was developed by Mirkin [3]. In this assay, two kinds of AuNPs modified with two kinds of thiolated oligonucleotide probes were prepared. The sandwich hybridization occurred in the presence of target DNA, leading to the AuNPs aggregation and a color change from red to blue. The other one is based on the different binding properties towards unmodified AuNPs between ssDNA and dsDNA. The ssDNA can uncoil to expose its bases, bind to negatively charged AuNPs through electrostatic force [4], and prevent the AuNPs against salt-inducted aggregation [5]. Whereas, dsDNA could coil to form stable double-helix geometry and presents the negatively charged phosphate backbone, which caused dsDNA, could not bind to AuNPs, thus the AuNPs aggregated. The advantage of the second assay is avoiding functionalization of AuNPs [6]. Plenty of methods, which based on unmodified AuNPs aggregation, have been reported for visual detection of small molecular [7], DNA [8-12], bacteria [13], nuclease activity [14], and metal ions [15].
However, the above two classes of Au NPs based visual assays need a pre-preparation of AuNPs, which will cost extra energy, time, and resource, especially for preparation of modified label AuNPs. Then, Wu and co-workers used visual method during the formation of AuNPs to detect melamine [16]. Their mechanism is that melamine can interact with pyrocatechol-3, 5-disodiumsulfonate (PD) due to intermolecular hydrogen bonding and form polymeride [17]. The Au3+ could bind to sulfonate ligand (from PD) and be in situ reduced to AuNPs. The synthesized PD-capped-AuNPs will aggregate in the present of melamine, which can cause solution change to blue.
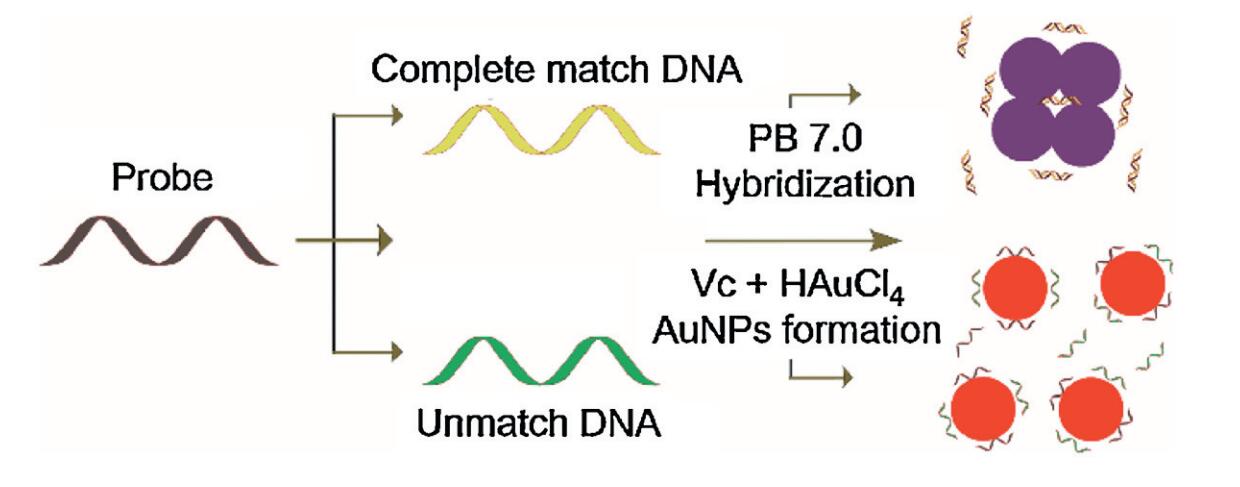
In this article, we established a rapid platform for DNA detection during the formation of AuNPs based on different electrostatic properties of ssDNA and dsDNA. The different properties in AuNPs aggregation can be used to determine whether a sample contains special sequence DNA. As shown in Scheme 1, the ssDNA could bind to the in situ synthesized AuNPs due to its exposed bases thus make AuNPs stable and present a stable red color. However, in the present of target DNA, the binding between formed dsDNA and AuNPs was disturbed, owing to their electrostatic repulsion, thus, the synthesized AuNPs aggregated, the solution would change to red immediately and turn to purple in 10 min. An important factor of this assay was to find an appropriate reductant. As ascorbic acid has a mild reaction rate, which can reduce Au3+ to AuNPs at room temperature, therefore, was chosen as reductant in this assay. Moreover, this strategy was simple for use without time-consuming chemical modification process.

|
Download:
|
| Scheme 1. Schematic illustration of the colorimetric detection of DNA during the formation of Au NPs. | |
HAuCl4 and ascorbic acid were purchased from Sinopharm Chemical (Shanghai, China). Oligonucleotides were synthesized by Sangon Bioengineering Technology Company. Tap DNA polymerase and other polymerase chain reaction (PCR) reagents were purchased from ShangHai Biocolor BioScience Technology Company (China). Streptavidin-modified magnetic nanoparticals (SA-MNPs) were obtained from Nanjing Longliang Biological Science and Technology Limited Company (China). Other reagents were domestic analytical reagents.
Transmission electron microscopy (TEM) measurements were made on JEM-2100. The samples of AuNPs were dropped on the carbon-coated copper grids and dried at room temperature. The measurements of ultraviolet absorption spectra were performed with UV-1800. The photos were captured with Canon EOS 760D.
Clinic samples were amplified in a 30 μL reaction system including 2 μL of extracted DNA, 2 μL of 10 μmol/L biotinylated reverse primer and forward primer, 3 μL of 10 × PCR buffer, 1.8 μL of 25 mmol/L MgCl2, 0.6 μL of 10 mmol/L dNTP mixture and 1.5 U of Tap DNA polymerase. After PCR amplification, 100 μg of SA-MNPs were added to the PCR products directly. The mixture was kept at room temperature for 20 min in order to ensure that the targets DNA were captured by SA-MNPs completely. The dsDNA–MNP complexes were washed twice with 25 mmol/L phosphate buffer (PB, pH 6.6) and finally dispersed in 20 mmol/L PB buffer (pH 7.0). After denaturation at 95 ℃ for 5 min, the mixture wasputintoice rapidly.Then the supernatant was transferred to new pipes for further detection.
In a typical detection of ssDNA assay, 10 μL of ssDNA solution (1 μmol/L) and 25 μL of 20 mmol/L PB (pH 7.0) were mixed with 10 μL of 10 mmol/L ascorbic acid at room temperature. Then 30 μL of 1 mmol/L HAuCl4 was quickly added to the above mixture, producing a red color immediately due to the formation of AuNPs. In the absence of ssDNA, the red color would fade in 10 min. In addition to the special instructions, we take pictures in 10 min after adding HAuCl4. The overall reaction volume is 100 μL.
In dsDNA detection assay, equimolar probe and target were hybridized at room temperature in 20 mmol/L PB buffer (pH 7.0) for 30 min, later 10 μL of 10 mmol/L ascorbic acid, and 30 μL of 1 mmol/L HAuCl4 was quickly added to the above mixture, then take pictures in 10 min.
In clinic sample detection assay, target DNAs were amplified by PCR and purified through magnetic separation. After thermal denaturation and magnetic separation, the obtained target ssDNA and probe (100 nmol/L) were denatured at 95 ℃ for 5 min, and hybridized at 37 ℃ for 30 min. When the hybridization process finished, 10 μL of 10 mmol/L ascorbic acid, and 30 μL of 1 mmol/L HAuCl4 was quickly added to the above mixture, then take pictures in 10 min.
We found that stable red AuNPs could be synthesized when ascorbic acid was added into AuHCl4 solution [18]. AuNPs in solution can be stabilized by the adsorbed negative ions (e.g., ascorbic acid, citrate), which prevents the aggregation of AuNPs due to the strong van Waals attraction between AuNPs [19]. However, the PB buffer could disrupt the ascorbic acid surface layer of AuNPs, causing AuNPs aggregate [11, 20]. Therefore, when ascorbic acid was added into AuHCl4 solution containing 20 mmol/L PB buffer, the synthesized AuNPs would aggregate. However, if the solution contains enough ssDNA, PB buffer no longer causing the aggregation of AuNPs, thus the solution could retain its red color. The reason for its stabilization is that AuNPs adsorb negative oligonucleotides whose repulsion forces prevent aggregation of AuNPs. These results were confirmed by Li [21] through fluorescence quenching experiments.
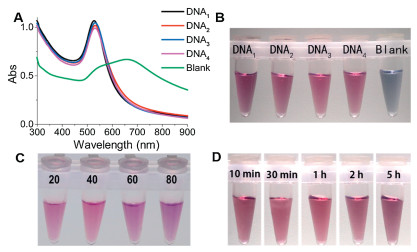
Inspired by the characteristic of ssDNA preventing AuNPs aggregation [22], we conducted a study of the formation of AuNPs using ssDNA as a stabilizer, aiming to study the effect of oligonucleotide sequence, length, pH value and Au3+ dosage on the color of synthesized AuNPs. Fig. 1 shows the effect of oligonucleotide sequence on AuNPs formation. The different sequences were used to form AuNPs, the solution color changed to red and the surface plasmon peak of all samples occurred near by 535 nm, suggesting AuNPs formation was not sensitive to the oligonucleotide sequences. As a negative control, the solution changed to cyan and the peak width is broad (Fig. 1A), indicating the AuNPs were aggregated, the corresponding photographs were shown in Fig. 1B. The synthesized AuNPs stabilized by various lengths of oligonucleotides were shown in Fig. 1C, which could retain red over 5 h. Shown in Fig. 1D was DNA3 stabilized AuNPs at different time. Apparently, the formed stable red AuNPs in the present of oligonucleotides provide a chance for visual detection of ssDNA, which is much simple than the method proposed by Draz [23].

|
Download:
|
| Fig. 1. (A) The UV–vis absorption spectra of different DNA sequences stabilized AuNPs; (B) The photograph of different DNA sequences stabilized AuNPs; (C) The effect of oligonucletide length on the color of ssDNA stabilized AuNPs and (D) the effect of time on DNA3 stabilized AuNPs. | |
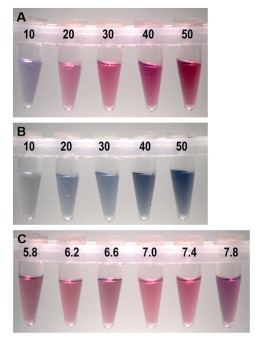
The color depth of AuNPs is correlated with its concentration in suspension. Meanwhile, the molar ratio of HAuCl4 and reductant could affect the diameter of AuNPs thus control the color of AuNPs [24, 25]. To illustrate the effect of Au3+ dosage on the color, we adjusted the volume of 1 mmol/L HAuCl4 in the range of 10-50 μL. As shown in Figs. 2A and B, the color intensity increased with the increase in Au3+ dosage. Considering the sensitivity of naked eye, 30 μL of HAuCl4 was selected in the following experiments. In order to discuss the effect of pH value, AuNPs were formed under different pH values (5.8-7.8). As shown in Fig. 2C, the color of solution could always keep red in this pH values range. The results suggested that pH value (5.8–7.8) showed little interference on the color of AuNPs.

|
Download:
|
| Fig. 2. The effect of HAuCl4 dosage on the color of ssDNA stabilized AuNPs (A) and AuNPs in the absence of ssDNA (B). From left to right were 10, 20, 30, 40, 50 μL of 1 mmol/L HAuCl4. (C) The effect of pH value on the color of ssDNA stabilized AuNPs. | |
As mentioned above, the formation of AuNPs was not sensitive to ssDNA sequences, implying that it cannot be used to detect specific sequences of ssDNA. In order to overcome this shortage, we developed a rapid visual assay based on the essential different charge properties between ssDNA and dsDNA. Since the bases are exposed to the solution, ssDNA is easy to attach charged AuNPs [21, 22]. The adsorption of ssDNA could prevent the aggregation of AuNPs due to electrostatic forces. Whereas, dsDNA has a stable double helix structure and its bases could not be exposed to AuNPs. In this case, the adsorption of dsDNA will disturb and the AuNPs would aggregate [22]. Therefore, the solution containing ssDNA could keep red while containing dsDNA would change to purple after adding HAuCl4 and ascorbic acid. The phenomena provide the basic of visual detection of specific DNA sequences.
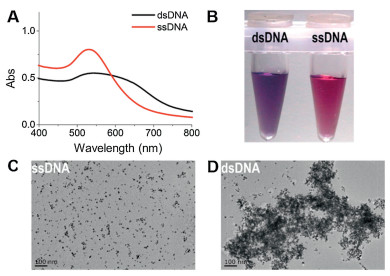
As shown in Scheme 1, after hybridization, ascorbic acid and AuHCl4 were added to the mixture solution. In the presence of complementary DNA, double-strand DNA was formed, producing an apparent purple color due to the aggregation of AuNPs. However, the AuNPs showed a stable red color in the absence of complementary DNA, as well as the present of mismatch DNA (Fig. S1 in Supporting information). In order to confirm its accuracy, UV–vis absorption spectroscopy and TEM experiments were conducted. The UV–vis spectra showed a broad peak width for the exit of dsDNA (Fig. 3A) and its color was purple (Fig. 3B). Shown in Figs. 3C and D were the TEM results, which showed the present of complementary DNA causing the aggregation of AuNPs. The aggregation was accompanied with a shift in the LSPR of AuNPs and a change in color of solution.

|
Download:
|
| Fig. 3. The characters of dsDNA and ssDNA stabilized AuNPs. (A) UV–vis absorption spectra. (B) Photograph. (C, D) TEM images. The concentrations of ssDNA and dsDNA were 100 nmol/L. The scale bars are 100 nm. | |
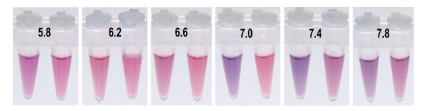
While a weak alkalinity environment could promote DNA hybridization. An important parameter of this method is pH value that can strongly influences the hybridization of dsDNA. As shown in Fig. 2C, the synthesis of ssDNA stabilized AuNPs was insensitive to pH value in the range of 5.8-7.8. Fig. 4 illustrates the effect of pH value to visual detection of dsDNA. Under weak acids environment, the solution containing either complementary DNA or random DNA keeps red, suggesting non-aggregation of AuNPs. When the pH value was adjusted to neutral or weak alkalinity, the solution containing complementary DNA change to purple while the solution containing unmatched DNA still kept red. It should be noticed that the color discrimination of solution reduced with the increase in pH value, which makes recognition of target DNA hard by naked eye. Considering sensibility of naked eye, the DNA detection assay was conducted under pH 7.0.

|
Download:
|
| Fig. 4. The effect of pH value on the color of dsDNA stabilized AuNPs. The concentration of dsDNA was 100 nmol. | |
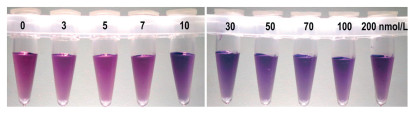
Fig. 5 demonstrates the relationship between the concentration of complementary DNA and solution colors. With the increase of target DNA concentration, the solution color gradually turned to purple. The results showed that the color changed to purple as the complementary DNA concentration was 10 nmol/L, preliminarily suggests the limit detection of complementary DNA concentration is 10 nmol/L via naked eye without any instruments. Besides, the probe length could also affect hybridization efficiency. Compared with probe of 13 bases, the probe of 21 bases was better for visual detection (Fig. S2 in Supporting information). Therefore, we use the probe of 21 bases to detect the clinic samples. Different probe length sequences were showed in Table S1 (Supporting information).

|
Download:
|
| Fig. 5. The influence of different concentrations of target DNA on the color of dsDNA stabilized AuNPs. The concentration of oligonucleotide probe was 100 nmol/L and the concentration of target DNA were 0, 3, 5, 7, 10, 30, 50, 70, 100, 200 nmol/L. | |
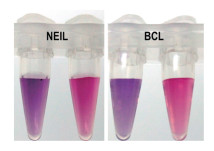
Following the model experiments, we performed visual analysis based on PCR amplification. Firstly, gastric cancer genes were amplified in a 30 μL reaction system. Secondly, dsDNA was captured by magnetic particles and transformed to ssDNA through thermal denaturation and magnetic separation. Thirdly, target DNA was detected following the protocol illustrated in clinic sample detection assay. Two pairs of primers were designed for the amplification of gastric cancer genes, and two short oligonucleotide probes were designed for hybridizing with the PCR-amplified DNA. The purified single strand PCR product was hybridized with oligonucleotide probe at 37 ℃ for 30 min. After hybridization, HAuCl4 and ascorbic acid were added into the mixture solution immediately. As shown in Fig. 6, the solution changed to purple in 10 min in thepresentof targetDNA.While, the colorof solution could retain red over 5 h for negative sample. The two designed PCRamplified DNAs could be identified through the change of color.

|
Download:
|
| Fig. 6. The photograph of the color of AuNPs in the presence or absence of gastric cancer gene. The symbols in picture denote for different probes. | |
In summary, we demonstrated a label-free, visual method for determination of special sequence DNA during the formation of AuNPs. The method was based on the different adsorption properties of ssDNA and dsDNA towards AuNPs due to their electrostatic properties. The ssDNA could bind to AuNPs and prevent its aggregation. One advantage of our approach is that it obviates the process for pre-preparation of AuNPs and is easy to realize automation connected with magnetic separation technique. Our approach has additional benefits beyond its simplicity, inexpensive, and rapid speed. It could identify target DNA in 10 min. Moreover, we have applied the method in clinical gastric cancer sample detection. The designed PCR-amplified DNA [26] was recognized by oligonucleotide probes due to their purple color. We believe that our method could be applied for rapid and visual DNA detection and integrated to some simple and small apparatus.
Declaration of competing interestThe authors declare that they have no conflict of interest.
AcknowledgmentsThis work was financially supportedby the National Key Research and Development Program of China (No. 2017YFA0205301), the National Natural Science Foundation of China (Nos. 61527806, 81902153 and 61871180), the Natural Science Foundation of Hunan Province (No. 2017JJ2069), the Hunan Key Research Project (No. 2017SK2174) and the Programs for Changjiang Scholars and Innovative Research Team in University (No. IRT_15R13).
| [1] |
J. Yang, F. Nian, Z. Guo, et al., Nanosci. Nanotechnol. Lett. 9 (2017) 1491-1496. DOI:10.1166/nnl.2017.2503 |
| [2] |
T.D. Woiski, D.C.P. Lisiane, J. De Moura, et al., J. Biomed. Nanotechnol. 13 (2017) 68-76. DOI:10.1166/jbn.2017.2331 |
| [3] |
C.A. Mirkin, R.L. Letsinger, R.C. Mucic, et al., Nature 382 (1996) 607-609. DOI:10.1038/382607a0 |
| [4] |
D. Graham, B.J. Mallinder, W.E. Smith, Angew. Chem. Int. Ed. 39 (2000) 1061-1063. DOI:10.1002/(SICI)1521-3773(20000317)39:6<1061::AID-ANIE1061>3.0.CO;2-9 |
| [5] |
D. Vilela, M.C. González, A. Escarpa, Anal. Chim. Acta 751 (2012) 24-43. DOI:10.1016/j.aca.2012.08.043 |
| [6] |
D.P. Kalogianni, T. Koraki, T.K. Christopoulos, et al., Biosens. Bioelectron. 21 (2006) 1069-1076. DOI:10.1016/j.bios.2005.04.016 |
| [7] |
F. Xia, X. Zuo, R. Yang, et al., Proc. Natl. Acad. Sci. U. S. A. 107 (2010) 10837-10841. DOI:10.1073/pnas.1005632107 |
| [8] |
X. Bai, C. Shao, X. Han, et al., Biosens. Bioelectron. 25 (2010) 1984-1988. DOI:10.1016/j.bios.2010.01.012 |
| [9] |
K. Cho, Y. Lee, C.H. Lee, et al., J. Phys. Chem. C 112 (2008) 8629-8633. DOI:10.1021/jp801078m |
| [10] |
R. Kanjanawarut, X. Su, Anal. Chem. 81 (2009) 6122-6129. DOI:10.1021/ac900525k |
| [11] |
D.G. Thompson, A. Enright, K. Faulds, et al., Anal. Chem. 80 (2008) 2805-2810. DOI:10.1021/ac702403w |
| [12] |
W. Yun, J. Jiang, D. Cai, et al., Biosens. Bioelectron. 77 (2016) 421-427. DOI:10.1016/j.bios.2015.09.065 |
| [13] |
N. Sattarahmady, G.H. Tondro, M. Gholchin, et al., Biochem. Eng. J. 97 (2015) 1-7. DOI:10.1016/j.bej.2015.01.010 |
| [14] |
R. Cao, B. Li, Y. Zhang, et al., Chem. Commun. 47 (2011) 12301-12303. DOI:10.1039/c1cc15994a |
| [15] |
Y. Li, P. Wu, H. Xu, et al., Talanta 84 (2011) 508-512. DOI:10.1016/j.talanta.2011.01.037 |
| [16] |
Z. Wu, H. Zhao, Y. Xue, et al., Biosens. Bioelectron. 26 (2011) 2574-2578. DOI:10.1016/j.bios.2010.11.007 |
| [17] |
H. Wang, D. Chen, L. Yu, et al., Spectrochim. Acta A 137 (2015) 281-285. DOI:10.1016/j.saa.2014.08.041 |
| [18] |
Y. Li, J. Sun, Q. Chen, et al., Nanosci. Nanotechnol. Lett. 9 (2017) 982-987. DOI:10.1166/nnl.2017.2430 |
| [19] |
W. Zhao, M.A. Brook, Y. Li, ChemBioChem 9 (2008) 2363-2371. DOI:10.1002/cbic.200800282 |
| [20] |
T. Li, H. Yi, Y. Liu, et al., J. Biomed. Nanotechnol. 14 (2018) 150-160. DOI:10.1166/jbn.2018.2491 |
| [21] |
H. Li, L.J. Rothberg, J. Am. Chem. Soc. 126 (2004) 10958-10961. DOI:10.1021/ja048749n |
| [22] |
H. Li, L. Rothberg, Proc. Natl. Acad. Sci. U. S. A. 101 (2004) 14036-14039. DOI:10.1073/pnas.0406115101 |
| [23] |
M.S. Draz, L. Ma, X. Lu, J. Biomed. Nanotechnol. 14 (2018) 1025-1038. DOI:10.1166/jbn.2018.2507 |
| [24] |
S.E. Lohse, J.R. Eller, S.T. Sivapalan, et al., ACS Nano 7 (2013) 4135-4150. DOI:10.1021/nn4005022 |
| [25] |
T. Yang, Z. Li, L. Wang, et al., Langmuir 23 (2007) 10533-10538. DOI:10.1021/la701649z |
| [26] |
S. Pang, N. Sheng, J. Wang, et al., Nanosci. Nanotechnol. Lett. 10 (2018) 32-38. DOI:10.1166/nnl.2018.2565 |