 2019, Vol. 30


b State Key Laboratory of Complex Nonferrous Metal Resources Clean Utilization, Kunming University of Science and Technology, Kunming 650093, China;
c Institute of Physics & IMN Macro Nanos(ZIK), Ilmenau University of Technology, Ilmenau 98693, Germany
Since graphene, which has a unique two-dimensional honeycomb structure, was discovered experimentally by mechanical exfoliation in 2004, it has become a substantial research topic in the fields of physics and materials science owing to its excellent properties and wide range of applications [1, 2]. Meanwhile, porous graphene (PG) has high specific surface area and physicochemical properties that are of high interest due to its multidomain applications in molecular sieves, catalysts, electrochemical capacitors, water treatment, and biomaterials [3]. Owing to these excellent performance and applications of PG, different methods have been applied to prepare PG. To date, these methods include electron beam lithography [4–6], UV-assisted photodegradation [7, 8], catalytic oxidation or catalytic hydrogenation [9–11], chemical vapor deposition [12, 13], hydrothermal method [14–16], carbothermal reduction [17, 18], and chemical method [19–21].
Among these methods, the chemical method is well-known because it requires less equipment and has simple operation processes. PG is formed by the loss of an oxygen-containing functional group from graphene oxide (GO) [11, 18]. The oxygen-containing functional groups on the GO surface can be lost by special chemical treatment. For example, Eigler et al. [22] stated that GO is stable in hydrochloric acid (HCl) but not during NaOH treatment. The reason is that a structure with an enhanced amount of ether groups (C—O—C or C—O—C') is formed in HCl, and GO can be efficiently reduced until the epoxy groups in NaOH are lost and reduced GO (rGO) is obtained. Afterward, sulfate from GO undergoes further hydrolysis in acidic solutions, occurring mainly with S—O bond cleavage and resulting in the formation of a hydroxyl group. Dimiev et al. [23] demonstrated that the nucleophilic attack of hydroxyl ion on carbonyl results in C—C bond cleavage and decarboxylates to form carbon dioxide. Ultrasound often plays a synergistic role in GO treatment combined with other acidic or alkaline conditions [24–26]. Zhang et al. [24] confirmed that the epoxide and hydroxyl functional groups of GO can be successfully removed in strongly alkaline solutions with the help of ultrasound, resulting in stable aqueous graphene suspensions. Therefore, two conclusions can be made:(1) Under acidic conditions, the functional groups of GO including hydroxyl groups, carboxyl groups, and epoxy groups are formed by the hydrolysis of sulfate and transformation of other functional groups. (2) Under alkaline conditions, the carbon atoms on GO are unstable, causing the carboxyl and epoxy groups to detach from the graphene sheet, especially with the aid of ultrasound.
In this study, we report a novel approach to synthesize impurity-free PG with intrinsic porous structure through acidalkali etching-assisted sonication. The PG possesses an extremely high specific surface area of 2184 m2/g. It also contains micropores and mesopores simultaneously, and the average pore diameter is approximately 3 nm. Meanwhile, through transmission electron microscopy (TEM) and Fourier transform infrared spectroscopy (FTIR) analyses, the effects of acid, alkali, and ultrasound treatment on PG formation are elucidated. In an acidic solution, oxygen-containing functional groups are formed due to the hydrolysis of sulfate and continuous transformations of these functional groups on GO. In an alkali solution with the aid of ultrasound, PG is obtained due to the loss of carboxyl and epoxide groups.
First, graphite powder was oxidized by a reformative process based on Hummer's method [27]. As a substitute for water washing, HCl served as an abstergent to deal with the oxidized graphite. Second, a mixture comprising 0.5 g of sodium nitrate (NaNO3) and 1 g of graphite powder was poured into 23 mL of concentrated sulfuric acid (H2SO4) with constant-speed mechanical stirring at 0 ℃ for 2.5 h. Subsequently, the temperature of the reaction mixture was increased up to 35 ℃. Subsequently, the mixture was added with 3 g of potassium permanganate (KMnO4) powder, and the temperature was maintained at 35 ℃ for 3 h. Then, the temperature of the reaction system was further increased to 95 ℃, whereafter 46 mL of deionized (DI) water was poured into the mixture, holding for 30 min. Afterward, 230 mL of DI water was added to the mixed liquid. Approximately 3 mL of 30% hydrogen peroxide (H2O2) was added dropwise to eliminate contamination. DI water was added to the mixture until the color became reddish brown. The mixture was left to stand for 8 h to obtain a viscous substance. Thereafter, 250 mL of HCl and 1.5 L of DI water were added for washing accompanied with centrifugalization (6000 rpm). The washing process was repeated thrice alternately with equal quantity of DI water. Finally, the bottom residue was dried in a vacuum drying box at 80 ℃ for 24 h to obtain GtO/HCl powder as a precursor for the next step.
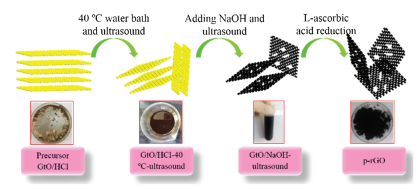
Fig. 1 shows a schematic of the whole preparation process of p-rGO. The concrete steps of preparing p-rGO were as follows. First, GtO/HCl powder (1 g) was added into DI water (100 mL). The mixture was sonicated in a water bath (50 kHz, 160 W, SK3300HP, KUDOS, China) for 3 h, and the system's temperature was maintained at 40 ℃ (GtO/HCl-40 ℃-ultrasound) simultaneously. Sodium hydroxide (NaOH) at 6 mol/L concentration was added into the dispersed liquid. Afterward, the black product was sonicated for 3 h (GtO/NaOH-ultrasound). Then, it was diluted by centrifugation (6000 rpm, TG16-WS, Xiang Li, China) until it could not be separated as a tan aqueous colloidal suspension (p-GO). Aqueous colloidal suspension was freeze-dried directly. Finally, L-ascorbic acid (L-AA) was used as a reduction agent to obtain p-rGO at 23 ℃ [28]. The reduced p-rGO film (dried) was obtained via continuous vacuum filtration, followed by freeze-drying. As shown in Fig. S1 (Supporting information), GtO/HCl and GtO/HCl-40 ℃-ultrasound were bright yellow and light brown in color, respectively. The reason for the abovementioned phenomenon is that both GtO/HCl and GtO/HCl-40 ℃-ultrasound possessed a large number of oxygen-containing functional groups. However, the black color of GtO/NaOH-ultrasound and p-rGO was due to the loss of oxygen-containing functional groups [23].

|
Download:
|
| Fig. 1. Schematic representing the experimental steps of p-rGO. | |
The morphologies and microstructures of the prepared carbon nanomaterials were characterized by TEM (JEM-2100, JEOL, Japan) with an accelerating voltage of 200 kV. The crystal structure of carbon nanomaterials was recorded by XRD (Rigaku D/Max-2500, Rigaku, Japan) using Cu-Kα radiation (λ = 0.15418 nm) in the 2θ range of 5°–40° with scanning rate of 2°/min. The specific surface areas and pore size distribution were measured using the Brunauer–Emmett–Teller (BET) method based on the nitrogen adsorption/desorption isotherms measured at 77 K (V-Sorb X800, Gold APP Instruments Corp., China). Furthermore, FTIR measurement was performed on a Fourier transform infrared spectrometer (Nicolet iS 10, Thermo Fisher Scientific, USA) with the KBr method and spectral range of 400 cm-1 to 4000 cm-1 at room temperature. X-ray photoelectron spectroscope (XPS, Kratos Axis Ultra DLD, Japan) was used for the surface analyses of the samples. Al Kα line (hv = 1486.6 eV) was used as a radiation source, and the C1s peak position was set at 284.4 eV as an internal standard.
The TEM images of p-GO and p-rGO (after reduction) samples are shown in Figs. 2a and b, respectively. These two samples both exhibit the morphological characteristic features of a crowd wrinkle, and many specific porous regions possess varying morphology and size. Compared with that of the p-GO sample, the surface of the p-rGO sample contained holes. The above result indicates that the reduction process might influence pore formation. As shown in Figs. 2a and b, the defect areas possess numerous micropores and mesopores with a wide range of sizes (0.8–7 nm), consistent with the pore size (approximately 3 nm) calculated from the N2 sorption isotherms (Fig. 2c). Fig. S2 (Supporting information) shows the PG with size of ~5 μm and layer numbers of 3–8. The p-rGO film has a BET surface area of 2184 m2/g, indicating that the prepared graphene sheet is thin and contains a large number of pores. The XRD patterns (Fig. 2d) show the variation of diffraction peaks of flake graphite. From the raw graphite to GtO/HCl, the sharp diffraction peak (101) at 2θ = 26.5° and another characteristic peak (001) at 2θ = 11.5° indicated the superior oxidation degree of GtO/HCl. A small bump (002) of p-rGO appeared at 2θ = 24.3°, whereas the oxidation peak almost disappeared, suggesting the reduction and overlap of lamellae with GO [29].

|
Download:
|
| Fig. 2. TEM images of (a) p-GO and (b) p-rGO; (c) Nitrogen adsorption/desorption isotherm and pore size distribution of p-rGO; (d) XRD patterns of flake graphite, GtO/HCl and p-rGO. | |
Fig. S3 (Supporting information) shows the TEM images of the product by controlling the experimental conditions: (a) synthesis of rGO without NaOH, (b) synthesis of rGO without HCl, (c) synthesis of rGO without ultrasound and (d) synthesis of rGO by ultrasound at 0 ℃ using NaOH and HCl washing. PG was not obtained under the first three conditions mentioned above. Fig. S3d shows that pores were formed on the GO sheets by ultrasonic treatment at 0 ℃. These results demonstrate the necessity of acid, alkali, and ultrasonic treatment for pore formation, as proven by the pores appearing from the ultrasonic stripping stage.
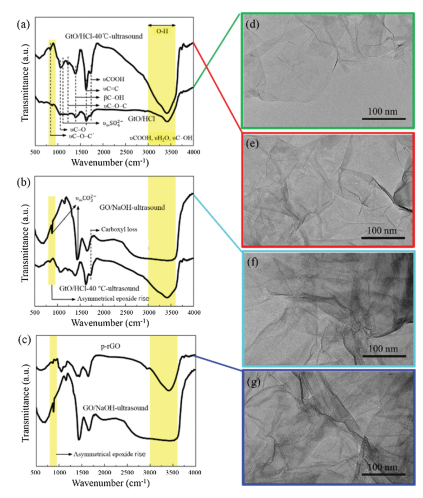
On the basis of the above results, the pore formation mechanism needs to be investigated. Therefore, we observed the variation of functional groups of the carbonaceous material during the whole experiment via FTIR (Figs. 3a–c). Fig. 3a presents a comparison of the FTIR spectra of GtO/HCl and GtO/HCl-40 ℃-ultrasound. Fig. 3b presents a comparison of the FTIR spectra of GtO/HCl-40 ℃-ultrasound and GO/NaOH-ultrasound. Fig. 3c presents a comparison of the FTIR spectra of GO/NaOH-ultrasound and p-rGO. Additionally, corresponding TEM images of GtO/HCl, GtO/HCl-40 ℃-ultrasound, GO/NaOH-ultrasound, and p-rGO are shown in Figs. 3d–g, respectively. The infrared spectrum of the synthesized GtO/HCl in Fig. 3a shows that the sample contains several oxygen-containing functional groups [30, 31]. These groups consist of hydroxyls (possible COOH and H2O contribution; C—OH, 3000–3600 cm-1), ketones and/or carboxyls (C=O, COOH, ~1700–1900 cm-1), sp2-hybridized C=C (in-plane stretching, ~1550–1650 cm-1), epoxides (symmetrical groups, C—O—C, other asymmetrical ether groups, C—O—C', ~1200–1300 and 800–900 cm-1) and sulfate ions (H2SO4, HSO4- or SO42-) inserted between layers when oxidized. Table S1 (Supporting information) shows the specific functional groups and their corresponding vibration frequency range. As shown in Fig. 3a, compared with GtO/HCl, the sulfate ions in GtO/HCl-40 ℃-ultrasound are completely lost, and the absorption intensity of carboxyl (1738 cm-1) and epoxide groups (~835 and 1225 cm-1) is remarkably increased. These results are attributed to the hydrolysis of sulfate and transformations of oxygen-containing functional groups [32].

|
Download:
|
| Fig. 3. FTIR spectra of (a) GtO/HCl and GtO/HCl-40 ℃-ultrasound, (b) GO/NaOH-ultrasound, and (c) p-rGO in regions between 4000 cm-1 and 500 cm-1; corresponding TEM image of (d) GtO/HCl, (e) GtO/HCl-40 ℃-ultrasound, (f) GO/ NaOH-ultrasound, and (g) p-rGO. | |
Although the species and numbers of oxygen-containing functional groups have changed from GtO/HCl to GtO/HCl-40 ℃-ultrasound, the pore structure is not formed, as proven from the TEM images in Figs. 3d and e. As shown in Fig. 3b, compared with those of GtO/HCl and GtO/HCl-40 ℃-ultrasound, the oxygen-containing functional groups of GtO/NaOH-ultrasound are markedly changed according to FTIR spectral analysis, indicating that the peaks of carboxyl (~1738 cm-1) and epoxides (C—O—C, C—O—C', ~1200–1300 and 800–900 cm-1) disappeared. As shown in Fig. 3c, the oxygen functionality intensities of p-rGO, such as the vibration and deformation peaks of O—H groups at 3395 and 1397 cm-1 and the stretching peak of C–O (alkoxy) at 1025 cm-1, dramatically decrease compared with those of GtO/ NaOH-ultrasound. Meanwhile, as shown in Fig. S4 (Supporting information), the oxygen content of p-rGO is in a very low range from XPS spectral analysis. Compared with GtO/HCl and GtO/HCl-40 ℃-ultrasound, GtO/NaOH-ultrasound and p-rGO possess a pore structure, as shown by the TEM images in Figs. 3f and h. Owing to the mutual effect of acid, alkali, and ultrasound treatment, the oxygen-containing functional groups of GO on the surface are transformed and deoxidized, which is also the reason for the formation of PG. The formation mechanism of PG is introduced in detail in the following paragraphs.

|
Download:
|
| Fig. 4. Diagram of the formation mechanism of p-rGO. | |
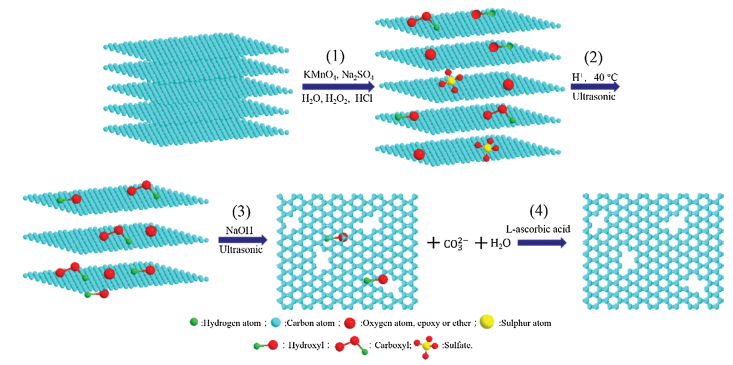
The diagram of the formation mechanism of p-rGO is shown in Fig. 4. According to TEM and FTIR results, the main process of PG synthesis could be divided into four stages: (1) The graphite is oxidized to obtain GtO/HCl, and the graphite layer spacing is increased due to the introduction of various oxygen-containing functional groups (including C—O H, C=O, COOH, C—O—C, C—O—C', C—O and SO42-). (2) GtO/HCl is sonicated at 40 ℃, giving rise to the initial increase of carboxyl and epoxide functional groups of GtO/HCl. In addition, sulfate disappears completely. The reason for the abovementioned results is that the sulfate radical reacted with water in acid solutions and the oxygen-containing functional groups transformed, leading to the formation of hydroxyl, carboxylic, and epoxide groups [22, 24, 32]. Moreover, the results confirm that the surface of GO does not produce pore structure even if ultrasound is available.(3) GtO/HCl-40 ℃-ultrasound is treated by NaOH with ultrasound. The results can be explained by the following reasons. On the one hand, under alkaline condition, the epoxy groups can be removed with the help of ultrasound [24–26]. On the other hand, the nucleophilic attack of hydroxyl ion on the carbonyl results in C—C bond cleavage and decarboxylates, consequently forming carbon dioxide (CO2). This phenomenon could be verified by the formation of carbonate ions as shown in the FTIR spectra of GO/NaOH-ultrasound. Noticeably, ultrasound irradiation drives some special features that generally do not occur in ordinary chemical reactions, such as elevated temperature, high pressure, and rapid cooling rates [26, 33]. Therefore, ultrasound irradiation contributes to the reduction of oxygen-containing functional groups and the dispersion of GO under alkaline condition. The abovementioned process indicates that the removal of carboxyl group and the loss of epoxy groups are the direct reasons of the formation of pores and carbonate. (4) Finally, p-rGO is obtained by the reduction of L-AA, which only reduces the oxygen-containing functional groups and the pore structure remains unchanged.
In conclusion, we have developed a new type of method to prepare impurity-free PG that has an intrinsic porous structure through the synergistic effects of acid, alkali, and ultrasound treatment. After the HCl treatment, more oxygen-containing functional groups are planted on the surface of GO. Under alkaline conditions, the carboxyl and epoxide groups on GO undergo decarboxylation to form CO2 via ultrasound treatment, resulting in the formation of PG. This approach is simple, efficient, and controllable, thereby providing a scale-up fabrication of PG for various device applications.
AcknowledgmentsThis work was financially supported by the National Natural Science Foundation of China (Nos. 11765010, 51704136), the Applied Basic Research Programs of Yunnan Provincial Science and Technology Department (No. 2016FB087), the Freely Exploring Fund for Academicians in Yunnan Province (No. 2018HA006).
Appendix A. Supplementary dataSupplementary material related to this article can be found, in the online version, at doi:https://doi.org/10.1016/j.cclet.2019.05.047.
| [1] |
K.S. Novoselov, A.K. Geim, S.V. Morozov, et al., Science 306 (2004) 666-669. DOI:10.1126/science.1102896 |
| [2] |
H.O. Zhu, C. Xiao, H. Cheng, et al., Nat. Commun. 5 (2014) 3960. DOI:10.1038/ncomms4960 |
| [3] |
V. Strauss, K. Marsh, M.D. Kowal, El-Kady M., R.B. Kaner, Adv. Mater 30 (2018) 1704449. DOI:10.1002/adma.201704449 |
| [4] |
S. Garaj, W. Hubbard, A. Reina, et al., Nature 467 (2010) 190-193. DOI:10.1038/nature09379 |
| [5] |
B. Song, G.F. Schneider, Q. Xu, et al., Nano Lett. 11 (2011) 2247-2250. DOI:10.1021/nl200369r |
| [6] |
C. Thiele, A. Felten, T.J. Echtermeyer, et al., Carbon 64 (2013) 84-91. DOI:10.1016/j.carbon.2013.07.038 |
| [7] |
Y.H. Ding, P. Zhang, Q. Zhuo, et al., Nanotechnol. 22 (2011) 215601. DOI:10.1088/0957-4484/22/21/215601 |
| [8] |
J.G. Radich, P.V. Kamat, ACS Nano 7 (2013) 5546-5557. DOI:10.1021/nn401794k |
| [9] |
Y. Lin, K.A. Watson, J.W. Kim, et al., Nanoscale 5 (2013) 7814-7824. DOI:10.1039/c3nr02135a |
| [10] |
T. Palaniselvam, M.O. Valappil, R. Illathvalappil, S. Kurungot, Energy Environ. Sci. 7 (2014) 1059-1067. DOI:10.1039/c3ee43648a |
| [11] |
J. Wan, L. Huang, J. Wu, et al., Adv. Funct. Mater. 28 (2018) 1800382. DOI:10.1002/adfm.201800382 |
| [12] |
N.S. Safron, M. Kim, P. Gopalan, M.S. Arnold, Adv. Mater 24 (2012) 1041-1045. DOI:10.1002/adma.201104195 |
| [13] |
D. Geng, B. Wu, Y. Guo, et al., J. Am. Chem. Soc. 135 (2013) 6431-6434. DOI:10.1021/ja402224h |
| [14] |
J. Zhang, B. Guo, Y. Yang, et al., Carbon 84 (2015) 469-478. DOI:10.1016/j.carbon.2014.12.039 |
| [15] |
T.H. Han, Y.K. Huang, A.T. Tan, V.P. Dravid, J. Huang, J. Am. Chem. Soc. 133 (2011) 15264-15267. DOI:10.1021/ja205693t |
| [16] |
W. Deng, Q. Fang, X. Zhou, H. Cao, Z. Liu, RSC Adv. 6 (2016) 20843-20849. DOI:10.1039/C5RA26088D |
| [17] |
X. Zhao, L. Zhang, S. Murali, et al., ACS Nano 6 (2012) 5404-5412. DOI:10.1021/nn3012916 |
| [18] |
D. Zhou, Y. Cui, P.W. Xiao, M.Y. Jiang, B.H. Han, Nat. Commun. 5 (2014) 4716. DOI:10.1038/ncomms5716 |
| [19] |
Y. Xie, X. Sheng, D. Xie, et al., Carbon 109 (2016) 673-680. DOI:10.1016/j.carbon.2016.08.079 |
| [20] |
S. Wu, G. Chen, N.Y. Kim, et al., Small 12 (2016) 2376-2384. DOI:10.1002/smll.201503855 |
| [21] |
X. Zhao, C.M. Hayner, M.C. Kung, et al., ACS Nano 5 (2011) 8739-8749. DOI:10.1021/nn202710s |
| [22] |
S. Eigler, S. Grimm, F. Hof, A. Hirsch, J. Mater. Chem. A 1 (2013) 11559-11562. DOI:10.1039/c3ta12975f |
| [23] |
A.M. Dimiev, L.B. Alemany, J.M. Tour, ACS Nano 7 (2013) 576-588. DOI:10.1021/nn3047378 |
| [24] |
X. Fan, W. Peng, Y. Li, et al., Adv. Mater. 20 (2010) 4490-4493. |
| [25] |
W. Zhang, W. He, X. Jing, J. Phys. Chem. B 114 (2010) 10368-10373. DOI:10.1021/jp1037443 |
| [26] |
K. Krishnamoorthy, G.S. Kim, S.J. Kim, Ultrason. Sonochem. 20 (2013) 644-649. DOI:10.1016/j.ultsonch.2012.09.007 |
| [27] |
S. William, Hummers Jr., E.O. Richard, J. Am. Chem. Soc. 80 (1958) 1339-1339. DOI:10.1021/ja01539a017 |
| [28] |
J. Zhang, H. Yang, G. Shen, et al., Chem. Commun. 46 (2010) 1112-1114. DOI:10.1039/B917705A |
| [29] |
B. Sidhureddy, A.R. Thiruppathi, A. Chen, Chem. Commun. 53 (2017) 7828-7831. DOI:10.1039/C7CC03060F |
| [30] |
M. Acik, G. Lee, C. Mattevi, et al., J. Phys. Chem. C 115 (2011) 19761-19781. DOI:10.1021/jp2052618 |
| [31] |
S. Eigler, C. Dotzer, A. Hirsch, M. Enzelberger, P. Müller, Chem. Mater. 24 (2012) 1276-1282. DOI:10.1021/cm203223z |
| [32] |
A. Dimiev, D.V. Kosynkin, L.B. Alemany, P. Chaguine, J.M. Tour, J. Am. Chem. Soc. 134 (2012) 2815-2822. DOI:10.1021/ja211531y |
| [33] |
A. Askarinejad, A. Morsali, Ultrason. Sonochem. 16 (2009) 124-131. DOI:10.1016/j.ultsonch.2008.05.015 |