 2019, Vol. 30


b State Key Laboratory of Geochemistry and Guangdong Key Laboratory of Environmental Protection and Resources Utilization, Guangzhou Institute of Geochemistry, Chinese Academy of Sciences, Guangzhou 510640, China
Oxidation is one of the most essential properties of tropospheric atmosphere. HOx radicals (OH and HO2) control the oxidant capacity of atmosphere through oxidation of trace gases emitted by nature or human beings [1-3]. OH radicals react with reduction polluted species such as CO, CH4, SO2, VOCs, and produce peroxide radicals such as HO2 and RO2. HO2 radicals react with NO, ozone, halogen oxidants and turn back to OH. The fast recycling of HOx radicals sustains high oxidation capacity in the troposphere. Therefore, it is essential to explicit the chemical mechanism of HOx radicals.
However, field measurement results show that observed HO2 concentration is lower than simulation results of HO2 concentration in some area, which means the known mechanism in the model cannot explain the unexpected lower HO2 concentration [4-11]. A potential sink for HO2 radicals is heterogeneous reaction of HO2 and aerosol, which may be very essential due to large surface area of aerosol [10, 11]. A study of marine atmosphere suggested that HO2 uptake on aerosol attributed to 23% of HO2 pathways [4], which means HO2 uptake on aerosol is one of the most important sinks in HO2 budget. Furthermore, a number of field measurement and simulation results also reveal that heterogeneous reaction of HO2 is one of the main uncertainties of HO2 budget in highly active aerosol area [12, 13].
Besides, heterogeneous uptake of HO2 has potential significant impact on regional HOx and O3 concentration. Sensitivity test using a global model suggests that if the γ(HO2) decreases from 0.2 to 0.028, the concentration of OH, HO2 and O3 in east China especially in North China Plain (NCP) region will dramatically increase 106%, 31% and 27%, respectively [14]. Another sensitivity study showed that γ(HO2) led to a large uncertainty of HOx simulation over highly polluted area in China [12]. Nevertheless, if γ(HO2) increased from 0.02 to 0.4, the daytime-average O3 production rates decreased 15% in Beijing but less than 5% in Shanghai, Guangzhou and Lanzhou [13]. A recent study shows that HO2 uptake is the main reason for annually increasing O3 concentration at summer time in China, especially in NCP region [15]. That is because the declination of PM2.5 concentration reduced the HO2 sink of heterogeneous uptake on aerosol and indirectly increased the HO2 sink of reaction with NO which stimulated O3 generation [15]. The HO2 uptake coefficient was set to 0.2 in GEOS-Chem model and the product species (H2O or H2O2) of heterogeneous reaction does not significantly affect the result [15]. Since large uncertainties and high sensitivity remain on the contribution of HO2 uptake pathway to HOx and ozone concentration, an accurate assess of HO2 uptake coefficient is the key to the problem.
Uptake coefficient γ(HO2) is the probability that a HO2 radical losses due to collision onto surface of aerosol. γ(HO2) on aerosol was first measured by Mozurkewich et al. [16] using aerosol flow tube coupled with a chemical amplification system. They found dramatic HO2 loss owing to heterogeneous reaction on Cu(Ⅱ)-doped aqueous aerosol [16]. Since then, uptake of HO2 onto dry salt films, solid films of dusts, dry aerosol, aqueous aerosol and organic aerosol are determined in laboratory [17-27]. The measured γ(HO2) on aqueous (NH4)2SO4 aerosol varied a lot from 0.003 to 0.1 among different research groups (Table 1). In addition, the γ(HO2) had a difference of one order of magnitude, no matter onto dry or aqueous aerosol. For dry particle the reasons may be the difference of experimental conditions (pressure, humidity) and effective surface area. For aqueous aerosol, trace metal contamination may contribute to the discrepancy among previous studies. Dramatic enhancement of γ(HO2) up to 0.4–0.5 was consistently found after sufficient Cu(Ⅱ) doped in aerosol [19, 20, 23]. There remains much to be known about heterogeneous uptake of HO2 onto aqueous (NH4)2SO4 aerosol with and without copper ions. It is essential to quantitatively determine the uptake coefficient of HO2 on (NH4)2SO4 aerosol as well as the influence of Cu(Ⅱ) concentration on γ(HO2). The Cu(Ⅱ) concentration dependence of γ(HO2) may greatly influence the magnitude of γ(HO2). However, few studies have determined the γ(HO2) changed with different Cu(Ⅱ) concentration at atmospheric level of HO2 concentration till now [28, 29]. As the concentration of Cu(Ⅱ) in aerosol significantly influenced γ(HO2), it is vital to know the relationship between these two parameters. In this study, aqueous (NH4)2SO4 aerosol was chosen as the target system. (NH4)2SO4 aerosol is one of the most typical continental aerosols. The formation of (NH4)2SO4 aerosol enhanced the formation of ammonia salts in aqueous aerosol [30]. In addition, ambient aerosols are aqueous during heavy polluted period [31]. We want to figure out if there exists a threshold of copper ion concentration for γ(HO2) elevation under certain humidity. Cu ion is selected mostly because its reaction rate with HO2 is 100 times higher than that of Fe ion although the concentration of dissolved Fe in ambient aerosol is several tens of times higher than that of dissolved Cu [32].
|
|
Table 1 Comparison of measured γ(HO2) on aqueous (NH4)2SO4 aerosol under different conditions with this work and previous studies.a |
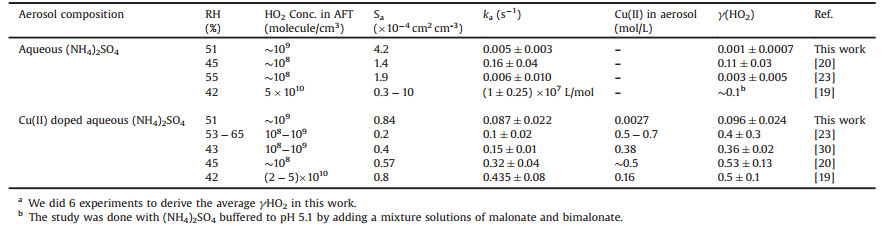
In this study, the schematic diagram of γ(HO2) measurement is shown in Fig. 1. The heterogeneous reaction was conducted at 51% RH under ambient pressure, room temperature (298 ± 2 K) and normal illumination level in laboratory. Similar design of aerosol flow tube [33] was used in this study. HO2 radicals were generated by photolysis of water vapor. Atmospheric levels of HO2 radicals were measured by laser induced fluorescence (LIF) method [34-39]. Aerosols are generated by a commercial atomizer. The size distribution (Fig. S1 in Supporting information) and total surface area concentration are measured by SMPS. Details of each component of the system are discussed in Supporting information. There are several important factors that impact the value of γ(HO2). They are HO2 initial concentration, reaction time, temperature and relative humidity. During our experiment, these parameters remained stable and unchanged among different aerosol surface area and Cu(Ⅱ) concentration.

|
Download:
|
| Fig. 1. Schematic diagram of the γ(HO2) measurement system. HEPA: high efficiency particulate air; SMPS: scanning mobility particle sizer; RH/T: relative humidity and temperature probe; FAGE: fluorescence assay by gas expansion; PMT: photomultiplier detector. | |
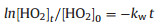
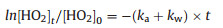
When aerosols were all filtered by the HEPA, the reaction rate of wall loss was measured in the first place. We assumed that the loss rate of HO2 on FEP coated flow tube was pseudo-first-order reaction, which was written as Eq. (1) [23]:
|
(1) |
In the equation, [HO2]t means the concentration of HO2 at different reaction time t. [HO2]0 describes the initial HO2 concentration before reaction. kw (s-1), the wall loss rate of HO2, was the slope of the exponential fit of HO2 concentration and reaction time (square dots) in Fig. 2. The corresponding effective uptake coefficient of HO2 (γeff) on the wall was calculated by Eq. (2) [40, 41]:

|
Download:
|
| Fig. 2. Decay of HO2 concentration without aerosol (squares), with aqueous (NH4)2SO4 (circles), and with Cu(Ⅱ)-doped (NH4)2SO4 (triangles) as a function of reaction time at RH 51%. The error bars represent 1 standard deviation. | |
|
(2) |
Where dtube is the diameter of the flow tube (31 mm) and v(HO2) is the molecular thermos velocity (437 m/s-1). As HO2 concentration is lower near the surface due to the wall reaction, the measured γeff is smaller than the true γ(HO2). Therefore, the influence of HO2 diffusion should be excluded. The true γ(HO2) is corrected by Eq. (3) [42]:
|
(3) |
where Γdiff represents the limitation of HO2 gas phase diffusion. For the uptake coefficients measured using a cylindrical flow tube, Γdiff is calculated by Eq. (4) [17, 43]:

|
(3) |
where D(HO2) is the diffusion coefficient of HO2. The wall loss rate increased from 0.047 ± 0.003 s-1 to 0.076 ± 0.003 s-1 as the RH increased from 15% to 51%. The uptake coefficient of HO2 loss on the wall increased from 3.8 × 10⁻⁶ to 6.7 × 10⁻⁶ with the increasing RH. The wall reaction rate was 0.049 ± 0.003 s-1 at 11% RH and rose to 0.079 s-1 at 66% RH [30], which is quite similar with the measurement results in this work. The wall loss rate ranged from 0.01 s-1 to 0.05 s-1 with a RH range from 35% to 75% [21]. The relatively lower wall loss rate was due to the larger diameter (60 mm) of the aerosol flow tube.
Secondly, the reaction rate of HO2 with ammonia sulfate and inner wall was measured. The kinetics of the HO2 loss with reaction time is described by Eq. (5):
|
(5) |
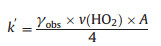
ka is the loss rate of HO2 reaction onto aerosol. The observation reaction rate (kobs, slope of the exponential fit of circle dots in Fig. 2), the sum of ka and kw, was determined using the equation above. The difference of the kw measured at the beginning and in the end was within the uncertainty of kw, indicating the kw was stable during the uptake measurement. Brown correction [44] for non-plug flow was also applied to correct ka, which was increased depending on wall loss rate. After correction HO2 uptake coefficient can be calculated using Eq. (6) [45]:
|
(6) |
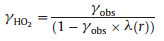
where k′ (s-1) is the corrected rate constant. A (cm2 cm-3) is the total aerosol surface concentration. γobs is the uptake coefficient determined from the experiment, which was corrected by using the equations (Eqs. (7)–(9)) [46]:
|
(7) |
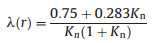
where λ(r) is a function of Knudsen number (Kn):
|
(8) |

|
(9) |
where r is the particle radii, the average of which was ~50 nm during our experiment. The impact of gas diffusion, which is the difference between γobs and corrected γ(HO2), is less than 1% during our experiment. The uncertainty of the determined HO2 uptake coefficient mainly includes those from the measurement of the HO2 concentrations (10%), the numerical fitting of Eq. (6) (8%), the measurement of aerosol surface concentrations (< 5%) and the Brown correction (5%). The uncertainty introduced by the length of the reaction time and the dimensional error of the flow tube can be neglected in the current framework of experiments.
The measured γ(HO2) is 0.001 ± 0.0007 on aqueous (NH4)2SO4 aerosol, which is around the detection limit (γ(HO2) = 0.001) during the experiments. Table 1 summarized the measured γ(HO2) on aqueous (NH4)2SO4 aerosol, which varied a lot. For aqueous aerosols, second-order kinetic was found at RH = 42% with the reaction rate coefficient (1 ± 0.25) × 107 L mol-1 s-1 by Thornton and Abbatt [19]. γ(HO2) was estimated as ~ 0.1 with assumption of first-order reaction. The HO2 initial concentration was 5 × 10¹⁰ molecule/cm3, which was 50 times higher than the concentration we used. A model predicted that the increasing of HO2 concentration of 50 times would increase γ(HO2) by a factor of 45 [47]. Therefore the difference between this work and the previous study [19] can be explained by the HO2 concentration.
Both George et al. [23] and Taketani et al. [20] observed firstorder kinetics for HO2 uptake onto aqueous salt aerosol. For (NH4)2SO4 aerosol at ~ 55% RH, the γ(HO2) was 0.003 ± 0.005 [23] and 0.15 ± 0.03 [20]. They used similar apparatus setup to our work. The latter is relatively higher, which mainly due to possible transition metal contamination [23] along with lower HO2 initial concentration (~108 molecule/cm3 at 30 cm position) and shorter reaction time (5–11 s). In their study [23], fresh solutions of (NH4)2SO4 were prepared daily to avoid transition metal contamination. The concentrations of both Cu and Fe ion in atomizer solution were less than 1.8 μmol/L [23]. According to their measurement, that low concentration of Cu or Fe contributed no enhancement of γ(HO2). However, the study [20] lacked description about quality control of atomizer solutions of (NH4)2SO4. Measurements showed that lower HO2 initial concentration resulted in higher γ(HO2) [23], which also can be found in heterogeneous reactions of NO2 and O3 on soot surface [48]. One possible explanation is that the active species, formed by HO2 heterogeneous reactions, is consumed with a higher consuming rate at higher initial concentration therefore the γ(HO2) is smaller. Our results as well as the results from George have no observable γ(HO2) on aqueous (NH4)2SO4 aerosol.
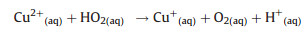
Thirdly, the HO2 uptake coefficients for aqueous (NH4)2SO4 aerosols doped with CuSO4 were measured. As shown in Fig. 2, HO2 loss rate on Cu(Ⅱ)-doped (NH4)2SO4 aerosol was significantly higher that the loss rate on aqueous (NH4)2SO4 aerosol. That is because Cu(Ⅱ) ions catalyze O2- and HO2 reactions in the aqueous phase, which accelerates HO2 loss through the following reactions (R1–R4):
|
(R1) |
|
(R2) |

|
(R3) |

|
(R4) |
The reaction rates of the above reactions (R1–R4) are 1.2 × 10⁸, 8.0 × 10⁹, 3.5 ×10⁹, 9.4 ×10⁹, respectively [49-51]. The reaction of HO2 and O2- with copper ion is rapid, therefore the lifetime of HO2 in aerosol with sufficient Cu ions is short (~ns) [20]. The influence of the resistance due to reaction and partitioning processes in aerosol is not as important as the mass accommodation α.
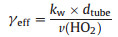
The γ(HO2) measurement results with different RH and Cu(Ⅱ) concentrations were depicted in Fig. 3. Mole concentration of copper ion was divided by aerosol liquid water (ALW) to calculate Cu(Ⅱ) concentration in aerosol. ALW was calculated by a thermodynamic model [52] named Aerosol Inorganic Model (AIM). Cu(Ⅱ) concentration was then corrected by calculated activity coefficient and ion strength. The results showed that γ (HO2) increased with higher Cu(Ⅱ) concentration. The copper ion concentrations here were estimated from 5.4 × 10⁻⁵ to 2.7 × 10⁻³ mol/L. Our results suggested that γ(HO2) increased dramatically when Cu(Ⅱ) concentration reached the level of 10-3 mol/L at 51% RH. There exists competition between physical effect and chemical reaction. Before the threshold of the Cu(Ⅱ) concentration, the physical effect such as gas diffusion is competitive with chemical reaction. After the threshold, the aqueous phase chemical reaction exceeded diffusion and became the dominant contributor for HO2 uptake on aerosol. The reason of the distinct deviations at 10-3 mol/L remains unclear. The high sensitivity to Cu(Ⅱ) concentration may explain the deviation to some extent. Other unknown factors may also have an effect on the deviation. The γ (HO2) is 0.096 ± 0.024 with 2.7 × 10⁻³ mol/L of Cu(Ⅱ) concentration. With the increasing of copper ion concentration, the γ(HO2) is mainly determined by mass accommodation α rather than gas diffusion and aerosol phase reaction and partitioning. Laboratory results of γ(HO2) in Fig. 3 show that the copper ion concentrations as well as relative humidity significantly affected the value of g (HO2). In other words, these laboratory results imply that we cannot quantify γ(HO2) in ambient aerosol without discussion the Cu(Ⅱ) concentration and relative humidity.

|
Download:
|
| Fig. 3. Measured HO2 uptake coefficients onto Cu(Ⅱ) doped aqueous (NH4)2SO4 aerosols at 51% RH (circles) in this study and other previous studies (at 65% RH (squares) in [44], at 43% RH (diamonds) in [40], at 45%-55% RH (up triangle) in [18] and at 42% RH (down triangle) in [17]). The error bars are 2 standard deviations. | |
Similarly, when Cu(Ⅱ) molality was higher than 10-3 mol/L, HO2 reacted rapidly onto Cu(Ⅱ)-doped NH4HSO4 and LiNO3 aerosol [16]. Other previous studies implied that γ(HO2) can reach 0.2 or even higher with a Cu(Ⅱ) concentration greater than 0.01 mol/L, as long as the RH of the aqueous (NH4)2SO4 aerosol is greater than 42% [19, 20, 23, 30, 31]. That means if Cu ion concentration is high enough, the γ(HO2) is fully controlled by the mass accommodation α.
In general, the uptake coefficients of HO2 on aqueous (NH4)2SO4 have been measured at 51% RH and at room temperature using an aerosol flow tube coupled with LIF system for the first time in China. The measured γ(HO2) was 0.001 ± 0.0007 around the detection limit (0.001) for aqueous (NH4)2SO4 aerosol, which was in agreement with previous literature values. The Cu(Ⅱ) concentration dependence of γ(HO2) onto aqueous (NH4)2SO4 aerosol was measured. γ(HO2) was elevated when Cu(Ⅱ) concentration in aerosol was increased. When the copper concentration reached a certain threshold, the γ(HO2) elevated significantly with the increase concentration of Cu(Ⅱ) in the aerosol. The threshold of Cu (Ⅱ) concentration was the order of 10-3 mol/L at 51% RH. Therefore when an estimated value of γ(HO2) was added into a box model or regional model, we should estimate copper ion concentration in ambient aerosol for the first place. Besides, the parameterization of γ(HO2) should also include a parameter which represents copper ion concentration. Kinetic modeling simulation is necessary to evaluate the reaction processes of HO2 uptake on different types of aerosol with different RH as well as different concentrations of HO2 and transition metal ions. The strong dependence of γ(HO2) on the Cu(Ⅱ) concentration and highly variable concentration of Cu(Ⅱ) in the aerosol infer that the simple setup of γ(HO2) as a constant of about 0.2 [15] exists large uncertainty.
AcknowledgmentWe thank the National Natural Science Foundation of China (Nos. 91544225, 21522701) for the financial support.
Appendix A. Supplementary dataSupplementary material related to this article can be found, in the online version, at doi:https://doi.org/10.1016/j.cclet.2019.07.041.
| [1] |
H. Levy, J. Geophys. Res. 78 (1973) 5325-5332. DOI:10.1029/JC078i024p05325 |
| [2] |
B. Weinstock, H. Niki, Science 176 (1972) 290-292. DOI:10.1126/science.176.4032.290 |
| [3] |
C.C. Wang, L.I. Davis, Phys. Rev. Lett. 32 (1974) 349-352. DOI:10.1103/PhysRevLett.32.349 |
| [4] |
L.K. Whalley, K.L. Furneaux, A. Goddard, et al., Atmos. Chem. Phys. 10 (2010) 1555-1576. DOI:10.5194/acp-10-1555-2010 |
| [5] |
C.A. Cantrell, R.E. Shetter, T.M. Gilpin, et al., J. Geophys. Res.-Atmos. 101 (1996) 14653-14664. DOI:10.1029/95JD03613 |
| [6] |
R. Sommariva, W.J. Bloss, N. Brough, et al., Atmos. Chem. Phys. 6 (2006) 1135-1153. DOI:10.5194/acp-6-1135-2006 |
| [7] |
Y.G. Kanaya, R.Q. Cao, S.G. Kato, et al., J. Geophys. Res.-Atmos. 112 (2007) D11308. DOI:10.1029/2006JD007987 |
| [8] |
J.R. Olson, J.H. Crawford, W. Brune, et al., Atmos. Chem. Phys. 12 (2012) 6799-6825. DOI:10.5194/acp-12-6799-2012 |
| [9] |
D.A. Plummer, J.C. McConnell, P.B. Shepson, et al., Atmos. Environ. 30 (1996) 2195-2217. DOI:10.1016/1352-2310(95)00086-0 |
| [10] |
M. de Reus, H. Fischer, R. Sander, et al., Atmos. Chem. Phys. 5 (2005) 1787-1803. DOI:10.5194/acp-5-1787-2005 |
| [11] |
R. Commane, C.F.A. Floquet, T. Ingham, et al., Atmos. Chem. Phys. 10 (2010) 8783-8801. DOI:10.5194/acp-10-8783-2010 |
| [12] |
Z. Liu, Y. Wang, D. Gu, et al., Atmos. Chem. Phys. 12 (2012) 7737-7752. DOI:10.5194/acp-12-7737-2012 |
| [13] |
L.K. Xue, T. Wang, J. Gao, et al., Atmos. Chem. Phys. 14 (2014) 13175-13188. DOI:10.5194/acp-14-13175-2014 |
| [14] |
H.L. Macintyre, M.J. Evans, Atmos. Chem. Phys. 11 (2011) 10965-10974. DOI:10.5194/acp-11-10965-2011 |
| [15] |
K. Li, D.J. Jacob, H. Liao, et al., Proc. Natl. Acad. Sci. U. S. A. 116 (2019) 422-427. DOI:10.1073/pnas.1812168116 |
| [16] |
M. Mozurkewich, P.H. Mcmurry, A. Gupta, et al., J. Geophys. Res.-Atmos. 92 (1987) 4163-4170. DOI:10.1029/JD092iD04p04163 |
| [17] |
D.R. Hanson, J.B. Burkholder, C.J. Howard, et al., J. Phys. Chem. 96 (1992) 4979-4985. DOI:10.1021/j100191a046 |
| [18] |
R.G. Remorov, Y.M. Gershenzon, L.T. Molina, et al., J. Phys. Chem. A 106 (2002) 4558-4565. DOI:10.1021/jp013179o |
| [19] |
J. Thornton, J.P.D. Abbatt, J. Geophys. Res.-Atmos. 110 (2005) D08309. |
| [20] |
F. Taketani, Y. Kanaya, H. Akimoto, J. Phys. Chem. A 112 (2008) 2370-2377. DOI:10.1021/jp0769936 |
| [21] |
F. Taketani, Y. Kanaya, H. Akimoto, Atmos. Environ. 43 (2009) 1660-1665. DOI:10.1016/j.atmosenv.2008.12.010 |
| [22] |
Y. Bedjanian, M.N. Romanias, A. El Zein, Atmos. Chem. Phys. 13 (2013) 6461-6471. DOI:10.5194/acp-13-6461-2013 |
| [23] |
I.J. George, P.S.J. Matthews, L.K. Whalley, et al., Phys. Chem. Chem. Phys. 15 (2013) 12829-12845. DOI:10.1039/c3cp51831k |
| [24] |
P.S.J. Matthews, M.T. Baeza-Romero, L.K. Whalley, Atmos. Chem. Phys. 14 (2014) 7397-7408. DOI:10.5194/acp-14-7397-2014 |
| [25] |
P.S.J. Lakey, I.J. George, L.K. Whalley, Environ. Sci. Technol. 49 (2015) 4878-4885. DOI:10.1021/acs.est.5b00948 |
| [26] |
P.S.J. Lakey, I.J. George, M.T. Baeza-Romero, J. Phys. Chem. A 120 (2016) 1421-1430. DOI:10.1021/acs.jpca.5b06316 |
| [27] |
D.R. Moon, G.S. Taverna, C. Anduix-Canto, Atmos. Chem. Phys. 18 (2018) 327-338. DOI:10.5194/acp-18-327-2018 |
| [28] |
D.R. Moon, Doctoral Dissertation, University of Leeds, Leeds, 2018.
|
| [29] |
P.S.J. Matthews, Doctoral Dissertation, University of Leeds, Leeds, 2014.
|
| [30] |
G.H. Wang, R.Y. Zhang, M.E. Gomez, et al., Proc. Natl. Acad. Sci. U. S. A. 113 (2016) 13630-13635. DOI:10.1073/pnas.1616540113 |
| [31] |
Y.C. Liu, Z.J. Wu, Y. Wang, et al., Environ. Sci. Technol. Lett. 4 (2017) 427-432. DOI:10.1021/acs.estlett.7b00352 |
| [32] |
J. Mao, S. Fan, D.J. Jacob, et al., Atmos. Chem. Phys. 13 (2013) 509-519. DOI:10.5194/acp-13-509-2013 |
| [33] |
M.J. Tang, J. Keeble, P.J. Telford, Atmos. Chem. Phys. 16 (2016) 15397-15412. DOI:10.5194/acp-16-15397-2016 |
| [34] |
F. Holland, M. Hessling, A. Hofzumahaus, J. Atmos. Sci. 52 (1995) 3393-3401. DOI:10.1175/1520-0469 (1995)052<3393:ISMOTO>2.0.CO;2 |
| [35] |
F. Holland, J. Geophys. Res. 108 (2003) 8246. DOI:10.1029/2001JD001393 |
| [36] |
A. Hofzumahaus, U. Aschmutat, M. Hessling, et al., Geophys. Res. Lett. 23 (1996) 2541-2544. DOI:10.1029/96GL02205 |
| [37] |
H. Fuchs, B. Bohn, A. Hofzumahaus, et al., Atmos. Meas. Tech. 4 (2011) 1209-1225. DOI:10.5194/amt-4-1209-2011 |
| [38] |
K.D. Lu, F. Rohrer, F. Holland, Atmos. Chem. Phys. 12 (2012) 1541-1569. DOI:10.5194/acp-12-1541-2012 |
| [39] |
Z.F. Tan, H. Fuchs, K.D. Lu, Atmos. Chem. Phys. 17 (2017) 663-690. DOI:10.5194/acp-17-663-2017 |
| [40] |
C.J. Howard, J. Phys. Chem. 83 (1979) 3-9. DOI:10.1021/j100464a001 |
| [41] |
C. Wagner, F. Hanisch, N. Holmes, et al., Atmos. Chem. Phys. 8 (2008) 91-109. DOI:10.5194/acp-8-91-2008 |
| [42] |
P. Davidovits, C.E. Kolb, L.R. Williams, et al., Chem. Rev. 111 (2011) 76-109. |
| [43] |
M.J. Tang, R.A. Cox, M. Kalberer, Atmos. Chem. Phys. 14 (2014) 9233-9247. DOI:10.5194/acp-14-9233-2014 |
| [44] |
R.L. Brown, J. Res. Natl. Bur. Stand. 83 (1978) 1-8. DOI:10.6028/jres.083.001 |
| [45] |
J.N. Crowley, M. Ammann, R.A. Cox, et al., Atmos. Chem. Phys. 10 (2010) 9059-9223. DOI:10.5194/acp-10-9059-2010 |
| [46] |
N.A. Fuchs, A.G. Sutugin, Highly Dispersed Aerosols, Ann Arbor Science, Ann Arbor, 1970.
|
| [47] |
J.A. Thornton, L. Jaegle, V.F. McNeill, J. Geophys. Res.-Atmos. 113 (2008) D05303. |
| [48] |
M. Ammann, U. Pöschl, Atmos. Chem. Phys. 7 (2007) 6025-6045. DOI:10.5194/acp-7-6025-2007 |
| [49] |
J. Rabani, D. Klugroth, J. Lilie, J. Phys. Chem. 77 (1973) 1169-1175. DOI:10.1021/j100628a018 |
| [50] |
V. Berdnikov, Russ. J. Phys. Chem. 47 (1973) 1060-1162. |
| [51] |
M. Vonpiechowski, T. Nauser, J. Hoigne, et al., Ber. Bunsenges. Phys. Chem. 97 (1993) 762-771. DOI:10.1002/bbpc.19930970604 |
| [52] |
S.L. Clegg, P. Brimblecombe, A.S. Wexler, J. Phys.Chem. A 102 (1998) 2155-2171. DOI:10.1021/jp973043j |