 2019, Vol. 30


b Department of Chemistry, State Key Laboratory of Molecular Engineering of Polymers, iChEM, Shanghai Key Laboratory of Molecular Catalysis and Innovative Materials, Fudan University, Shanghai 200433, China;
c Institute of Functional Materials, Donghua University, Shanghai 201620, China;
d School of Materials Science and Engineering, Jingdezhen Ceramic Institute, Jingdezhen 333001, China
Nowadays the rapid growth trend of volatile organic com-pounds (VOCs) in air has attracted more and more attentions, because they can severely pollute the environment and adversely threaten human health. In addition, VOCs can also be exhaled in human breath via the lungs, and some of them can be identified as the specific biomarkers to indicate the abnormal metabolism of human body. Therefore, it is of significance to realize the rapid and accurate detection of trace amount of VOCs in air or exhaled gas of human breath [1-3]. The analysis techniques of gas chromatogra-phy-mass spectrometry (GC–MS) and colorimetric methods are generally used to detect the specific biomarkers of VOCs and show relatively high precision. However, these methods need expensive apparatuses and long analysis time, and in order to enhance the detection reliability, the careful preconcentration step and a professional operator are usually required for the analysis of VOCs [4]. In recent years, studies on semiconductor-based gas sensors have received great interest, which could be regarded as one of the optimal candidates for gas detection due to their low cost, facile conduction and rapid detection for gases of different components [5]. However, the gas sensing performance is strongly dependent on the intrinsic properties of gas sensor materials including compositions and micro/nanostructures, and a great number of metal oxide semiconductors with diverse nanostructures, such as hierarchical nanostructures [6, 7], nanofibers [8], hollow spheres [9], etc., have been rationally designed to improve the gas responses and responding kinetics of gas sensors. Noticeably, due to large surface area and well-defined porous structure, mesoporous metal oxides, such as ZnO [10], SnO2 [11], TiO2 [12], WO3 [13-15], have gained increasing interest for gas sensing reactions, which provide many exposed active sites to interact with target gas and opened channels for rapid diffusion of gas molecules.
As an important wide-gap n-type semiconductor, WO3 has some extensive advantages as high stability, nontoxicity, abundant sources and low cost, and it is thus widely used in the fields of energy storage and conversion, heterogeneous catalysis, gas sensing applications in detection of harmful gases such as NO2, NH3, and acetone (C3H6O) [16, 17]. Through a solvent evaporation-induced self-assembly (EISA) method combined with a simple template-carbonization strategy, highly ordered mesoporous WO3 with a large mesopore size (~10.9 nm) and high crystal framework was synthesized [13], which shows the excellent performance for H2S sensing at low concentration (0.25 ppm) and fast response (2 s)/recovery (38 s). This mesoporous WO3 could also be used as a sensing material for the rapid, sensitive and selective detection of trace bacteria of Listeria monocytogenes [14], revealing a great potential application of mesoporous WO3-based sensors in fast and precise detection of microbial contamination for the food and water safety. Through in situ decoration of Pt nanoparticles in mesoporous WO3, the WO3/Pt nanocomposites show an excellent sensing response to CO of low concentration at low temperature with good sensitivity, high selectivity and short response-recovery time (16 s/1 s) [15]. Previous works have demonstrated that the selectivity and other important sensing characteristics of resistive-type metal oxide gas sensors can be greatly improved via the combination of metal oxides with other materials to form the physical interface (e.g., heterojunction) between two dissimilar materials [18-20]. Therefore, it is highly desired to synthesize the mesoporous WO3-based nanocomposites with heterostructure of two components, in order to enhance their gas sensing perfor-mance in VOCs detection.
Carbon is considered to be one of the outstanding candidates for sensor materials due to its stable physicochemical properties [21, 22]. Since the empirical discovery of graphene-based two-dimensional (2D) materials, which are composed of carbon atoms arranged in a closely packed honeycomb pattern [23], their derivatives of graphene oxide (GO) and reduced graphene oxide (rGO) have also been synthesized via a facile and low-cost strategy [24, 25]. The rGO-based chemical sensors show ppb-level sensitiv-ity to different gases even at room temperature, due to their complete exposure of surface carbon atoms, active surface oxygen defects with high reactivity and fast charge transfer between the analytes and graphene [26, 27]. However, the selectivity of the graphene sensors is not so good and the recovery at room temperature is very slow, mainly because of the strong attachment of gas molecules on graphene sheets, thus high temperature (> 150 ℃) in vacuum or under ultraviolet illumination is required to achieve the full recovery [28]. Through decorating metal or metal oxide nanoparticles on rGO surface to form the rGO/metal or rGO/ metal oxide nanocomposites, their selectivity and response time as gas sensors could be distinctly improved due to the excellent chemical and electronic properties of rGO and high sensitivity of metal oxides to target gases as well [26]. For example, a selective rGO/SnO2 gas sensor was demonstrated to show high response to NO2 but decreased response to NH3 at room temperature [29]. The Pd doped WO3/rGO nanocomposites showed the significantly enhanced selective sensing response to hydrogen and acetone with the temperature dependent selectivity behavior [30]. According to the reported graphene-based gas sensors, it can be concluded that the binary or ternary nanocomposites are usually composed of metal nanoparticles and/or metal oxide nanoparticles highly dispersed on graphene (or its derivatives) surface, in which graphene can effectively enhance the conductivity of the nano-composites by increasing the charge transport and decrease the working temperature as well, and metal oxides can generally improve the sensitivity to diverse gases via the rich chemisorbed oxygen species. Previous work also demonstrated a surface-confined impact on the fabrication of such a composite [31]. However, in previous reports the tungsten oxide material was just simply mixed with graphene together, or tungsten oxide particles or nanorods were dispersed on the surface of graphene sheets [30, 32, 33]. Therefore, it still remains a great challenge to fabricate a nanostructure in combination of rGO sheets with mesoporous WO3 semiconductor. To the best of our knowledge, until now there has been no report about the gas sensing performance of the rGO-based mesoporous WO3 nanocomposites.
Herein, though a simple interface-induced co-assembly pro-cess, we construct a mesoporous tungsten oxide (WO3) decorated graphene aerogel (GA) nanocomposite (denoted as mWO3@GA), in which 3-dimentional macroporous GA composed of rGO sheets in skeleton was used as the substrate, amphiphilic block copolymers of PEO-b-PS was used as the soft template and chlorinated tungsten was used as the tungsten sources. The resultant mWO3@GA composites possess interconnected macroporous rGO networks and covered mesoporous WO3 on the graphene sheets, presenting a large pore size of 19 nm, surface area as high as 167 m2/g, and large pore volume of 0.26 cm3/g. The gas sensing performance of the mWO3@GA nanocomposites toward different gases was systematically studied, showing high selectivity and great response to acetone at low temperature of 150 ℃, making them be a promising candidate as the high-efficiency VOCs sensors. This work could pave a way for developing other hybrid materials of mesoporous metal oxides combined with graphene for gas sensing applications.
Graphene oxide (GO) was firstly synthesized from natural graphite powder by a modified Hummers method [34] and amphiphilic PEO-b-PS diblock copolymers were prepared by the atom transfer radical polymerization (ATRP) method reported previously [35]. Subsequently, graphene aerogel (GA) consisting of reduced graphene oxide (rGO) with developed macroporosity and good mechanical stability was fabricated by the hydrothermal assembly of GO in an aqueous solution (1.0 mg/mL) at 180 ℃ for 12 h and following freeze drying process to remove water [36]. Mesoporous tungsten oxide precursor solution was prepared by the co-assembly of WCl6 species with diblock copolymer of PEO-b-PS. In a typical process, 0.1 g of PEO-b-PS was first dissolved in 5 mL of THF to form a clear and transparent solution, then 0.5 mL of ethanol and 0.25 mL of acetylacetone were added to form a light color solution, in which 0.4 g of WCl6 was dissolved. To fabricate mWO3@GA composites, 15 mg of GA was immersed into 7 mL of the as-prepared tungsten precursor solution with stirring for 1.5 h, in order to make GA thoroughly contact with the solution. Afterwards, the composite was transferred on a Petri dish followed by evaporation of the solvent at room temperature for 1 h and annealed at 100 ℃ for 24 h, and the inorganic-polymer@GA composites were obtained. In the second thermal treatment process, the composites were calcined at 350 ℃ for 2 h and then at 500 ℃ for 1 h in Ar atmosphere with heating rate of 1 ℃/min to promote crystallization of mesoporous WO3 on GA substrate, and then the product of mWO3@GA nanocomposites were obtained.
Transmission electron microscopy (TEM) measurements were conducted on a JEOL 2100 microscope (Japan) operated at 200 kV. Field-emission scanning electron microscopy (FESEM) experi-ments were performed on the Hitachi model S-4800 field emission scanning microscope. Wide-angle X-ray diffraction (XRD) patterns were recorded on a Bruker D8 powder X-ray diffractometer (Germany) with Ni-filtered Cu Kα radiation (40 kV, 40 mA). Nitrogen adsorption-desorption isotherms were tested at 77 K with a Micromeritics Tristar 3020 analyzer. The samples were degassed under vacuum at 180 ℃ for at least 6 h before measure-ments. The specific surface area was calculated using the Brunauer-Emmett-Teller (BET) method. The pore volume and pore size distribution were calculated by using the Barrett-Joyner-Halenda (BJH) model from the adsorption branches of isotherms. The total pore volumes (V) were evaluated according to the adsorbed amount at a relative pressure P/P0 of 0.995. Raman spectra were recorded with Brucker RFS 100/S spectrometer. X-ray photoelec-tron spectroscopy (XPS, PHI-5000C ESCA) was collected with Mg Kα radiation (hν = 1253.6 eV) and Al Kα radiation (hν = 1486.6 eV). Binding energy values were charge corrected to the adventitious carbon (C 1s = 284.6 eV). Thermogravimetric analysis (TGA) was carried out by a Mettler Toledo TGA-SDTA851 analyzer (Switzerland) from 30 ℃ to 800 ℃ under air with a heating rate of 5 ℃/min.
During the sensor prepared process, the mWO3@GA materials were mixed with a calculated amount of water and ground into slurry in a mortar, which was then coated directly onto the outer surface of ceramic tube and dried in air at 150 ℃ for 3 h. A Cr-Ni alloy wire was inserted into the ceramic tube as a heater, and the working temperature could be adjusted by tuning the heating voltage. Finally, the sensor was calcined at 200 ℃ for 48 h to further improve the long-term stability. Vapor detection was carried out with a WS-30A gas sensing system (Zhengzhou Winsen Electronics Technology Co., Ltd., China) by using a static state gas distribution method. In the typical acetone detection, an acetone-air mixed gas was prepared by injecting a certain volume of liquid acetone on a heating platform into the test chamber, in which the evaporation of acetone was spread by two small electric fans. In the electric circuit for measuring the gas response (Fig. S1 in Supporting information), a load resistor (RL) was connected with a gas sensor. The circuit voltage (Vc) was set at 5 V, and the output voltage (Vout) was the terminal voltage of the load resistor. The sensitivity (S) of gas sensors in this study is defined as S = Ra/Rg, where Ra is the sensor resistance in air (the relative humidity (RH) was about 25%) and Rg is that in the test gas. The response time is defined as the time required for the conductance variation to reach 90% of the equilibrium value after a test gas was injected, and the recovery time is that required for the sensor to return to 10% above the original conductance in air after releasing the test gas, respectively.
The schematic synthesis procedure of the mWO3@GA nano-composites was illustrated in Fig. 1. PEO-b-PS copolymers were completely dissolved in the solvent of tetrahydrofuran (THF), and then ethanol and acetylacetone containing WCl6 salt were added to form the homogeneous solution. The hydrolyzed hydrophilic inorganic tungsten species can interact with the PEO segments by hydrogen bonding. Then GA was immersed in the solution, during the solvent evaporation process, the spherical micelles of PEO-b-PS/inorganic tungsten species were formed, which were then gradually packed into face-centered cubic (fcc) ordered meso-structure on the surface of rGO sheets via non-covalent forces between PEO segments and residual oxygen groups in GA (Step 1) [37, 38]. The as-formed GA@inorganic-polymer composites were then calcined at 350 ℃ for 2 h and then at 500 ℃ for 1 h in Ar atmosphere to remove the template of PEO-b-PS and promote the crystallization of mesoporous WO3, and the mWO3@GA nano-composites were obtained (Step 2).

|
Download:
|
| Fig. 1. Schematic formation process of the mesoporous WO3/GA nanocomposites. In Step 1, PEO-b-PS copolymers were completely dissolved in THF, to form a clear and transparent solution. The oligomers of tungsten species were generated from the hydrolysis and condensation of inorganic WCl6 precursors, which were associated with the protonated hydrophilic PEO segments of PEO-b-PS copolymers. As evaporation of the solvent, the spherical PEO-b-PS/inorganic sol composite micelles with PS blocks as the core and PEO segments as the shell were formed and packed into mesostructure on the surface of GA nanosheets. In Step 2, the mWO3@GA nanocomposites were obtained by calcination at 350 ℃ for 2 h and then at 500 ℃ for 1 h in Ar atmosphere. | |
Since GO has too many oxygen functional groups, the tungsten precursors are easily hydrolyzed and hardly assembled with surfactant on the surface of GO sheets. Therefore, a facile hydrothermal treatment was performed to get the rGO with fewer surface oxygen defects, which was further assembled into GA with three-dimensional (3D) porous structure and served as the monolithic substrates for loading mesoporous WO3. SEM images of GA in Figs. 2a and b show the 3D framework structures with well-defined interconnected macropores in size from sub micrometer to several micrometers and cylindrical monolith morphology (Fig. 2b, inset), which are from the self-assembly of two-dimensional (2D) rGO sheets by hydrothermal treatment combined with freeze drying and the formation of cross-linking sites via partial coalescing and overlapping of rGO sheets. TEM images of GA in Figs. 2c and d show that its pore walls actually consist of several layers of stacked rGO sheets with long-range folds. Therefore, the 3D macroporous structure of GA provides available open channels for loading PEO-b-PS/inorganic tungsten species, and the thin rGO sheets with some residual oxygen groups supply appropriate hydrophilic surface for the packing of spherical PEO-b-PS/ inorganic tungsten species micelles. When the GA cylinder was immersed into the solution, the spherical micelles of PEO-b-PS/ inorganic tungsten species, driven by the intermolecular forces between GA and micelles, can quickly diffuse into the macropores of GA, which were then adsorbed on the surface of rGO sheets and assembled together to form an ordered mesostructure as the proceeding of THF evaporation (Fig. S2 in Supporting information). The macroporous structure of GA was well remained after decorating the spherical micelles of PEO-b-PS/inorganic tungsten species (Fig. S3a in Supporting information), however, the surface of rGO sheets became rough, covered with a thin layer of ordered mesoporous amorphous WO3 (Fig. S3b in Supporting information). With a further thermal annealing treatment in Ar atmosphere to further stabilize the composite structure, the amorphous WO3 layer was locally crystallized to adhere firmly with rGO, and the surfactant of PEO-b-PS was decomposed for the formation of mesoporous structure, to obtain the target mesoporous WO3/GA nanocomposites.

|
Download:
|
| Fig. 2. SEM (a, b) and TEM (c, d) images of graphene aerogel (GA). | |
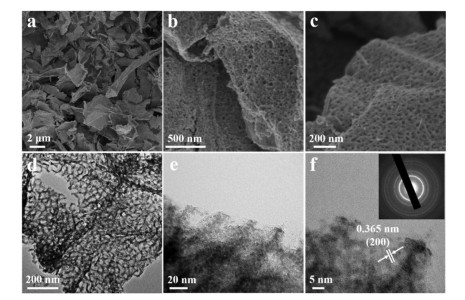
The morphology and fine structure of mWO3@GA nano-composites were closely characterized by SEM and TEM, respec-tively. From SEM images in Fig. 3a, it can be seen that the sample of mWO3@GA has a highly interconnected 3D framework containing macropores in diameter of 2–8 μm and very thin rGO sheets with a large exposed surface, which is quite similar with GA monolithic support (Fig. 2a). However, the surface of rGO sheets became rougher after coating mesoporous WO3, showing a great number of mesopores existing within WO3 layer (Figs. 3b and c), further demonstrating that mesoporous WO3 was successfully deposited on the surface of rGO sheets through a modified solvent evaporation induced self-assembly strategy. In fact, the spherical mesopores of WO3 are arranged in a nearly hexagonal pattern and vertically distributed on the GA supports, and the pore size is estimated to be around 19 nm (Fig. 3c). The thickness of the mWO3@GA sheets is in the range of 25–35 nm (Fig. 3b), which is much thicker than that of rGO sheets. In contrast, when GO sheets were directly used as substrate, no uniform mesoporous WO3 layer was grown on the GO sheets (Figs. S4a and b in Supporting information), and the irregular WO3 nanoparticles in size of 100–300 nm was loosely dispersed on the surface (Figs. S4c and d in Supporting information), mainly due to too many oxygen groups on GO sheets and the oxygen-containing functional groups promoted the rapid hydrolysis of the precursors of tungsten oxide, which was very disadvantageous for the assembly of the tungsten oxide and the surfactant to form a mesostructure. Besides, when no support of GO or rGO sheets was added in the synthesis, the bulky mesoporous WO3 with uniform ordered mesopores in average pore size of 19 nm was formed (Figs. S4e and f in Supporting information), which is quite consistent with our previous report [14]. TEM images of mWO3@GA (Figs. 3d and e) further prove that the rGO sheets are uniformly coated by mesoporous WO3 thin layers, which contain the perpendicularly aligned mesopores with a diameter of about 19 nm and a wall thickness of about 8 nm, formed by the thermal decomposition of PEO-b-PS as the template. After assembly with mesoporous WO3, the 2D sheet structure of rGO substrate can be remained, showing a translucent graphene layer through the perpendicular mesopores of thin WO3 layer (Fig. 3e). Furthermore, HRTEM image in Fig. 3f clearly shows a great number of ultrafine WO3 nanoparticles in size of ~8 nm, implying that the framework of mesoporous WO3 consists of highly crystallized WO3 nanoparticles. The lattice spacing of the WO3 nanoparticles is calculated to be about 0.365 nm, corresponding to the (200) lattice plane of monoclinic WO3. Selected-area electron diffraction pattern (SAED, inset in Fig. 3f) shows several well-resolved diffraction rings, corresponding to the (200), (020) and (002) lattice planes of monoclinic polycrystalline WO3, respectively.

|
Download:
|
| Fig. 3. SEM (a–c) and TEM (d–f) images of mWO3@GA nanocomposites. | |
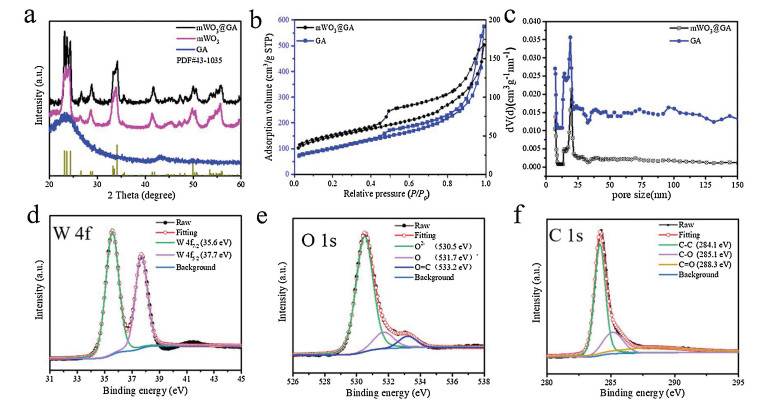
X-ray diffraction study (XRD) pattern of GA shows one broad peak between 20° and 30 °/2θ, implying that GA monolithic support is composed of amorphous rGO sheets. However, several well-resolved diffraction peaks in the range of 20–60° /2θ can be seen in the sample of mWO3@GA (Fig. 4a), which agree well with the crystalline WO3 of monoclinic phase with lattice parameters of a = 0.7297, b = 0.7539, c = 0.7688 nm and β = 90.91° (JCPDS No. 43-1035) [14], in good accordance with the result of HRTEM image (Fig. 3f). Noticeably, the diffraction peaks of WO3 become slightly broader, mainly attributed to the formation of ultrafine WO3 nanocrystals within the mesoporous framework. The XRD of mWO3 presents a similar pattern as mWO3@GA due to the same thermal treatment. The nitrogen adsorption-desorption isotherms of both GA and mWO3@GA exhibit the typical type-IV isotherm with large H2 hysteresis loops at the relative pressure (P/P0) higher than 0.45 (Fig. 4b), indicating that they possess spherical mesopores in large pore size. As displayed in the pore size distribution curves derived from the adsorption branch of the isotherms and calculated using Barrett-Joyner-Halenda (BJH) model, the average pore size of mWO3@GA is centered at ca. 19 nm, which is consistent with the molecular size of PEO-b-PS template and narrower than that of GA (Fig. 4c). The specific surface area and pore volume of mWO3@GA were calculated to be as high as 167 m2/g and 0.26 cm3/g, respectively, lower than those of GA (384 m2/g and 0.88 cm3/g), further conforming that mesoporous WO3 of high density was uniformly coated on GA to obtain the hybrid mWO3@GA nanocomposites, which could provide an amplified target-receptor interface and be beneficial for the diffusion and adsorption of many guest molecules. Compara-bly, the mesoporous WO3 shown the lowest surface area (91 m2/g) and pore volume (0.11 cm3/g), and the pore size distribution was also centered around 19 nm as shown in Fig. S5 (Supporting information).

|
Download:
|
| Fig. 4. XRD patterns of GA, mWO3 and mWO3@GA (a), N2 adsorption-desorption isotherms (b) and pore size distribution curves (c) of GA and mWO3@GA nanocomposites, respectively. X-ray photoelectron spectroscopy (XPS) of mWO3@GA nanocomposites: (d) W 4f, (e) O 1s and (f) C 1s. | |
X-ray photoelectron spectroscopy (XPS) was further used to investigate the surface composition and elemental states of mWO3@GA, and the survey-scanned spectrum proves the existence of W, C, and O elements (Fig. S6 in Supporting information). The high-resolution W 4f XPS spectrum can be deconvoluted into two peaks at 35.6 and 37.7 eV (Fig. 4d), corresponding to W 4f7/2 and W 4f5/2 of W6+ in mesoporous WO3, respectively [39, 40]. The deconvolution of O 1s XPS spectrum results in three peaks at 530.5, 531.7 and 533.2 eV (Fig. 4e), which are attributed to the lattice oxygen, chemisorbed oxygen species and surface O=C groups in rGO [41, 42], respectively. Usually, the adsorbed oxygen is more active to react with reducing gases than lattice oxygen, because it can greatly change the concentration of main carriers [14, 43]. The C 1s XPS spectrum can be fitted into three peaks centered at 284.1, 285.1 and 288.3 eV (Fig. 4f), which are associated to C-C (from graphitic sp2 carbons), C–O and C=O (from oxygenate groups attached to the carbon atoms) on the surface of GA monolithic support [32, 44], respectively. As an effective analysis method, Raman spectroscopy can be used to characterize G and D bands of graphene and its derivatives, and the intensity ratio of D band to G band (ID/IG) is usually recognized to reflect the defects and disorder degree of the graphitized structure, which can also be used to estimate the fraction of sp3/sp2-bonded carbon [33]. The Raman spectra of both GA and mWO3@GA nanocomposites in Fig. S7 (Supporting information) display the D band at 1344 cm -1 and G band at 1598 cm-1, respectively. The intensity ratio (ID/IG) for mWO3@GA (1.07) is slightly larger than that for GA (0.91), indicating that the former sample has more defects and higher disorder degree, which could be beneficial for improving gas sensing performance by boosting the adsorption of oxygen and gas species [45].
Acetone is known as one of the most emission VOCs in industry, which can also be thought as a biomarker for the diagnosis of diabetes at early stage. Therefore, it is quite important to accurately and rapidly detect low concentration of acetone. To verify the synergistic effect between mesoporous WO3 and GA substrate, the sample of mWO3@GA was employed to fabricate nanodevices for acetone sensing, benefiting from its good merits of high surface area, uniform pore size, ultrafine particle size of WO3 and their effective combination with GA skeleton.
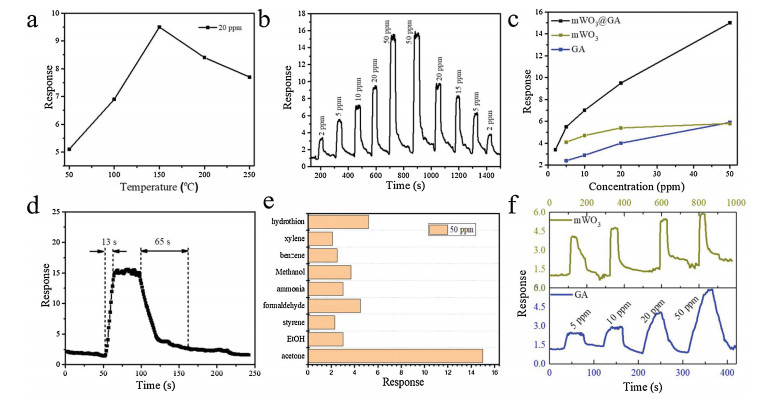
In order to screen the optimum operating temperature, the mWO3@GA-based sensors toward 20 ppm acetone were investi-gated at different temperatures (Fig. 5a). It could be seen that the sensing response increases continuously with the increase of operating temperature from 50 ℃ to 150 ℃, due to the activation of adsorbed molecular oxygen and lattice oxygen to form active O—O— and O2-, however further increase of working temperature up to 150 ℃ leads to a decline of the sensor response owing to the desorption of adsorbed gas at high temperature [10, 46]. The maximum gas response of the mWO3@GA sensor for 20 ppm is about 9.7 at 150 ℃, therefore, the temperature of 150 ℃ was identified as the optimum working temperature for further evaluation of the sensing performance for acetone and other gases. Fig. 5b depicts the representative dynamic gas responses of mWO3@GA sample to acetone with concentrations in range of 2 ppm to 50 ppm at 150 ℃. The response of the gas sensor undergoes a drastic rise upon injection of acetone gas and a rapid decline to its initial value when exposed to air. When the acetone concentration varies from 50 ppm to 2 ppm, the response of the mWO3@GA sample could also be recovered to its original state, reflecting a good reversibility and stability of the gas sensor. As shown in Fig. 5c, the response of the mWO3@GA sensor almost linearly increases with the rise of acetone concentration from 2 ppm to 50 ppm. However, both samples of pure GA monolith and mesoporous WO3 show lower responses toward acetone at 150 ℃ than the mWO3@GA, further proving the synergistic effect of mesoporous WO3 and GA through the interface-induced co-assembly strategy. From Fig. 5d, it can be observed that the response time and recovery time of the mWO3@GA sensor are 13 s and 120 s to 50 ppm acetone at 150 ℃, respectively. Notably, TG analysis reveals that the mWO3@GA sample is stable below 400 ℃ in air (Fig. S7), thus the sensor remains stable at the operating temperature of 150 ℃ with promising response and recovery performance. The selectivity of a gas sensor is also an important factor for practical application. The responses of mWO3@GA sensor to different types of interfering gas sources (such as ethanol, styrene, formaldehyde, ammonia, methanol, benzene, xylene and hydrogen sulfide) were compared with that to the constant acetone of 50 ppm at 150 ℃ (Fig. 5e). Obviously, the response to acetone is at least three times higher than those to other interfering gases, showing that the mWO3@GA sensor has an excellent selectivity to acetone.

|
Download:
|
| Fig. 5. Responses (S = Ra/Rg) of the mWO3@GA nanocomposites-based sensor to 20 ppm acetone at different temperatures (a), response-recovery curve of the sensor to acetone at different concentrations (2–50 ppm) at 150 ℃ (b), response of the sensors vs. acetone concentrations (c), response-recovery curve of the mWO3@GA sensor to 50 ppm of acetone at 150 ℃ (d), responses of the sensor to different gases of 50 ppm at 150 ℃ (e), response-recovery curve of mesoprous WO3 and GA sensors to acetone at different concentrations (2–50 ppm) at 150 ℃ (f). | |
In general, gas sensing performance is closely dependent on the structure and composition of the sensor materials. In the mWO3@GA composites, the graphene aerogel constructed from two-dimensional rGO sheets acts as the conducting matrix for the mesoporous WO3-based sensor. The GA walls of rGO sheets not only support the mesoporous WO3 as substrate to prevent aggregation of mesoporous WO3, but also can boost the electron transfer efficiency and the electron transfer rate, thus the response of the devices can be greatly enhanced. Besides, the high specific surface area and the interconnected regular mesopores in mWO3@GA composites would be beneficial to the adsorption/ desorption of acetone molecules on their surface, improving the sensing response and recovery properties. Furthermore, the hybrid structure of mesoporous WO3 and rGO can synergistically offer many additional active sites (such as vacancies, oxygen functional groups and the sp2-bonded carbon) for enhanced adsorption of the target species of acetone due to the complex physical and chemical interactions between WO3 and rGO. A p-n heterojunction would be formed at the interfaces between n-type mWO3 and p-type rGO, which is also considered to be beneficial for gas sensing according to previous reports [47]. Herein, in comparison, mesoporous WO3 and GA were employed as sensors for detection of acetone as shown in Fig. 5f, and both of the sensors are inferior to the mWO3@GA in terms of sensitivity and respond/recovery time. In particular, mesoporous WO3 is difficult to achieve the adsorption-desorption equilibrium due to the low operating temperatures of 150 ℃, resulting in baseline fluctuations.
In summary, we demonstrated a facile interface-induced co-assembly strategy for the synthesis of mesoporous WO3@graphene aerogel (mWO3@GA) nanocomposites, which consist of macro-porous graphene aerogel (GA) as the substrate and mesoporous WO3 as the top layer on both sides of reduced graphene oxide (rGO) sheets. The obtained mWO3@GA nanocomposites show the well-developed macroporous structure with the skeleton of rGO sheets decorated by uniform mesoporous WO3 layer, which present highly crystallized framework of ultrafine WO3 nanoparticles, large pore size of 19 nm, high surface area and pore volume of 167 m2/g and 0.26 cm3/g, respectively. When constructed as a gas sensor, the mWO3@GA material exhibits a promising acetone sensing perfor-mance with a good response (13 s) and recovery (120 s), a high sensitivity, an excellent selectivity toward other gases and stability, much better than mesoporous WO3 and graphene aerogel, mainly due to the formation of p-n heterojunction at the interfaces between n-type WO3 and p-type rGO and their synergistic effects. The mWO3@GA-based gas sensor would hold a great potential for application in diverse fields such as breath analysis and detection of VOCs in air.
AcknowledgmentsThis work was supported by the National Natural Science Foundation of China (Nos. 51822202, 51772050, 51432004 and 51774096), Shanghai Rising-Star Program (No. 18QA1400100), Youth Top-notch Talent Support Program of Shanghai, the Innovation Program of Shanghai Municipal Education Commission (No. 2017-01-07-00-03-E00025), Shanghai Sailing Program (No.17YF1400400), DHU Distinguished Young Professor Program and Fundamental Research Funds for the Central Universities.
Appendix A. Supplementary dataSupplementary material related to this article can be found, in the online version, at doi:https://doi.org/10.1016/j.cclet.2019.05.006.
| [1] |
S.J. Kim, S.J. Choi, J.S. Jang, et al., Acc. Chem. Res. 50 (2017) 1587-1596. DOI:10.1021/acs.accounts.7b00047 |
| [2] |
Y. Zhao, Z.X. Low, S. Feng, et al., Nanoscale 9 (2017) 5433-5444. DOI:10.1039/C6NR09779K |
| [3] |
V.K. Tomer, S. Duhan, J. Mater. Chem. A 4 (2016) 1033-1043. DOI:10.1039/C5TA08336B |
| [4] |
E. Singh, M. Meyyappan, H.S. Nalwa, ACS Appl. Mater. Interfaces 9 (2017) 34544-34586. DOI:10.1021/acsami.7b07063 |
| [5] |
N. Barsan, D. Koziej, U. Weimar, Sens. Actuators B:Chem. 121 (2007) 18-35. DOI:10.1016/j.snb.2006.09.047 |
| [6] |
M.H. Sun, S.Z. Huang, L.H. Chen, et al., Chem. Soc. Rev. 45 (2016) 3479-3563. DOI:10.1039/C6CS00135A |
| [7] |
H. Feng, C. Li, T. Li, et al., Sens. Actuators B:Chem. 243 (2017) 704-714. DOI:10.1016/j.snb.2016.12.043 |
| [8] |
W.T. Koo, S.J. Choi, S.J. Kim, et al., J. Am. Chem. Soc. 138 (2016) 13431-13437. DOI:10.1021/jacs.6b09167 |
| [9] |
J. Li, X. Liu, J. Cui, et al., ACS Appl. Mater. Interfaces 7 (2015) 10108-10114. DOI:10.1021/am508121p |
| [10] |
X. Zhou, Y. Zhu, W. Luo, et al., J. Mater. Chem. A 4 (2016) 15064-15071. DOI:10.1039/C6TA05687C |
| [11] |
X. Xiao, L. Liu, J. Ma, et al., ACS Appl. Mater. Interfaces 10 (2018) 1871-1880. DOI:10.1021/acsami.7b18830 |
| [12] |
C. Li, N.S. Colella, J.J. Watkins, ACS Appl. Mater. Interfaces 7 (2015) 13180-13188. DOI:10.1021/acsami.5b03240 |
| [13] |
Y. Li, W. Luo, N. Qin, et al., Angew. Chem. Int. Ed. 53 (2014) 9035-9040. DOI:10.1002/anie.201403817 |
| [14] |
Y. Zhu, Y. Zhao, J. Ma, et al., J. Am. Chem. Soc. 139 (2017) 10365-10373. DOI:10.1021/jacs.7b04221 |
| [15] |
J.H. Ma, Y. Ren, X.R. Zhou, et al., Adv. Funct. Mater. 28 (2018) 1705268. DOI:10.1002/adfm.201705268 |
| [16] |
S. Cong, F. Geng, Z. Zhao, Adv. Mater. 28 (2016) 10518-10528. DOI:10.1002/adma.201601109 |
| [17] |
Z.F. Huang, J. Song, L. Pan, et al., Adv. Mater. 27 (2015) 5309-5327. DOI:10.1002/adma.201501217 |
| [18] |
D.R. Miller, S.A. Akbar, P.A. Morris, Sens. Actuators B:Chem. 204 (2014) 250-272. DOI:10.1016/j.snb.2014.07.074 |
| [19] |
D. Sun, Y. Luo, M. Debliquy, C. Zhang, Beilstein J. Nanotechnol. 9 (2018) 2832-2844. DOI:10.3762/bjnano.9.264 |
| [20] |
Y. Xia, R. Li, R. Chen, et al., Sensors 18 (2018) 1456. DOI:10.3390/s18051456 |
| [21] |
B. Zhang, R.W. Fu, M.Q. Zhang, et al., Sens. Actuators B:Chem. 109 (2005) 323-328. DOI:10.1016/j.snb.2004.12.066 |
| [22] |
Y. Tang, Z. Zhao, H. Hu, et al., ACS Appl. Mater. Interfaces 7 (2015) 27432-27439. DOI:10.1021/acsami.5b09314 |
| [23] |
K.S. Novoselov, A.K. Geim, S.V. Morozov, et al., Science 306 (2004) 666-669. DOI:10.1126/science.1102896 |
| [24] |
Y. Xu, G. Shi, X. Duan, Acc. Chem. Res. 48 (2015) 1666-1675. DOI:10.1021/acs.accounts.5b00117 |
| [25] |
K. Chen, S. Song, F. Liu, et al., Chem. Soc. Rev. 44 (2015) 6230-6257. DOI:10.1039/C5CS00147A |
| [26] |
J. Zhang, X. Liu, G. Neri, et al., Adv. Mater. 28 (2016) 795-831. DOI:10.1002/adma.201503825 |
| [27] |
F. Perreault, A. Fonseca de Faria, M. Elimelech, Chem. Soc. Rev. 44 (2015) 5861-5896. DOI:10.1039/C5CS00021A |
| [28] |
W.J. Yuan, G.Q. J. Shi, Mater. Chem. A 1 (2013) 10078-10091. DOI:10.1039/c3ta11774j |
| [29] |
S. Mao, S. Cui, G. Lu, et al., J. Mater. Chem. 22 (2012) 11009-11013. DOI:10.1039/c2jm30378g |
| [30] |
J. Kaur, K. Anand, N. Kohli, et al., Chem. Phys. Lett. 701 (2018) 115-125. DOI:10.1016/j.cplett.2018.04.049 |
| [31] |
J. Yang, C. Yu, C. Hu, et al., Adv. Funct. Mater. 28 (2018) 1803272. DOI:10.1002/adfm.201803272 |
| [32] |
S. Srivastava, K. Jain, V.N. Singh, et al., Nanotechnology 23 (2012) 205501. DOI:10.1088/0957-4484/23/20/205501 |
| [33] |
J. Qin, M. Cao, N. Li, et al., J. Mater. Chem. 21 (2011) 17167-17174. DOI:10.1039/c1jm12692j |
| [34] |
W.S. Hummers, R.E. Offeman, J. Am. Chem. Soc. 80 (1958) 1339. DOI:10.1021/ja01539a017 |
| [35] |
Y.H. Deng, T. Yu, Y. Wan, et al., J. Am. Chem. Soc. 129 (2007) 1690-1697. DOI:10.1021/ja067379v |
| [36] |
X. Yuxi, S. Kaixuan, L. Chun, et al., ACS Nano 4 (2010) 4324-4330. DOI:10.1021/nn101187z |
| [37] |
Z.M. Wang, W. Wendong, C. Neil, et al., ACS Nano 4 (2013) 7437-7450. |
| [38] |
C. Li, G. Shi, Adv. Mater. 26 (2014) 3992-4012. DOI:10.1002/adma.201306104 |
| [39] |
B.A. De Angelis, M. Schiavello, J. Solid State Chem. 21 (1977) 67-72. DOI:10.1016/0022-4596(77)90145-1 |
| [40] |
S.C. Moulzolf, S.A. Ding, R.J. Lad, Sens. Actuators B:Chem. 77 (2001) 375-382. DOI:10.1016/S0925-4005(01)00757-2 |
| [41] |
W. Zhu, F. Sun, R. Goei, et al., Appl. Catal. B:Environ. 207 (2017) 93-102. DOI:10.1016/j.apcatb.2017.02.012 |
| [42] |
A. Lewera, L. Timperman, A. Roguska, et al., J. Phys. Chem. C 115 (2011) 20153-20159. DOI:10.1021/jp2068446 |
| [43] |
H. Aono, E. Traversa, M. Sakamoto, et al., Sens. Actuators B:Chem. 94 (2003) 132-139. DOI:10.1016/S0925-4005(03)00328-9 |
| [44] |
S. Stankovich, D.A. Dikin, R.D. Piner, et al., Carbon 45 (2007) 1558-1565. DOI:10.1016/j.carbon.2007.02.034 |
| [45] |
Q. Feng, X. Li, J. Wang, Sens. Actuators B:Chem. 243 (2017) 1115-1126. DOI:10.1016/j.snb.2016.12.075 |
| [46] |
Y. Zhang, J. Xu, Q. Xiang, et al., J. Phys. Chem. C 113 (2009) 3430-3435. DOI:10.1021/jp8092258 |
| [47] |
J. Zhang, H. Lu, C. Yan, et al., Sens. Actuators B:Chem. 264 (2018) 128-138. DOI:10.1016/j.snb.2018.02.026 |