 2019, Vol. 30


Melamine is an important organic chemical material that is used as the raw material for producing melamine-formaldehyde resin, which is widely used in coatings, plastics, leather and textile industries [1]. Due to its low cost and high nitrogen content (66.7% by mass), melamine is illegally added to milk or dairy products by unscrupulous manufacturers to reduce costs and increase protein content measured by the Kjeldahl method in its products [2, 3]. Although melamine is a low toxic substance, long-term intake can damage the kidney or even cause death [4, 5]. To ensure human health and food safety, many countries and organizations have proposed a limit standard of melamine in food. Both the Codex Alimentarius Commission (CAC) and the US Food and Drug Administration (FDA) have set a maximum melamine level of 1.0 mg/L for infant formula and of 2.5 mg/L for other foods and animal feeds [6, 7]. Currently, various methods including enzymelinked immunosorbent assay (ELISA) [8, 9], high performance liquid chromatography (HPLC) [10], gas chromatography-mass spectrometry (GC–MS) [11], electrochemical method [12] and colorimetry [13, 14] have been reported for the detection of melamine in food products. However, shortcomings such as complicated separation process, long detection time and high cost exist. Therefore, it is still necessary to develop simple, sensitive and efficient analysis methods for detecting melamine in food.
Surface enhanced Raman spectroscopy (SERS) has attracted great interest in recently years due to its high sensitivity and rapid non-destructive detection [15-17]. The SERS phenomenon can be observed in analytes adsorbed on the surface of crude noble metal particles (such as Ag, Au or Cu) [18, 19]. It is considered that the amplified SERS signal originates from long-range electromagnetic enhancement and short-range chemical enhancement [20-22]. Although SERS-based melamine detection has been reported, there still remain problems including unsatisfactory stability and activity of the SERS substrates, and the substrates are difficult to recycle [23, 24]. Therefore, it is important to fabricate SERS substrates with high sensitivity, good stability and rapid separation property for the detection of melamine. Recently, magnetic SERS substrates with rapid separation properties have been reported. However, in the coating or growth process of noble metal shells, magnetic attraction may leads to aggregation between particles and makes it difficult to obtain uniformly coated magnetic composite particles [25, 26]. The polymer shell, which can stabilize the magnetic particles, effectively avoids uncontrolled aggregation of magnetic particles, and provides nucleation sites for in-situ deposition of Ag or Au nanoparticles [27, 28]. Polyphosphazene (PZS) is a highly crosslinked polymer with excellent thermal stability and oxidation resistance. In addition, PZS is rich in P, N atoms and phenolic hydroxyl groups, making it easy for transition metal or metal oxide nanoparticles to deposit on the surface [29, 30]. Herein, in present work, novel magnetic polyphosphazene (MPZS) particles coated by Ag nanoparticles (MPZS-Ag) have been developed as surface enhanced Raman spectroscopy (SERS) substrates for sensitive detection of melamine in aqueous solutions and milk samples.
Magnetic Fe3O4 nanoparticles were prepared using solvothermal method as reported [31]. Fig. 1A shows typical SEM image of the prepared Fe3O4 nanoparticles with an average diameter of 350 nm. The MPZS particles were prepared by precipitation polymerization in the presence of Fe3O4 nanoparticles. The preparation procedure of the MPZS-Ag particles is shown in Scheme S1 (Supporting information) and the details of experimentation are described in the experimental part of the Supporting information. In the initial stage of polymerization, the condensation polymerization of hexachlorocyclotriphosphazene (HCCP) and 4, 4-sulfonyldiphenol (BPS) generated primary nucleus particles. Then these primary nucleus particles coated on the surface of Fe3O4 nanoparticles and formed stable aggregates. Afterwards, the aggregates grew into MPZS particles with a coreshell structure by absorbing oligomer species in solution [32]. It can be clearly observed from Fig. 1B that the surface of the prepared particles are smooth, indicating that the magnetic composite particles have been prepared. The clear core-shell structure of MPZS particle observed from the TEM image in Fig. 1G also confirms that PZS was coated on the surface of the Fe3O4 nanoparticles and the PZS shell thickness is about 300 nm.

|
Download:
|
| Fig. 1. SEM images of (A) Fe3O4 nanoparticles, (B) MPZS and MPZS-Ag particles prepared with different number of times of silver deposition: (C) once, (D) twice, (E) thrice and (F) four times. TEM images of (G) MPZS particles. (H) MPZS-Ag particles. (I) Photograph of the MPZS-Ag particles in ethanol separated by a magnet. | |
The zeta potential of the MPZS particles is -40±3.99 mV (Fig. S1 in Supporting information), which provides nucleation sites for aggregation of positively charged Ag+ and is favorable for the in-situ deposition of Ag nanoparticles [28, 30]. Ag nanoparticles were rapidly deposited on the surface of the MPZS particles by in-situ reduction of silver nitrate in the presence of absolute ethanol and n-butylamine. In order to prevent the formation of free Ag nanoparticles without loading on the surface of the MPZS particles and make Ag nanoparticles more uniformly coated on the surface of the MPZS particles, multiple deposition strategy of Ag nanoparticles was adopted with low concentration of silver nitrate in ethanol solution. The SEM images in Figs. 1C-F show the MPZS-Ag particles fabricated with different count of Ag nanoparticles deposition. According to the images, the density of the Ag shell and the size of Ag nanoparticles on the surface increased as the number of deposition count increased. Compared with the clear core-shell structure of the MPZS by TEM image in Fig. 1G, the core-shell structure of the MPZS-Ag particles is difficult to be observed in Fig. 1H by TEM image, because the transmission electron microscopy is difficult to penetrate the Ag nanoparticle shell deposited on the surface of the MPZS-Ag particles. However, the rough morphology of Ag nanoparticle shell was obviously observed, verifying that the silver nanoparticles are successfully coated on the surface of the MPZS particles.
The MPZS-Ag particles were also characterized by XRD and TGA (Fig. S2 in Supporting information).The characteristic XRD peaks of Fe3O4 and Ag appear in the XRD pattern of the MPZS-Ag particles, which confirmed the existence of Fe3O4 core and indicated that Ag nanoparticles were completely coated on the particles. The silver amount in the MPZS-Ag particles was calculated to be about 24% in weight by the TGA results in Fig. S2B. Moreover, as shown in Fig. 1I, the MPZS-Ag particles can be separated by a magnet in 90 s and redispersed after the magnet is removed, suggesting good magnetic responsiveness and dispersibility of the MPZS-Ag particles.
DTNB was used as model analyte to investigate the effect of the amount of Ag deposited on the SERS activity of the MPZS-Ag particles. The SERS spectra of 10-5 mol/L DTNB measured on the MPZS-Ag particles fabricated with different deposition count of Ag deposition are shown in Fig. 2A. It is observed that the intensity of the characteristic peak is obviously enhanced with the number of deposition times increased. As the amount and denseness of Ag nanoparticles on the surface of the MPZS particles increased, the distance between the Ag nanoparticles became closer, which promoted the plasma coupling of Ag nanoparticles and the formation of hot spots, thus strongly enhanced the Raman signal. When deposition of Ag nanoparticle was over three times, the Raman intensity of DTNB increased slightly. Therefore, the MPZS-Ag particles fabricated with three times of Ag deposition were used as SERS substrates for the further experiments.

|
Download:
|
| Fig. 2. (A) SERS spectra of 10-5 mol/L DTNB by the MPZS-Ag particles with different Ag deposition times: (Ⅰ) The MPZS particles without Ag deposition, (Ⅱ) once, (Ⅲ) twice, (Ⅳ) thrice, (Ⅴ) four times. (B) SERS spectra of DTNB at different concentrations by the MPZS-Ag particles. (C) SERS spectra of different concentration of melamine in aqueous solution by the MPZS-Ag particles. (D) Fitting curve of the dependence of Raman intensities at 703 cm-1 on the logarithm concentrations of melamine. | |
In order to investigate the sensitivity and SERS activity of the MPZS-Ag particles as SERS substrates, various concentrations of DTNB (range in 10-5 mol/L to 10-10 mol/L) were incubated with the MPZS-Ag particles and SERS detections were carried out. The SERS spectra of various concentrations of DTNB enhanced by the MPZSAg particles are shown in Fig. 2B. It is clear that the basement SERS signal of the MPZS-Ag particles was negligible and it did not interfere with the determination of the DTNB, even at a very low concentration. The limit of detection (LOD) of DTNB measured by the MPZS-Ag particles was as low as 10-10 mol/L. These results implied the MPZS-Ag particles possesses excellent SERS activity and sensitivity for SERS detection.
For the quantitative detection of melamine in aqueous solutions and real milk samples by the MPZS-Ag particles, the average SERS spectra of each sample were collected by testing five different spots of the detected samples. SERS detection of different concentration (range in 10-3 mol/L to 10-7 mol/L) of melamine in aqueous solutions by the MPZS-Ag particles was performed. As shown in Fig. 2C, the strongest SERS peak at 703 cm-1 is attributed to the in-plane deformation of the triazine ring, and assigned to the ring-breathing Ⅱ mode [33].The Raman intensity of melamine increased with the increase of concentration. When the concentration of melamine is as low as 10-7 mol/L (0.0126 mg/L), the Raman peak at 703 cm-1 was still detected observably. Thus the Raman shift at 703 cm-1 was selected for the quantitative determination of melamine. An excellent linear correlation was obtained between the logarithmic concentration of melamine and the Raman intensity at 703 cm-1. The correlation coefficient R2 was as high as 0.9967, as shown in Fig. 2D. It indicated that the MPZS-Ag particles are feasible for accurately quantitative analysis of melamine in aqueous solution.
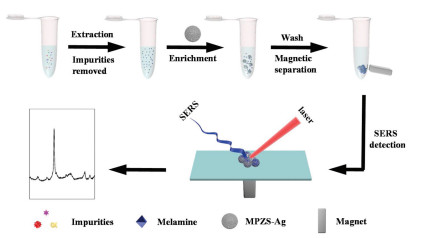
For practical application, SERS detection of melamine in real milk samples by the MPZS-Ag particles as substrates were performed. Milk is a water-based fluid that contains a variety of components, including fats, carbohydrates, protein and minerals. Melamine is easily captured by the macromolecules in milk. In addition, melamine also tends to be adsorbed by other components in milk through affinity caused by hydrogen bonds [2, 23]. Therefore, milk samples with melamine have to be pretreated before SERS detection. Scheme 1 illustrates the SERS measurement procedure of melamine in spiked milk samples by the MPZS-Ag particles. Hydrochloric acid was used to precipitate proteins and extract melamine simultaneously from the milk samples, afterwards, the residual impurities were removed by centrifugation, the pH of the supernatant was adjusted at 7.0 by 0.1 mol/L NaOH, then the supernatant was incubated with MPZS-Ag particles and the obtained compound was ready for SERS measurement. Milk sample without melamine treated by the same method was served as a control.

|
Download:
|
| Scheme 1. Illustration of SERS detection of melamine in spiked milk sample by the MPZS-Ag particles. | |
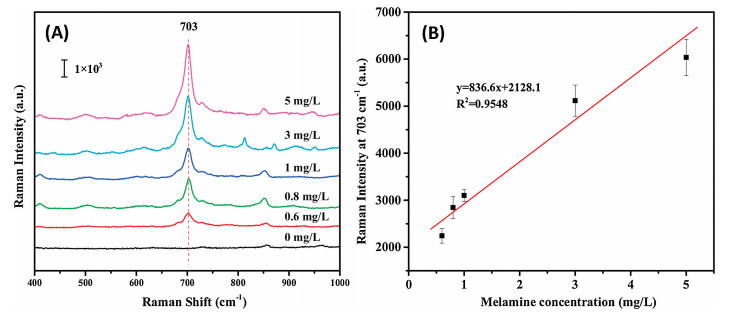
The quantitative determination results of melamine in real milk samples with different concentration are shown in Fig. 3. According to Fig. 3A, no SERS signal of melamine was detected in the control milk sample without melamine. Though some low impurity peaks appeared in the SERS spectrum of the measured real samples, which may derive from the residual impurities in milk, these were negligible and did not interfere the quantitative detection of melamine, because the characteristic peak of melamine at 703 cm-1 held absolutely dominant position. The Raman intensity at 703 cm-1 increased with the increase of melamine concentration in real milk samples. Fig. 3B is the calibration curve of different concentrations of melamine in spiked milk. A high linear relationship (R2 = 0.9548) was obtained between the melamine concentration and the Raman intensity at 703 cm-1, and the LOD of melamine detected by the MPZS-Ag particles in the real milk samples reached as low as 0.6 mg/L, which is lower than the safety values (1.0 mg/L) of Food and Drug Administration (FDA) and Codex Alimentarius Commission (CAC). In addition, as shown in Fig. S3 (Supporting information), an excellent correlation linear relationship (R2 = 0.9969) was also obtained between the Raman intensity and the logarithm concentration of melamine in real milk samples. The comparison of various reported SERS substrates with this work for SERS detection of melamine in milk samples is summarized in Table S1 (Supporting information). It is clear that the MPZS-Ag particles possess a higher sensitivity in melamine detection than other reported SERS substrates listed in Table S1. Furthermore, the recoveries of melamine in milk samples were calculated and the results are shown in Table S2 (Supporting information). The recoveries for melamine detection by the MPZS-Ag particles ranged from 91.0% to 97.5% with RSDs lower than 8.4%. The results indicate that the MPZS-Ag particles possessed promising application prospect for quantitative detection of melamine in milk.

|
Download:
|
| Fig. 3. (A) The SERS spectra of milk spiked with different concentration of melamine measured on the MPZS-Ag particles; (B) The Raman intensity at 703 cm-1 vs. melamine concentration in milk samples. | |
A novel SERS substrate, MPZS-Ag particles with high SERS sensitivity and excellent magnetic responsiveness was developed in this work. DTNB was used as model analyte to evaluate the SERS activity of the MPZS-Ag particles with a limit of detection of 10-10 mol/L. SERS quantitative determination of melamine in aqueous solutions and real milk samples by the MPZS-Ag particles were performed. The LOD of the melamine in aqueous solution was 10-7 mol/L (0.0126 mg/L) and the LOD in real milk samples was 0.6 mg/L, which is much lower than the safety values (1.0 mg/L) of the U.S. Food and Drug Administration (FDA) and Codex Alimentarius Commission (CAC). The as prepared MPZS-Ag particles have high SERS sensitivity and possess promising application prospect for SERS analysis in food safety fields.
AcknowledgmentsWe gratefully acknowledge the financial support of the National Natural Science Foundation of China (Nos. 51503040, 31771893), the Natural Science Foundation of Fujian Province, China (No. 2018J01766) and the Outstanding Youth Research Talent Cultivation Program of Universities in Fujian Province, China (No. 601936).
Appendix A. Supplementary dataSupplementary material related to this article can be found, inthe online version, at doi:https://doi.org/10.1016/j.cclet.2019.02.006.
| [1] |
A. Kim, S.J. Barcelo, R.S. Williams, Z.Y. Li, Anal. Chem. 84 (2012) 9303-9309. DOI:10.1021/ac302025q |
| [2] |
Z.Y. Xiong, X.W. Chen, P. Liou, M.S. Lin, Cellulose 24 (2017) 2801-2811. DOI:10.1007/s10570-017-1297-7 |
| [3] |
H.J. Zhuang, W.F. Zhu, Z.Y. Yao, M. Li, Y.L. Zhao, Talanta 153 (2016) 186-190. DOI:10.1016/j.talanta.2016.03.011 |
| [4] |
Y. Lu, Y.Q. Xia, G.Z. Liu, et al., Crit. Rev. Anal. Chem. 47 (2016) 51-66. |
| [5] |
A.K. Hau, T.H. Kwan, P.K. Li, J. Am. Soc. Nephrol. 20 (2009) 245-250. DOI:10.1681/ASN.2008101065 |
| [6] |
World Health Organization (2010), https://www.who.int/mediacentre/news/releases/2010/melamine_food_20100706/en/.
|
| [7] |
U.S. Food and Drug Administration (2008), http://wayback.archiveit.org/7993/20170404230622/https://www.fda.gov/Food/FoodborneIllnessContaminants/ChemicalContaminants/ucm164520.htm.
|
| [8] |
H.T. Lei, R. Su, S.A. Haughey, et al., Molecules 16 (2011) 5591-5603. DOI:10.3390/molecules16075591 |
| [9] |
Y. Zhou, C.Y. Li, Y.S. Li, et al., Food Chem. 135 (2012) 2681-2686. DOI:10.1016/j.foodchem.2012.07.053 |
| [10] |
M. Faraji, M. Adeli, Food Chem. 221 (2017) 139-146. DOI:10.1016/j.foodchem.2016.10.002 |
| [11] |
J. Li, H.Y. Qi, Y.P. Shi, J. Chromatogr. A 1216 (2009) 5467-5471. DOI:10.1016/j.chroma.2009.05.047 |
| [12] |
K. Rovina, S. Siddiquee, Food Control 59 (2016) 801-808. DOI:10.1016/j.foodcont.2015.07.009 |
| [13] |
G.X. Cao, X.M. Wu, Y.M. Dong, Z.J. Li, G.L. Wang, Microchim. Acta 183 (2016) 441-448. DOI:10.1007/s00604-015-1669-3 |
| [14] |
H.N. Guan, J. Yu, D.F. Chi, Food Control 32 (2013) 35-41. DOI:10.1016/j.foodcont.2012.11.041 |
| [15] |
L. You, A. Wang, L. Song, C. Huang, Q.Q. Zhang, Mater. Lett. 212 (2018) 65-68. DOI:10.1016/j.matlet.2017.10.069 |
| [16] |
H. Zhang, L. Sun, Y. Zhang, et al., Chin. Chem. Lett. 29 (2018) 981-984. DOI:10.1016/j.cclet.2017.10.017 |
| [17] |
S. Pang, T.X. Yang, L.L. He, Trac-Trend Anal. Chem. 85 (2016) 73-82. DOI:10.1016/j.trac.2016.06.017 |
| [18] |
M.D. Porter, J.H. Granger, Faraday Discuss. 205 (2017) 601. DOI:10.1039/C7FD00206H |
| [19] |
S. Abalde-Cela, P. Aldeanueva-Potel, C. Mateo-Mateo, et al., J. R. Soc. Interface 7 (2010) 435-450. |
| [20] |
S.Y. Ding, E.Y. You, Z.Q. Tian, M. Moskovits, Chem. Soc. Rev. 46 (2017) 4042-4076. DOI:10.1039/C7CS00238F |
| [21] |
S. Schlücker, Angew. Chem. Int. Ed. 53 (2014) 4756-4795. DOI:10.1002/anie.201205748 |
| [22] |
Z.Q. Duan, X.B. Gao, T.P. Li, K. Yao, X.M. Xie, Chin. Chem. Lett. 28 (2017) 521-524. DOI:10.1016/j.cclet.2016.11.031 |
| [23] |
A.M. Giovannozzi, F. Rolle, M. Sega, et al., Food Chem. 159 (2014) 250-256. DOI:10.1016/j.foodchem.2014.03.013 |
| [24] |
R.P. Li, G.H. Yang, J.L. Yang, et al., Food Control 68 (2016) 14-19. DOI:10.1016/j.foodcont.2016.03.009 |
| [25] |
L. You, C. Huang, F. Lu, et al., Int. J. Biol. Macromol. 107 (2018) 1620-1628. DOI:10.1016/j.ijbiomac.2017.10.025 |
| [26] |
B. Han, N. Choi, K.H. Kim, W.L. Dong, J. Choo, J. Phys. Chem. C 115 (2011) 6290-6296. DOI:10.1021/jp112265e |
| [27] |
C. Wang, R. Xiao, S. Wang, et al., J. Mater. Chem. C 3 (2015) 8684-8693. DOI:10.1039/C5TC01839K |
| [28] |
C.W. Wang, J.F. Wang, P. Li, et al., Nanoscale 8 (2016) 19816. DOI:10.1039/C6NR07295J |
| [29] |
Y. Hu, L.J. Meng, L.Y. Niu, Q.H. Lu, ACS Appl. Mater. Inter. 5 (2013) 4586-4591. DOI:10.1021/am400843d |
| [30] |
M.H. Wang, J.W. Fu, D.D. Huang, C. Zhang, Q. Xu, Nanoscale 5 (2013) 7913. DOI:10.1039/c3nr00010a |
| [31] |
J. Liu, Z.K. Sun, Y.H. Deng, et al., Angew. Chem. Int. Ed. 48 (2009) 5875-5879. DOI:10.1002/anie.200901566 |
| [32] |
X.Z. Wang, M.H. Wang, J.W. Fu, C. Zhang, Q. Xu, J. Nanopart. Res. 15 (2013) 1853. DOI:10.1007/s11051-013-1853-5 |
| [33] |
P.Y. Ma, F.H. Liang, Y. Sun, et al., Microchim. Acta 180 (2013) 1173-1180. DOI:10.1007/s00604-013-1059-7 |