 2019, Vol. 30


Bo Lu is currently a Ph.D candidate under the supervision of Prof. Dongpeng Yan at the College of Chemistry, Beijing Normal University (BNU). He studied at Tsinghua University High School from 2009 to 2012. He obtained his bachelor's degree in materials science and engineering from Beijing University of Chemical Technology (BUCT) in 2016. His research interests focus on the design, synthesis and application of crystalline functional materials;

Shuya Liu is currently a Ph.D candidate under thesupervision of Prof. Dongpeng Yan at the College of Chemistry, Beijing Normal University (BNU). She obtained her bachelor's degree in chemistry from Beijing Normal University (BNU) in 2018. Her research interests focus on crystalline phosphorescent materials;

Dongpeng Yan obtained his Ph.D at Beijing University of Chemical Technology (BUCT) in 2012, and then became an associate professor at BUCT. In 2014, he moved to Beijing Normal University (BNU) as a full professor. In 2011 and 2013, as a visiting student/scholar, he studied at the Department of Chemistry, University of Cambridge and School of Pharmacy, University College London. His research topics are functional molecular materials, host-guest chemistry and photo/electrocatalysis. He has received an Award Nomination of Annual Figure among Chinese University Students (2011), a "Talent Model" Award in the Universities in Beijing (2010), the Tang Aoqing Chemical Scholarship (2011), and an Outstanding Doctoral Dissertation Prize in Beijing (2013), among many others.
Crystalline polymorphism is a common and intriguing phenomenon that the presence of multiple packing and aggregate architectures of the same molecular system. McCrone defines a polymorph as 'a solid crystalline phase of a given compound resulting from the possibility of at least two different arrangements of the molecules of that compound in the solid state’ [1]. Although there are many controversy and different opinions about how to understand the polymorphism, the definitions of that from McCrone have stood the test of time and received recognition by most chemists today [2]. Many physical and chemical properties, including morphology, color, nonlinear optics, carrier mobility, magnetic susceptibility, solubility, reactivity, etc. for crystalline materials are strongly affected by the crystal packing. Thus, polymorphism provides the platform for effectively regulating properties of molecular materials and has important implications for our living and industrial fields, with diverse applications ranging from food chemistry, drug development to hydrogen storage, and optical modulator devices [3–5]. To date, manipulating the emergence of the desired polymorphic form in crystal growth is of vital importance for both comprehending the phenomenon of polymorphism and exploiting their practical applications. One of core issues for crystal engineering is to search for new polymorphs and it is still a scientific task of great challenge. Although the polymorphic structure prediction and simulation for small molecular crystals has achieved definite progress, it is universally acknowledged that the computationally predicting the number and the structures of polymorphs for the biological macromolecule, even some relatively small organic π-conjugated molecules with complex molecular architectures and systems, seems to be infeasible without the experimental aids from electron diffraction data or X-ray diffraction data at the present stage [6-15]. To date, the number of polymorphs for a compound is still proportional to the number of attempts and the amount of time spent on the study.
Molecular solid-state luminescent materials have been receiving more and more attention recently because of superior optoelectronic properties and widespread application in sensors [16, 17], lighting and display [18, 19], biomedical probes [20, 21], laser [22, 23] and so on. For the sake of continuously tuning luminescent properties and further promoting device performance, we need to figure out the structure features of these materials and then build the structure-activity relationship. It has been recognized that the bulk photoelectrical properties of lowmolecular-weight organic solid materials are regulated not only by intramolecular conformation of the single molecules, but also by their packing patterns and multiple intermolecular interactions in their aggregation state [24-26]. The researches on single luminescent molecules have achieved significant breakthrough from both theoretical and experimental aspects [27-30]. As for molecular aggregation, the influence of molecular packing on photophysical properties, such as emission wavelength and efficiency, is mainly dominated by long-range Coulombic intermolecular interactions, short-range intermolecular charge transfer, and vibronic coupling, which can mainly come down to two classical aggregation models: H-aggregates and J-aggregates [31-35]. From conventional Kasha model perspective, for H-aggregates with "side-by-side" transition dipoles, the Coulombic coupling is positive, leading to the dissipation of all the oscillator strength at the highest energy state. According to Kasha's rule, the fluorescence as radiative transition usually derived from the lowest excited state may be suppressed in this case. However, for J-aggregates with "head-to-tail" transition dipoles, Coulombic intermolecular interaction is negative and the oscillator strength is focused in the lowest energy exciton with no suppression of fluorescence [36-40]. Although conventional Kasha model have been utilized to analyze and interpret the basic photophysical behaviors for a number of molecular aggregates, like cyaninebased dyes, it still has limitations in the explanation on vibronic fine structure, spectral shift characteristics and so on. Because traditional Kasha model only took Coulomb coupling interactions into consideration, without charge transfer (CT) coupling or vibronic coupling. Gradually developing expanded theory of Hand J-molecular aggregates have exhibited more extensive applicability and can explain the unusual phenomena, for example, CT typed H-aggregate ("red-shifted H-aggregate") [41-43]. Therefore, aggregation types (H/J-aggregation) cannot be judged directly by spectral shifts alone.
Fortunately, the molecular crystalline polymorphs with definite molecular conformations and packing fashion can provide a visualized model to clarify the relationship between molecular arrangement/packing modes and their corresponding bulk optical properties in depth. Simultaneously, progressive optical testing and ascensive spectroscopy characterization as complementary tools can be used to interpret crystal structure and intermolecular interactions in return. In addition, relative to synthetic modification with sophisticated procedures and time-consuming purification, exploiting polymorphism exhibits strengths of atomeconomic, ease of operation and sometimes mild conditions, when achieving the aim of properties regulation.
The previous reviews in recent years about polymorphism from the groups of Nangia [44], Lee [45], Bučar [46], Cruz-Cabeza [47] and Steed [48] have mainly concentrated on the crystalline structures, preparation and screening methods as well as corresponding pharmaceutical properties, which helps pave a broad way for knowing and understanding of fundamental concepts, structural variation and their pharmaceutical applications. Moreover, the reviews about polymorphs of organic semiconductors from the groups of Hu [49] and Diao [50] have summarized and categorized design strategies and growth control means for a series of characteristic molecules with outstanding electronic properties and device performance, which further revealed the relationship between charge transport and polymorphic molecular packing. On account of the prosperity and development in the design and fabrication of both molecular solid-state luminescent systems and crystalline polymorph materials, incorporating the merits of the two materials will disclose structure-property relationship from both molecular and supramolecular levels and then further act as the roadmap in developing new type of materials and devices with superior performance. In this sense, our previous review supplies an initial respective on the construction of luminescent polymorphs [51]. During the last 5 years, it is delighted to see that the assembly of photofunctional polymorphic materials has been grown very fast; however, the summary about regulation of photo-related properties and potential applications for crystalline polymorphs is still scare. Therefore, it is necessary to review and summarize the progresses in this area, particularly in recent 5 years.
In this review, recent advances in feasible fabrication methods and luminescent applications of molecular polymorphic materials will be introduced in detail. The establishment of structure-activity relationship will be emphasized from the perspectives of both structural evolution and functional modulation throughout the review. First of all, various growing methods of crystalline polymorphs with examples are introduced. And then, we summarize the development and the applied value of photofunctional polymorphs in diverse related areas. Last but not least, development prospects and challenges ahead are discussed in brief.
2. Preparation 2.1. Solution methodMost organic molecules can dissolve in organic solvents over a range of temperatures and pressures. Among a variety of solutionrelated methods, the solvent evaporation method is the simplest and most effective one to grow single crystals, and most molecular crystals used for crystal structure analysis can be grown by this method [52]. Some burgeoning methods, like physical vapour transport, molecular beam epitaxy, etc., have certain restrictions on the selections and settings of many factors, such as the deposited substrate nature, the temperature gradient, flow rate of carrier gas. These preparation methods may be only suitable for a part of organic molecules, owing to molecular nature and practical limitation in the course of usage. In contrast to these novel methods, classic solution methods do not need large-scale expensive equipment or sophisticated operational procedures. It just requires low-cost glassware and various common solvents with heating-assisted or ultrasound-assisted dissolution processes, which can be affordable and employed for almost every lab. And then, solvent evaporation method or diffusion method can be adopted subsequently for the practical preparation of crystalline polymorphs, as shown in Fig. 1. Except for a small number of molecules limited by low solubility, a majority of reported singlecrystal structures for newly synthesized organic molecules have been obtained via solution methods, which indicating that solution methods remain a certain degree of universality, convenience and feasibility at current stage.

|
Download:
|
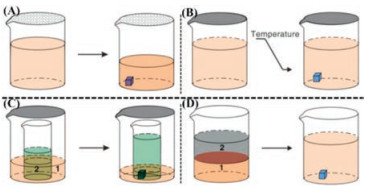
| Fig. 1. Schematic diagrams of solution-based methods for the growth of organic single crystals. (A) Solvent evaporation method. Molecules crystallize due to increased concentration resulted from solvent evaporation. (B) Slow cooling method. Molecules crystallize due to a decrease of solution solubility in low temperature. (C) Vapor diffusion method. Molecules crystallize because solvent 1 evaporates and diffuses into solvent 2, leading to an oversaturated solution. (D) Liquid-liquid diffusion method. Molecules crystallize because solvent 1 interdiffuses with solvent 2 and results in a decrease of solution solubility in solvent 2. Reproduced with permission [52]. Copyright 2013, Materials Research Society. | |
Sometimes, after X-ray single-crystal structural analysis, it could be found that solvent molecules located in the crystal lattice of organic luminescent molecules, forming the solvates [53, 54]. Solvates can comprise either a stoichiometric or a nonstoichiometric amount of solvent molecules in the crystal lattice. In the previous works, some solvates (the cocrystals of the organic fluorescent molecules and solvent molecules) were reported as the new polymorphs for the as-synthesized target fluorescent molecules [55-59]. Actually, it is possible to form solvates once the organic molecules are in contact with the solvent molecules during crystal growth processes of solution method. These solvent molecules usually had an important effect on the alteration of the molecular configuration, the molecular packing and consequent photophysical properties for chromophores. It is necessary to take solvent effects into consideration for these so-called 'new polymorphs' when comparing the differences between multiple polymorphs with or without solvent molecules in the lattice. Regardless of polymorphs or solvates, we will discuss two main solution methods for single crystal growth next.
2.1.1. Solvent evaporation method (varying solvents)As mentioned above, one of the most common methods for polymorph growth is to dissolve organic materials in various single-component solvent or multiple mixed solvents with the assistance of ultrasound and heating, and then volatilize the solvent slowly, as shown in Figs. 1A, B and 2. As the solvent evaporation or the decrease in temperature, the solution gradually changes from unsaturated state into supersaturated state accompanied by nuclei precipitation. Different kinds of nuclei are formed and gradually grow into a variety of distinct polymorphs in multiple single or mixed solvents with varying properties, including solubility, polarity, dielectric constant and protic attributes, etc. [60]. It is difficult to predict the number of polymorphs and their corresponding photophysical properties before experiments, due to the fact that crystallization process is dominated by both thermodynamic and kinetic factors. Additionally, it is universally acknowledged that solvent evaporation method for the growth of polymorphic single crystals has long been a purely experimental game of trial-and-error [1, 51]. What we can do is to summarize parts of predecessors' works as the following examples for providing references. For example, Fu et al. [61] obtained three polymorphs (P1, P2 and P3) of 4-(2-{4-[2-(4-diphenylamino-phenyl)-vinyl]-phenyl}-vinyl)-benzonitrile (DOPVB) from various single or mixed organic solvents (methylbenzene, dichloromethane and the interfaces for mixture of nhexane and tetrahydrofuran). These three polymorphs exhibited green (P1), yellow (P2) and red (P3) fluorescent emissions, respectively. Among the three polymorphs, P1 and P2 presented amplified spontaneous emissions (ASE) characters with very low thresholds.

|
Download:
|
| Fig. 2. A schematic diagram of solvent evaporation methods for the growth of organic crystalline polymorphs in varying solvents. | |
In 2017, the polymorphs with different fluorescence properties and crystalline morphologies for a trialkylsilyl-group-substituted azaacene derivative, 1, 4, 9, 12-tetrakis((triisopropylsilyl)ethynyl) benzo [1,8]asindaceno[2, 3-b:6,7-b']diquinoxaline (TBIDQ) were cultivated from different solvents systems by Zhang and coworkers [62]. Form Ⅰ of polymorphs was generated from the ternary mixed solvent system of toluene/isopropanol/methanol. Form Ⅱ was grew from binary mixture of chloroform/methanol. Form Ⅲ was obtained from a single solvent of hexane.
In 2018, Lee and co-workers [63] prepared the polymorphs for 2-(phenothiazine-10-yl)-anthraquinone (PTZ-AQ) from different blend solvent systems (dichloromethane/methanol, dioxane/hexane). Several polymorphs exhibited tunable morphologies and photophysical properties, especially thermally activated delayed fluorescence (TADF) behaviors, which could be ascribed to the variable intermolecular interactions, overlap degree of the π-system and electronic distribution. It was reported that this work was the first example that TADF properties of one single compound could be systematically tuned via its aggregation state. Among five different aggregates they found, the red flake-like crystal (R-crystal) showed the best TADF performance with both a high photoluminescence (PL) quantum yield (ΦPL = 0.848) even in the red fluorescent emission region and a small energy splitting ∆EST (0.01 eV).
Tang and Hu's group [64] recently carried out research on the fluorescence visualization of polymorph formation and transformation processes based on (Z)-1-phenyl-2-(3-phenylquinoxalin-2 (1H)-ylidene)ethanone (PPQE). Three polymorphs (A, B and C) of PPQE with various fluorescence behaviors could be obtained and screened systematically from 16 distinct single or mixed solvent systems. The structural differences for three polymorphs were mainly reflected in molecular configuration and packing mode, which resulted in the varying photophysical properties. With two terminal rotatable phenyl groups, the differences in the molecular configuration and packing mode may be put down to the intramolecular twisting angles θ1, θ2 and θ3. Compared with minor discrepancies for θ1 and θ3 in three polymorphs, θ2 (N2-C7- C17-C18) showed the domination in the stability of the whole molecule. Crystal B displayed the highest stability accompanied by the torsion angle θ2 = -47.2° closest to theoretical angle (θ2 = -42°) after theoretical calculations of rotational energy barrier. Therefore, the kinetically stable crystals A and C could spontaneously transform into thermodynamically stable crystal B, which could be monitored by the in-situ fluorescence microscope. The transformed products could be further confirmed by characteristic peaks of Raman spectrum and XRD analysis.
In 2019, Yuan and Zhang et al. [65] obtained two polymorphs of anthracene (AN) and maleic anhydride (MA) Diels-Alder cycloaddition adduct (AN-MA), which respectively exhibited bright blue (A) and blue-white luminescence (B) under 312 nm UV light. Polymorph B was obtained by recrystallization in xylene after heated to 150 ℃ in an oil bath and then naturally cooled to room temperature (≈ 25 ℃). However, polymorph A was obtained by placing products in a refrigerator (4 ℃) after the completed reaction was cooled to room temperature (≈ 14 ℃). Both two polymorphs presented green room temperature phosphorescence (RTP) because of the existence of a carbonyl group and oxygen atoms with lone pairs. Relative to short phosphorescence lifetime of 0.92 s for polymorph A, polymorph B exhibited a longer room temperature phosphorescence lifetime of 1.58 s, due to its stronger π-π interactions by through-space conjugation among phenyl and anhydride moieties. At the same year [66], they synthesized an organic fluorophore composed of a twisted benzil in the middle with two planar carbazole moieties at both ends. Five needle-like or plate-like polymorphs (A–E) were cultivated by the evaporation method in dichloromethane (DCM) and tetrahydrofuran (THF), respectively. When the product was dissolved in DCM in high concentration, both polymorphs A and B could be obtained simultaneously; whereas polymorphs C and D could be obtained from their DCM solutions in sequence, as the concentration gradually decreased. Only polymorph E grew from THF solutions. Except polymorph B with both prompt fluorescence (PF) and thermally activated delayed fluorescence (TADF) emitting at around 560 nm, polymorphs A, C, D and E showed similar PF with maximum emission at around 486 nm. Compared with planar conformations in polymorph B, other polymorphs (A, C, D and E) with similarly more twisted conformations presented predominant RTP or simultaneous delayed fluorescence (DF) and RTP, which demonstrated slight variations in intermolecular interactions and conformations could tune distinct molecular vibrational energy levels and subsequent single and triplet-involved emissions.
2.1.2. Diffusion & interface growthThe essence of diffusion method or liquid-liquid interface growth method is the different solubility for the organic molecule in various solvents. First of all, the organic molecules are dissolved in a good solvent forming an unsaturated or just saturated solution. Afterwards, a poor solvent is added and diffused into the high-solubility solution of organic molecules, resulting in the conversion from unsaturated or saturated solution into the oversaturated solution. Whether the two solvents can form a mixed system or stratify vertically into two parts with an interface, it depends on the miscibility, the density of two solvents and the rate of addition for the poor solvent, as shown in Figs. 1C, D and 3A. For example, Wang et al. [67] prepared two polymorphs for salicylidene(4-dimethylamino)aniline (SADA) in the interfacial region between bottom CH2Cl2 solution and upper covered ethanol. Two kinds of thin plate-shaped 2D polymorphs with yellow and red emission, respectively, could be obtained in the interface region of two solvents as shown in Figs. 3B-G. It was reported that 2D oriented nucleation property and intermolecular noncovalent interaction characteristic gave rise to the twodimensional thin layered morphology. At the same year, they [68] obtained three polymorphs based on the 3-(10H-phenoxazin-10-yl)-9H-xanthen-9-one (3-PXZ-XO) molecule by diverse growth methods. It was reported that polymorph A could be prepared by the diffusion method, that covering equal amount of water on its THF solution at the temperature of 273 K (±3 K). Polymorph B could be grown by heating sublimation in vacuum or volatilization of its saturated THF solution at room temperature. In addition, polymorph C could be cultivated by using the mixed solvent system including THF and water at a volume ratio of 1:1. They presented polymorph-dependent TADF emission character.

|
Download:
|
| Fig. 3. (A) A schematic diagram of the interface diffusion method for the growth of organic crystalline polymorphs. (B–G) A reported example of organic polymorphs based on the interface diffusion growth methods: (B) Molecular structure of SADA and its CH2Cl2 solution covered with ethanol. (C) Small plate-like crystals on a quartz circular plate. (D) Large plate-like crystals on a quartz circular plate. (E) Microcrystals of two polymorphs under UV irradiation. (F) Very large diamondshaped crystals of two polymorphs under UV irradiation (G) Emission spectra of the two polymorphs at room temperature. Reproduced with permission [67]. Copyright 2016, American Chemical Society. | |
As another example, Li's group [69] obtained two polymorphs of 1, 1, 2, 2-tetrakis(4-methoxyphenyl)ethane (TMPE) by the diffusion method. The block-like polymorph with P21/c space group (named as Cp-form) was prepared by dropping methanol on the surface of its dichloromethane solution. However, the other prismlike polymorph with C2 space group (named as Cc-form) was obtained by diffusing methanol into its hexane/dichloromethane mixed solution. It was worth noting that two polymorphs present opposite mechanoluminescence (ML) behaviors owing to their different conformations of packing modes. Cc-form polymorph showed inactive ML properties, while Cp-form polymorph demonstrated ML behaviors with blue emission after grinding in the dark.
In 2019, CzDPS [9-90-(sulfonylbis(2, 1-phenylene))bis(9H-carbazole)] was synthesized by one step substitution reaction [70]. Two polymorphs with similar fluorescence spectra and different phosphorescence spectra and lifetimes could be obtained by the diffusion method. One polymorph in the monoclinic system with space group P21/n was grown by diffusing of cyclohexane into its dichloromethane solution, whereas the other polymorph in the orthorhombic system with space group P212121 was cultivated by diffusing of cyclohexane into its tetrahydrofuran solution. Due to the prominent properties of persistent room temperature luminescence for both crystalline state and powder state, CzDPS was expected to be applied in time-resolved luminescence imaging of fingerprints by only using a smart phone under a UV LED.
2.2. Magnetic field assistant growthIt has been found that the specific materials with fascinating properties could be obtained when applying an external field (such as temperature, pressure, electric) during their preparation, manufacturing and molding processes [71-75]. A series of experiments verified that a low magnetic field could effectively change photoelectrical properties related to excited states (such as photoluminescence, electroluminescence, and electrical-injection current) in organic semiconducting materials, resulting in magnetic-field effects (MFEs) [76]. With the exception of property regulation, there were few reports on polymorphs growth control and separation for organic semiconducting materials in the presence of an external magnetic field, which was still a scientific and technological challenge. Fortunately, the groups of Whitesides and Myerson firstly reported that organic crystalline polymorphs could be separated by the magnetic levitation (MagLev) technique, due to the difference in density of polymorphs [77].
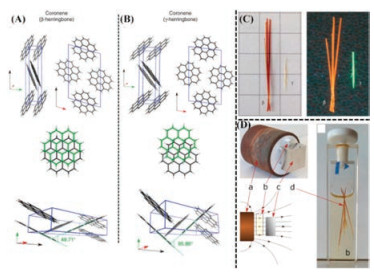
Recently, Hall's group [78] prepared a new polymorph (β- herringbone) of coronene under 1 T of magnetic field. It was reported that this was the first example of growing new polymorph in single crystals in the presence of an external magnetic field, as depicted in Fig. 4D. The mechanism of new polymorph formation that could be mainly attributed to the suppression of nucleation process under the application of magnetic field and the crystallization of the least stable polymorph. Due to the very high diamagnetic susceptibility (χ) of -243×10-6 emu/mol for coronene, the magnetic field strength of 1 T was close to the critical energetic value for the transformation between β-herringbone and γ-herringbone. From the structural perspective, they owned the same space group P21/n and similar molecular packing. However, the main structural differences lied in the nearest neighbour angle (49.71° for β-polymorph and 95.86° for γ-polymorph) and C–H…π hydrogen bond length (2.5 Å in γ-polymorph and 3.0 Å in β- polymorph), as shown in Figs. 4A and B, which demonstrated the metastability of the β-phase for coronene relative to the γ-phase. They showed up obviously different fluorescence colors (orange for β-polymorph and green for γ-polymorph, as shown in Fig. 4C) because of altered molecular packing and electronic behaviors. Compared with easy-obtained γ-herringbone, meta-stable β-herringbone polymorph exhibited wide-band absorbance, lower melting point (TM = 435.48 ± 0.01 ℃), enthalpy of fusion (20.78 kJ/mol) and smaller elastic modulus (E = 92 Gpa). Furthermore, they are enantiotropic polymorphs with the transition temperatures between 100 K and 150 K.

|
Download:
|
| Fig. 4. The difference of stacking structure and nearest neighboring angle for two polymorphs viewed along various directions (A for β-polymorph and B for γ-polymorph). (C) Optical images of the β- and γ-polymorphs of coronene in daylight and under ultraviolet (l =365 nm) illumination. (D) Optical images and schematic images of the experimental configuration for the growth of β-coronene. (a) the 1 T magnet; (b) the sample vial; (c) the magnetic holding plate and (d) crystals of β-coronene. Field lines from the 1 T magnet through the experiment are indicated. And Field strength was controlled by the application of paper shims (200 μm thickness) between the magnet and the sample vial). Reproduced with permission [78]. Copyright 2016, Nature Publishing group. | |
2.3. Sublimation & vapor deposition
Molecular solids in powder state could sublime into vapor phase when heated and then deposit into crystalline state at the cold end, which is the main process of physical vapor deposition for the growth of single crystal [79-82]. Organic semiconductor molecules could be deposited either from the vapor or solution phase, which mainly depends on their vapor pressure and solubility. In contrast to other method, the advantages of physical vapor transport (PVT) and deposition (PVD) method for organic single crystal growth include high purity, high quality with less defects, controllable size and diversity of deposited substrate selection [83-85]. Multiple polymorphs based on a same molecule with various molecular structures and morphologies could be obtained by regulating deposition conditions and relevant parameters, which leads to variant properties (including luminescence and carrier transport) and subsequent device performance [86-89], as depicted in Fig. 5. Therefore, it is necessary to make clear the process and mechanism of the polymorphism in PVT growth for the sake of optimizing the optoelectronic properties and device performance [90, 91].

|
Download:
|
| Fig. 5. Schematic view of the PVT experimental setup (the upper part) as well as the growth mechanism schematic representation (the middle part) and SEM images (the bottom part) of m-aminobenzoic acid helical nanobelt structures formation during PVT process as a concrete instance. Reproduced with permission [80]. Copyright 2007, American Chemical Society. Reproduced with permission [81]. Copyright 2010, WILEY VCH. Reproduced with permission [91]. Copyright 2014, American Chemical Society. | |
For instance, Ma et al. [92] gained two conformational polymorphs based on 1, 4-bis(1-cyano-2-phenylethenyl)benzene (CNDSB) by the physical vapor transport (PVT) methods. The powder for target molecule was placed near the heating source on one side in a quartz tube under the protection of argon along with the programmed temperature controlling system. After the temperature rising up to 248 ℃ for a few hours, CNDSB molecules migrated and deposited into two crystalline states on the inner wall of the tube at the other cold end regions. The two polymorphs could be identified and seperated by distinct fluorescent colors under UV lamp. The maximum emission wavelength for Form Ⅰ was located at 448 nm corresponding to blue fluorescence, whereas Form Ⅱ emitted green fluorescence with maximum emission wavelength at 491 nm. The tunable photophysical properties could be ascribed to their different molecular conformations and consequent molecular packings. In Form Ⅰ, the molecules adopted the more twisted conformation. The torsional angles between vinylene groups and their adjacent phenylene rings were 32.31° (Φ) and 25.41° (θ), respectively. On the contrary, the molecules in Form Ⅱ presented the more planar conformation with the small dihedral angles of Φ = 6.81° and θ = 4.01°. Different distortion degrees for molecular conformations further led to edge-to-face stacking with C–H…π interactions in Form Ⅰ and face-to-face arrangement with π-π interactions in Form Ⅰ. Moreover, Form Ⅰ could convert into Form Ⅱ by heating at 185 ℃ for 5 min. Apart from the observation of changes in fluorescence color, the phase transition could be confirmed by differential scanning calorimetry (DSC) and X-ray diffraction (XRD) analysis.
2.4. Post-synthesis methods (conversions induced by external physical perturbation and stimuli)Polymorphic phase transitions are involved in both the transition of molecular conformation at the molecular level and transformation of stacking arrangement at the supramolecular level, which supply a unique opportunity to study structural correlations and differences along with variation of physical and chemical properties based on the same molecular structures [93, 94]. These polymorphs experience the structural changes towards external stimuli, usually along with the alteration of physiochemical properties [95]. Sometimes, a new polymorph can be quickly obtained by single-crystal-to-single-crystal (SCSC) structural transformation under external perturbation, unlike tedious and long-drawn solvent evaporation process [96]. Therefore, polymorph conversion has a great impact not only on the knowledge of crystalline structure, but also on the practical device performance and reproducibility. We will discuss several common external stimuli factors (heat, solvent vapor and pressure) that induce polymorphic phase transition and then give corresponding representative examples.
2.4.1. HeatTemperature is a fundamental thermodynamic variable that plays a pivotal role in the synthesis of compounds, phase transition, and so on [97-99]. The temperature change inducing the alteration of atomic thermal vibration frequency and distances between atoms will provide energy to break old bonds and form new bonds. The process of polymorphic transformation was usually accompanied by the changes in heat (endothermic process or exothermic process). Specific supramolecular structures and weak intermolecular interactions can be destroyed and reassembled, inducing different molecular recognition modes, when the variation of ambient temperature. Therefore, obtaining new molecular polymorphic structures by heating process (or cooling process) is a feasible and easy way [100, 101]. Sometimes, heated products may not remain high crystalline state, thus, the singlecrystal structures for them could not be measured directly. The phase transition may occur at a very high temperature or a very low temperature, instead of the ambient temperature. It is necessary to verify the occurrence of phase transformation by the assistance from other multiple testing methods, including DSC, powder XRD, etc. [102, 103].
As an example, in 2015, Maini et al. [104] synthesized a series of 2, 3-thienoimide (N) based oligothiophenes (Cx-NT4N) with different length of alkyl-ended chain (even/odd). The thienoimide groups exhibited syn or anti conformation mainly depending on neighbouring thiophene ring. Such molecules usually adopt two possible conformational polymorphs, i.e., anti-anti-anti and synanti-syn, resulting in different molecular packing, namely phase A and phase B, respectively. The molecular conformation and packing type could be tuned by the length of terminal alkyl chain, because the formation of diverse intermolecular C–H…O hydrogen bonds between hydrogen atoms of the alkyl and oxygen atoms of the thienoimide and π-π stacking interactions. Even chain ended C4- and C6-NT4N displayed two polymorphic forms (phase A and phase B), which could occur phase transformation (conformation switch and stacking conversion) from A to B under heating and annealing treatment. The fluorescence emission peak exhibited hypochromatic shift from 670 nm to 600 nm. However, the odd chain ended C3- and C5-NT4N demonstrated syn-anti-syn conformation and B-type packing only without corresponding conformational changes after heating. Although the single-crystal structure for C6-NT4N form B was not obtained, the thermal annealing conversion from phase A to B could be confirmed by XRD analysis.
For another example, in 2016, Mei et al. [105] obtained several polymorphs, hydrates and amorphous state of emodin under diverse preparation conditions. Due to the varying degrees and distances of π-π interactions as well as the effect of water molecules in the crystal lattice on electron-transfer effects, they displayed different fluorescent emission. It was reported that the phase transformation between different polymorphs and hydrates could take place as the temperature rose gradually. Hemihydrate of emodin could experience the conversion into the red-emitting form Ⅱ at about 110 ℃ with the loss of water molecules. When the temperature increased further to 140 ℃, red-emitting form Ⅱ performed a conversion into yellow-emitting form Ⅰ. This was a process of heat-induced polymorphism transformation. Abovementioned transition processes were recorded by using hot-stage microscopy (HSM) pictures and corresponding products were confirmed by PXRD measurement.
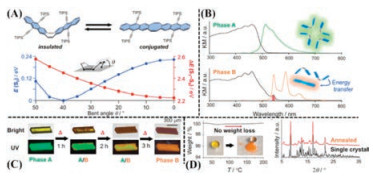
Besides, in 2018, Saito et al. [106] synthesized a new conformation-variable fluorophore, which was consisted of triisopropylsilyl(TIPS)ethynyl-substituted two anthracene moieties on a central cyclooctatetraene (COT) ring as shown in Fig. 6A. This molecule could aggregate and grow into two conformational polymorphs (phase A and B) from different solvent systems. The most important thing was that continuous heating induced the irreversible phase transformation from phase A into B on account of dynamic void collapse without evident weight loss. Powder XRD could confirm the consistency of annealed product and phase B, as depicted in Fig. 6D. Meanwhile, the fluorescence chromism could be observed simultaneously under UV irradiation from green emission to orange emission during the heating process, as shown in Figs. 6B and C. Phase A with large void space was obtained by wiping off the solvent molecules in the crystal lattice from precursor under vacuum. The molecule in phase A adopted the most stable V-shaped conformation with the bent angle θ ranging from 38° to 46° for the twisty central COT ring. By contrast, there were two main types of conformation in phase B, the planar one (θ = 13°-17°) and the V-shaped one (θ = 42°-49°) with the ratio of 1:2. In phase B, a planar conformational molecule were encircled by the molecules in V-shaped conformation, which may be regarded that a twisted V-shaped molecule was compressed into a planar conformer by the bulky TIPS substituents of ambient other unpressed twisted molecules, forming a 'sandwich' stacking. Compared to phase A, phase B presented a tighter molecular aggregation with higher density. The more planar conformation with smaller torsion angles would extend conjugate parts and facilitate π-electron delocalization in phase B. The red-shift of emission for the samples after heating and annealing treatment could mainly be attributed to the energy transfer between different conformers of the same molecules in phase B.

|
Download:
|
| Fig. 6. (A) Conformational flexibility of the flapping mechanophore bearing bulky silyl groups (the upper part); Calculated energy profile and electronic perturbation of the TIPS-ethynyl substituted mechanophore as a function of the COT bent angle θ (the bottom part). (B) Diffuse reflectance spectra using the Kubelka-Munk function (black) and FL spectra (green, orange) of the Phase A microcrystals (the upper part) and the Phase B microcrystals (the bottom part). (C) Microscopic observation of the crystal phase transition process on a hot stage at 180 ℃. Color change from Phase A into Phase B in bright-field images and FL chromism under UV irradiation. (D) Thermogravimetry of the Phase A microcrystals, scanning at the rate of 1 ℃/min (the left part); Powder XRD of the annealed Phase B microcrystals (red, room temperature) and simulated XRD pattern (black) of the Phase B crystal derived from a mixed Et2O/EtOH solvent system (the right part). Reproduced with permission [106]. Copyright 2018, American Chemical Society. | |
2.4.2. Solvent vapor
Solvent vapors could destroy weak intermolecular interactions and remodel the supramolecular stacking structure for some organic small molecules [107-110]. Zhang and Zou et al. [111] cultivated three polymorphs (BCrys, SCrys and YCrys) for a triphenylacrylonitrile derivative (TPAN-MeO) in different solvent systems under different temperatures conditions. The emission maximum values for three polymorphs (BCrys, SCrys and YCrys) were located at 458 nm (deep blue, PLQY = 67%), 474 nm (sky-blue, PLQY = 63%) and 539 nm (yellow, PLQY = 9%), respectively. The shift of emission wavelength for three polymorphs could be attributed to the differences in molecular conformations, which conduced to the variation in coplanar length and conjugation degree along the molecular long axis. Additionally, the disparate fluorescence quantum yield values could be ascribed to the different distortion degree between aspect α and acrylonitrile. The most remarkable phenomenon was the crystal-to-crystal transformation induced by the solvent vapor stimuli or heating process between polymorphs. The colorless crystals of SCrys turned into yellow under daylight along with the conversion of fluorescence spectra from sky-blue emitting into yellow emitting after exposure to CH2Cl2 vapor for one minute at room temperature. The fumed products (named f-YCrys) exhibited similar fluorescence spectra as YCrys. Furthermore, the fact that f-YCrys and YCrys belonged to the same phase could be verified by similar characteristic diffraction peaks of XRD patterns.
2.4.3. PressureSimilar to the temperature as a fundamental physical quantity, pressure is an important factor to determine the aggregation states and regulate the physicochemical properties for the molecular materials. Numerous mechanochromic fluorescence (MCF) materials have been studied based on their distinct emission properties and various molecular packing modes [112, 113]. Furthermore, the gradually evolving high-pressure experimental technologies create opportunities to generate new polymorphs and novel exotic materials with neoteric properties and functions not accessible at ambient conditions. For instance, Zhang et al. [114] found unexpected compounds based on two identical elements under high pressure, such as Na3Cl, Na2Cl, Na3Cl2, NaCl3, and NaCl7, lying in totally counterintuitive chemical regimes, which subverted our inertial perception of the most basic chemical substance NaCl. Through a series of in situ high-pressure characterizations for molecular-based optical functional materials, we can have a deeper understanding the relationship between stacking modes and their photophysical properties. However, one of the severe disadvantages for high-pressure materials is the metastability after releasing pressure, which may limit their development and utilization at ambient conditions, because they may not sustain their phase states and properties under high pressure when recovering to ambient pressure [115]. Despite this, the application of high-pressure science and technology to study the structures and properties of substances has gradually become one of the most cutting-edge research realms.
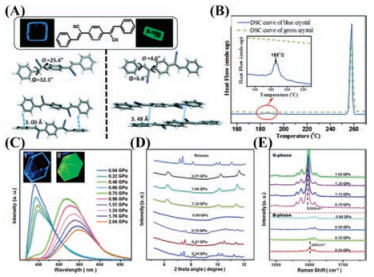
It was reported that 1, 4-bis(1-cyano-2-phenylethenyl)benzene (CNDSB) as a derivative of distyrylbenzene (DSB) exhibited aggregation-induced enhanced emission (AIEE) behaviors with high solid-state fluorescence efficiency [116-118]. Ma and Zou et al. [119] prepared two polymorphs (B-phase with blue fluorescence and Gphase with green fluorescence, as shown in Fig. 7A) for CNDSB by solvent diffusion method first. A small piece of crystal for B-phase was placed in a diamond anvil cell (DAC) with 0.5 mm diamond culets. Hydrostatic pressure was applied up to 2.04 GPa in a 16:3:1 mixture of methanol-ethanol-water as the pressure-transmitting medium. When the pressure reached around 0.75 Gpa, B-phase could undergophase transitionintoG-phase. Atthe critical pressure of phase transition, the emission peak switched suddenly from 445 nm into518 nm alongwith the increaseof emissionintensity, as shown in Fig. 7C. Through the analysis of in situ angle dispersive Xray diffraction (ADXRD) patterns, it could be found that a new crystalline phase formed above the critical pressure of fluorescence mutation with the disappearance of diffraction peaks for B-phase and appearance of new diffraction peaks, as depicted in Fig. 7D. In spiteof the similarfluorescence spectraforhigh-pressurephase and G-phase, there were some differences between the X-ray pattern of the high-pressure crystalline phase and that of the G-phase crystal obtained from the solution, which manifested that the highpressure crystalline phase was a metastable phase between Bphase and G-phase, named Gp-phase. Additionally, from in situ Raman spectra as shown in Fig. 7E, the observations that the strongest peak was red-shifted from 1601 cm-1 to 1593 cm-1 after the applied pressure over critical pressure of 0.75 GPa, indicated that the pressure induced molecular conformation transformation from the twisted one to a more planar one. After releasing the pressure to ambient pressure, the spectra reverted toinitial position and the characteristic diffractive peaks of B-phase reappearedin the ADXRD patterns, revealing the reversibility of pressure-induced phase transition.

|
Download:
|
| Fig. 7. (A) The fluorescent photographs under UV light (λ =365 nm), molecular conformations and intermolecular interactions for the CNDSB molecule in B-phase (the left part) and G-phase (the right part). (B) DSC curves (first heating) of B-phase and G-phase. Inset: DSC curves in the range of 150–230 ℃ are enlarged 20 times. (C) In-situ photoluminescence (PL) spectra for a piece of CNDSB crystal under increasing hydrostatic pressure starting from the B-phase. Inset images show the CNDSB crystal in a diamond anvil cell (DAC) excited by laser (λ =405 nm); (Ⅰ) at ambient pressure, (Ⅱ) at 0.75 GPa. (D) In-situ angle dispersive X-ray diffraction (ADXRD) patterns of the CNDSB crystal at varied hydrostatic pressures, starting from the B-phase. (E) In-situ Raman spectra in the range of 1500-1700 cm-1 of the CNDSB crystal at different pressures, starting from the B-phase. Reproduced with permission [119]. Copyright 2016, Royal Society of Chemistry. | |
As another example, in 2019, Xu and Zheng et al. [120] reported that diphenylfluorenone (DPFO) could experience polymorphic phase transition from the common α phase to the newly identified γ phase at around 3 GPa. They belonged to orthorhombic system with Ccm21 space group and triclinic system with P1 space group, respectively. As depicted in the in situ high-pressure UV–vis absorption spectra, the main absorption band generated bathochromic shift when increasing the pressure along with the color for crystalline sample converting from yellow to dark red. The emission peak also showed a large-scale red shift from 575 nm to 875 nm with the pressure added to 13.31 GPa. With the help of in situ high-pressure IR spectra and synchrotron X-ray diffraction (XRD) analysis, it could be determined that the occurrence of phase transition and the formation of the new γ phase, unlike α phase and β phase obtained by conventional solution methods. In this transformation process from α phase into γ phase, the volume of unit cell gradually shrank along with the planarization of molecular configurations, which facilitated the conversion of adjacent benzene rings from perpendicular stacking to parallel stacking and strengthened π-π interactions. This could be accounted for the bathochromic shift of UV–vis absorption and fluorescence spectra. Moreover, in situ IR and UV–vis absorption spectra restored to initial state, disclosing that the phase transition from α phase into γ phase was reversible.
3. Properties and application 3.1. Stimuli response & fluorescence sensorsRecently, a large range of stimuli-responsive fluorescent materials have been established for the detection of specific species in biological or environmental systems based on the analyte-induced modulation in photophysical and photochemistry properties of a fluorophore in sensors [121-123]. For fluorescence sensors with organic molecules as active materials, the performance of the sensors depends on both molecular structures and molecular-stacking arrangement in the solid state [124]. These photoactive molecules may sensitively experience the conversion of their molecular conformations and even the transition of their stacking patterns when under various stimuli factors or interacting with analytes, which induced striking modifications in their optical properties [125, 126]. The polymorphs for one fluorescent molecule usually demonstrated diverse response characteristics towards external stimuli.
For instance, Zhang's and Zou's groups prepared two polymorphs based on a boron diketonate complex [127]. Two polymorphs (1OC and 1RC) demonstrated distinct molecular conformations, which could be the crucial reason of their emissive wavelength shifting from orange (λem = 580 nm) to red (λem = 615 nm) regions. 1OC with initial orange emission presented fluorescence-chromic behaviors towards multiple stimuli, such as mechanical grinding, isotropic compressing, heating and acid fuming. After anisotropic grinding, 1OC displayed the bathochromic-shift for the emission peak from 580 nm to 610 nm, along with the conversion from well-ordered crystalline phase into amorphous phase. The fluorescence spectra and PXRD signal intensity for ground samples could only partially recover after fumed by CH2Cl2 vapor. Moreover, 1OC showed gradually red shift by about 75 nm under the increasing isotropic hydrostatic pressure till 7.8 GPa, corresponding to reduction of interatomic distances, molecular conformation alterations and ligand distortion. After releasing pressure, the emission spectra and the in situ Raman spectra recovered almost as before, and this confirmed that the compression was reversible. Besides, 1OC exhibited bathochromicshift from 580 nm to 610 nm when slowly heated to 150 ℃ and then showed hypochromatic shift to 520 nm with further increasing the temperature to 235 ℃, lower than its melting point. The phase transitions and molecular repacking took place in the temperature range of 130–150 ℃, which could be verified by new emerging XRD peaks over 150 ℃ and broad peaks of DSC curves at about 130 ℃. What's more, the emission peak for 1OC samples moved largely from 580 nm to 450 nm after being fumigated with volatile acid vapors (HCl or trifluoroacetic acid) and then reverted to its original state after a few minutes. These sensitive fluorescent responses endowed this polymorph with potential application in full-color luminescent smart sensors.
As described earlier in this review, Mei and co-workers found the potential applications of form Ⅰ for emodin (one of polymorphs) in optical recording and security ink materials, due to its mechanochromism and thermochromism under UV light [105]. Form Ⅰ with yellow fluorescent emission converted into orange emission powder with external continuous grinding forces. Mechanical effects broke long-range order stacking structure of form Ⅰ, which may attenuate intermolecular interactions and induced the formation of amorphous state, along with the bathochromic-shift of emission. Such fluorescent change could recover when heating the ground powder for some time, owing to recrystallization and rearrangement. Moreover, the yellow-emitting film prepared by dropping suspension of EM form Ⅰ on a piece of filter paper could be 'written' by a pestle. Written message presented orange emission relative to yellow emissive surrounding background. The orange written pattern could be 'erased' upon heating at about 135 ℃ for 10 min and reverted back to initial state. Such materials could respond to both thermal and mechanical stimulus, which resulted in the potential application of mechanosensors and security papers.
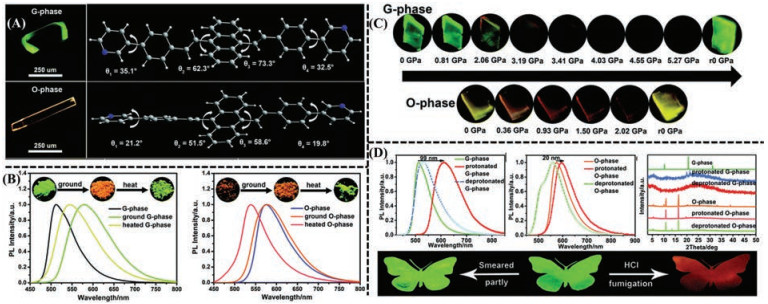
In 2019, Tian's and Xu's groups [128] reported the multi-stimuli sensitive properties based on two polymorphs (G-phase and Ophase) of 9, 10-bis-((E)-4-(pyridin-3-yl)styryl)anthracene (BP3SA) and the protonated BP3SA (C-HCl). In contrast to the relatively planar molecular conformations in O-phase, BP3SA in the G-phase presented a more distorted structure, as shown in Fig. 8A. Moreover, BP3SA molecules in G-phase aggregated along its b axis to form J-aggregate (χ = 39.51°) without π-π interactions. However, BP3SA molecules in O-phase stacked along its c axis to form H-aggregate (χ = 73.31°) with strong π-π stacking. The difference of molecular conformation and the shift for stacking mode from J-type to H-type aggregation induced variations of photophysical properties for two polymorphs. When it came to the stimuli of grinding and heating, they exhibited different responses, as shown in Fig. 8B. G-phase was red shifted from 511 nm to 579 nm after grinding, and it was then blue shifted to 544 nm after heating at 150 ℃ for 5 min. Nevertheless, the maximum emission peak for O-phase almost remained unchanged after grinding and shifted 575 nm to 538 nm when treated by heating. The mechanism of fluorescence transformation could be put down to the structural transition from different crystalline states to amorphous states after grinding. Furthermore, G-phase and O-phase showed gradual red-shifts under increasing hydrostatic pressure, as shown in Fig. 8C. The emission peak of G phase generated bathochromic shift from 511 nm to 660 nm along with the pressure rising from 0 to 5.27 GPa. With respect to the O-phase, its emission maximum converted from 575 nm to 641 nm when the pressure was applied gradually from 0 to 2.02 GPa. After releasing pressure, the emission spectra for O-phase restored to its initial state, while that for Gphase could not fully revert to its initial state, which could be largely ascribed to immobilization of molecular conformation and the restriction of molecular rotation from abundant intense C– H…N hydrogen bonds in G-phase. What more, the two polymorphic phases presented distinct fluorescent vapochromic features, as shown in Fig. 8D. Relative to slight variation from 575 to 595 nm for O-phase, G-phase could response more sensitively to HCl vapor along with the emission wavelength massively shifting from 511 nm to 610 nm. Afterwards, the spectra for both two acidified samples generated hypochromatic shift (530 nm for Gphase, 559 nm for O-phase) after fuming with diethylamine (DEA) vapor. In the case of the G-phase, the transformation from crystalline state into amorphous state could be verified by the disappearance of characteristic peaks and the emergence of a new broad peak from PXRD pattern, because of destruction and collapse of C–H…N hydrogen bonds by HCl vapor. It still remained amorphous state after treated by DEA vapor. On the contrary, the O-phase preserved crystalline structure under the protonation and deprotonation processes due to the absence of C–H…N hydrogen bond. Two polymorphs for BP3SA presented multiple stimuli responsive properties and potential applications in antiforgery and encryption ink.

|
Download:
|
| Fig. 8. (A) Fluorescent images and molecular conformation of G-phase (the upper row) and O-phase (the bottom row). (B) PL spectra and fluorescent images of G-phase (the left part) and O-phase (the right part) upon different treatments (ground and heat) with excitation at 365 nm. (C) Fluorescent images of G-phase (the upper row) and O-phase (the bottom row) under different applied hydrostatic pressure ('r0' represents 'release pressure to 0'). (D) PL spectra and PXRD patterns of the initial two crystalline phases and the treated one under the stimuli of HCl vapor and DEA vapor (the upper row); A butterfly patterns smeared partly and fumed by HCl vapor (the bottom row). Reproduced with permission [128]. Copyright 2019, Royal Society of Chemistry. | |
3.2. Amplified spontaneous emission (ASE) & laser application
Recently, molecular solid materials have received extensive attention in laser application [129-131]. In contrast to traditional inorganic crystalline materials as gain medium in solid state laser, organic crystals based on π-conjugated molecules have potential advantages of low cost, mild reaction conditions without high temperature and pressure, flexibility and diversity in molecular design as well as broad spectral coverage and tenability [132]. Organic solid-state laser crystals usually required the following properties: high luminescence efficiency, high crystallinity, suitable size and regular morphology, etc. [133, 134]. Organic polymorphs prepared by various methods demonstrate various shapes and photophysical properties, because of their varied molecular conformations, intermolecular interactions and packing patterns, which endow them potential opportunities to act as optical resonators for the realization of lasers with emission wavelength variability and tunable lasing thresholds [135, 136]. More and more studies about organic polymorphs as optical resonators and active gain material have been reported. In 2014, three polymorphs (A, B and C) and a solvate (D, CH2Cl2 in the crystal lattice) based on a π-conjugated chromophores ((4, 40- (thiazolo[5, 4-d]-thiazole-2, 5-diyl)bis(N, N-diphenylaniline)) were obtained under different growing conditions [137]. Slab-like form A with light-green emission was obtained by vacuum thermal sublimation method. Rhombic block-shaped form B was prepared by layering petroleum ether onto the dichloromethane (CH2Cl2)solution. Slow evaporation of the saturated CH2Cl2 solution at room temperature resulted in the formation of the rhombic block crystal form C with orange emission. The platelet-like crystal D with green-yellow emission was obtained from a dichloromethane/hexane solution. Form A and B had similar packing patterns but with different molecular configurations, while form B and C had different packing patterns but with similar molecular conformations. It was easy to establish the structureactivity relationship when a single structural change (either the molecular conformation or the packing pattern) was compared. Furthermore, form A showed favorable ASE behavior with the low threshold (9.5 kW/cm2) and the narrow full width at half maximum (FWHM = 6 nm) value for the emission spectrum, due to its suitable crystal shape and size, good molecular orientation, as well as high PLQY and radiative rate kr. Although form D presented ASE phenomenon when increasing the pump energy, its threshold value was very high, which was ascribed to two conformations and different orientation of molecules D1 and D2. However, ASE behavior could not be observed in form B and C, owing to their block shapes unconducive to light waveguide.
In 2016, two polymorphs for salicylidene(4-dimethylamino) aniline (SADA) as mentioned above were successfully obtained by interfacial diffusion growth method [67]. It was found that the red polymorph for SADA showed unusual size-dependent ASE behaviors. The crystal on the macroscopic scale of the red polymorph with side length of 1–2 mm displayed the ASE peak at 706 nm, whereas the microcrystals with sides that were 100 mm in length exhibited ASE maximum at 610 nm. The threshold values for macroscopic scale crystals and microcrystals of the red polymorph were 12.6 kW/cm2 and 26.4 kW/cm2, respectively. The different size crystals of the red polymorph belonged to the same phase, which could be confirmed by the same XRD patterns. This behavior could be ascribed to their discrepant self-absorption properties that the bigger sized crystals demonstrated red-shifted absorption band compared with the smaller ones. By contrast, the yellow polymorph for SADA with different sizes exhibited similar UV–vis absorption bands and identical ASE properties. The yellow polymorph displayed imperfect ASE characteristics that the base lines remained broad profile with gradually narrowed emission peak at certain excitation laser powers.
In 2016, Park and Gierschner et al. [138] studied the luminescence behavior and ASE properties for two polymorphs of a cyano-substituted distyrylbenzene derivative (CN-TFPA). Two polymorphs with respective blue and green fluorescent emission could be obtained by controlling solvent evaporation rates of the solvent (DCM). Due to the difference of intermolecular arrangement and exciton coupling, the two polymorphs presented distinct emission behaviors. Two polymorphs exhibited waveguide behavior both in the crystals and in the crystalline films, which was a prerequisite for ASE. Only the polymorph with blue fluorescent emission exhibited light amplification behavior at 455 nm with an apparent threshold of 100 μJ/cm2. However, the polymorph with green fluorescence could not generate any gain even at high excitation, due to pronounced π-π overlap forming H-type aggregation. This stacking mode may induce effective coupling of intermolecular breathing and/or shearing modes to the electronic transition, leading to the broadening of the photoinduced absorption (PA) band in the gain region with net gain on a time scale of 300 fs. This was not adequate to amplify the optical signal from waveguiding of the emitted light in such a short time.
Recently, Fu et al. [139] developed two polymorphs of difluoroboron avobenzone (BF2AVB) with tunable optical microresonator effects and laser behaviors, as shown in Fig. 9. The two polymorphs were prepared by cluster-mediated controlled selfassembly method, demonstrating J-type aggregation with blue emission and H-type aggregation with green emission, respectively. The formation of the two polymorphisms was dominated by nucleation process with different aging time after dispersing THF solution of BF2AVB into the mixed anti-solvents. Both two polymorphs presented Fabry-Perot (FP) mode features and remarkable lasing emission behaviors with proper lasing threshold Eth and high cavity Q values (Eth = 530 μJ/cm2, Q ≈ 985 for blue-emissive one and Eth = 1126 μJ/cm2, Q ≈ 923 for greenemissive one). These polymorph-dependent lasing behaviors suggested that two microribbon had potential applications in micro-resonators for lasing oscillators.

|
Download:
|
| Fig. 9. (A) Emission spectra of the aged mixtures at different aging times of t = 0, 3, and 30 min (the upper left part); Fluorescence microscopy images of BF2AVB MRs obtained from the mixture of two precursor solutions with t = 3 and 30 min (the upper right part); Schematic model of solution self-assembly for the formation of blue-emissive and green-emissive MRs for precursor solution with t = 3, 10, and 30 min, respectively (the bottom part). (B) Molecular packing arrangement of BF2AVB molecules in blue-emissive MRs (the upper part) and in green-emissive MRs (the bottom part), respectively. (C) Photoluminescence (PL) spectra of a single blue-emissive MR under different pump energies (the left part); Integrated area of the 0-1 PL peak as a function of pump density (the middle part); Mode spacing ∆λ at λ = 485 nm versus 1/L of blue-emissive MRs, clearly showing a linear relationship. Inset: simulated 2D normalized electric field (λ = 485 nm, n = 1.80) in the cross section of blue-emissive MR (the right part). (D) PL spectra of a single greenemissive MR under different pump energies (the left part); Integrated area of the 0- 1 PL peak as a function of pump density (the middle part); Mode spacing ∆λ at λ = 495 nm versus 1/L of green-emissive MRs, clearly showing a linear relationship. Inset: simulated 2D normalized electric field (λ = 495 nm, n = 1.80) in the cross section of green-emissive MR (the right part). Reproduced with permission [139]. Copyright 2018, American Chemical Society. | |
In 2019, Yin, Zhao and Shi et al. [140] obtained two polymorphs (TZ-1B and TZ-1C) based on a triphenylamine derivate by using different mixed solvents (dichloromethane/hexane for TZ-1B and dichloromethane/methanol for TZ-1C). Two polymorphs exhibited varied fluorescent properties and laser behaviors, owing to their different intermolecular interactions and molecular packing modes. TZ-1B emitted at 454 nm with a shoulder peak at 484 nm (PLQY = 39%, τ = 1.8 ns), whereas TZ-1C emitted at 464 nm and 484 nm (PLQY = 52%, τ = 3.2 ns). Both polymorphs acted optical resonators for laser behavior. TZ-1B presented a lasing emission at 454 nm with a low threshold value (Eth = 15.69 μJ/cm2) and a high cavity quality factor (Q =λ/∆λ = 2063). TZ-1C exhibits amplified spontaneous emission (ASE) at 462 nm. TZ-1C showed amplified spontaneous emission (ASE) at 462 nm with the FWHM at 462 nm gradually narrowing from 100 nm to 5 nm. TZ-1C could not be obtained a lasing mode probably because of the unsatisfactory shape and size.
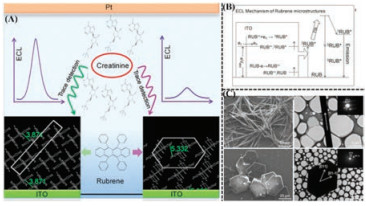
3.3. ECL sensors for detectionElectrochemiluminescence (ECL) is a luminescence process originating from the relaxation of excited species, which are generated by redox-induced electron transfer reaction at the electrodes [141, 142], as a schematic diagram for rubrene molecules shown in Fig. 10B. Due to the advantages of high sensitivity, wide linear range and low background signal, ECL technique has been widely reported in biosensors [143], detection [144-147], imaging [148] and so on. The self-assembly and aggregation behaviors for the organic solid materials modified on electrode surfaces have has a huge impact on the ECL properties (redox potentials, charge transfer and reaction rates, ECL signal intensity and stability, etc.) and optoelectronics applications. Based on polymorphic molecular aggregates as ECL materials, ECL signals and detection ranges can be regulated effectively, which promotes the comprehension of relationship between molecular stacking arrangement and ECL properties.

|
Download:
|
| Fig. 10. (A) ECL intensities comparison of triclinic Rub MWs (left parts) and monoclinic Rub HPs (right parts) when detecting creatinine; as well as molecular arrangement diagrams for Rub MWs (left parts) and monoclinic Rub HPs (right parts). (B) Schematic representation of possible ECL mechanism of these rubrene microstructures without the presence of coreactant. (C) SEM images, TEM images and SAED patterns for the 1D rubrene microwire (Rub MWs, the upper row) and the 2D hexagonal plate (Rub HPs, the bottom row). Reproduced with permission [149]. Copyright 2017, American Chemical Society. | |
In 2017, Gu and Zhao et al. [149] regulated the supersaturation (σ) of rubrene molecules in the mixing of good and poor solvents to prepare two polymorphs by the reprecipitation method. From the perspective of thermodynamic and kinetic processes, it could be found that the selection for polymorphic growth depended on the relative nucleation rate and the relative crystal growth rates. Under low supersaturation condition, relative nucleation rate took the superiority than relative growth rate, which would benefit the formation of triclinic nuclei, resulting in the ultimate morphology of 1D wire-shaped microstructures (called Rub MWs). The length orientation of 1D microstructures was along the [2 0 1] direction. However, under high supersaturation condition, the effect of high supersaturation facilitated the formation of monoclinic nuclei with the final shape of 2D hexagonal plate (called Rub HPs), as shown in Fig. 10C. The preferred orientation for 2D hexagonal plate was along the [0 1 1] and [0 1 1] directions. The monoclinic plates demonstrated higher PLQY of 23.4% and longer excited state lifetimes of τav = 3.61 ns, whereas the triclinic microwires presented the PLQYof 14.5% and excited state lifetimes of τav = 2.62 ns, which could be ascribed to the stronger intermolecular π-π packing of triclinic microwires than that of monoclinic plates. The observation results with electrochemical impedance spectra (EIS) showed that monoclinic Rub HPs/ITO electrode had larger chargetransfer resistances and solid-state interface layer than triclinic Rub MWs/ITO electrode, illustrating the faster charge transfer for triclinic Rub MWs/ITO electrode than monoclinic Rub HPs/ITO. The difference of charge-transfer capability could also be put down to the structural factors reflected in the degree of stacking overlap and the intensity of intermolecular π-π stacking between two polymorphs. Furthermore, two polymorphs as active ECL materials showed polymorph-dependent ECL properties. The two ECL sensors presented exhibit different ECL response signal due to the difference in triplet-triplet annihilation rate and chargetransfer rate derived from crystalline structure. They can be exploited for detecting many kinds of biological molecules like creatinine and dopamine with wide near-linear detection range and low detection limit, as shown in Fig. 10A. The near-linear detection ranges were 3.0 × 10⁻¹⁴ mol/L to 1.0 × 10⁻⁴ mol/L for Rub MWs and 1.0 × 10⁻¹³ mol/L to 1.0 × 10⁻⁴ mol/L for Rub HPs when detecting creatinine. And the detection limit was 3.0 × 10⁻¹⁴ mol/L for Rub MWs and 1.0 × 10⁻¹³ mol/L for Rub HPs.
3.4. Optoelectronic devices-organic field effect transistors (OFETs)As a very important class of functional materials, organic semiconductor accounts for a large proportion of the organic and printed electronics market, due to the adjustability of structure and energy band, superior charge transfer properties and mass productivity [150]. Organic field effect transistors (OFETs) as the basic switch-typed units in logic circuits could provide a broad platform for studying the multi-structure of organic semiconductor materials and charge transport properties in practical devices [151]. Its performance is closely related to carrier injection and transmission, which mainly depend on several factors of semiconductor conjugated molecules as active layers, including packing modes and compactness, grain sizes, orientation and alignment, etc. [152, 153]. Therefore, in view of OFET performance affected by multiple factors, regulating the growth of different polymorphs based on a same organic semiconductor molecule is an effective and convenient way to understand the structure-activity relationship, which further provides the guideline for designing novel molecular and supramolecular structures and constructing lowcost and high-efficiency charge transfer devices.
For example, Wang and co-workers [154] studied the relationship between polymorphic behaviors and organic field-effect transistor (OFET) properties based on the perylene. The crystal array for two polymorphs (α-phase and β-phase) and their mixedphase could be grown from gradient-varying concentrations of THF solutions at various temperatures by the droplet-pinned crystallization (DPC) method. The rectangular α-phase with yellow fluorescence emission were inclined to grow at higher solution concentration (4 mg/mL) and higher temperature (T = 30 ℃), whereas the rhombic β-phase with green fluorescence emission were inclined to grow at lower solution concentration (1–2 mg/mL) and lower temperature (T = 0 ℃), as depicted in Fig. 11A. The metastable β-phase underwent solid-to-solid phase transition into the α-phase during the heating process at 100–140 ℃, which could be validated by the broad endothermic peaks of DSC thermogram and the vanishment of birefringence behaviors from polarized optical microscope (POM) results for β-phase in this temperature range. The different crystalline forms of perylene as active layers placed between the source electrodes and drain electrodes presented typical p-channel OFET features. Among them, spin-coated thin film demonstrated dissatisfactory charge transport characteristics with the lowest μh, max (6.2 × 10⁻⁴ cm2 V-1 s-1), μh, avg (4.8 × 10⁻⁴ cm2 V-1 s-1) and smallest threshold voltage (Vth = 11.3 V), because of many defects and grain boundaries existing in multidirectional arrangements of perylene in polycrystalline active layer. However, β-phase crystal arrays as active layer showed outstanding charge mobility properties with the largest μh, max (1.6 × 10⁻² cm2 V-1 s-1), μh, avg (6.0 × 10⁻² cm2 V-1 s-1) and medium threshold voltage (Vth = 24.3 V). The performance for α-phase crystal arrays ranked in the middle with moderate μh, max (1.6 × 10⁻² cm2 V-1 s-1), μh, avg (1.0 × 10⁻²cm2 V-1 s-1) and threshold voltage (Vth = 21.7 V), as depicted in Figs. 11C and D. It could be seen from the electron diffraction (ED) and single-crystal structure analysis that perylene molecules, both for α-phase and β-phase crystal arrays, adopted end-on orientation and ensured the π-stacking direction, consistent with the charge transport pathway in testing devices, as shown in Fig. 11B. It was illustrated that the differences in performance could mainly put down to the different molecular aggregation and packing styles ("herringbone packing" in the β-phase and "sandwich-herringbone" packing in the α-phase"). The herringbone packing for perylene unimers in the β-phase was more conducive to transport charges effectively than the herringbone packing for perylene dimers in the α-phase.

|
Download:
|
| Fig. 11. (A) Fluorescence microscope images of the perylene crystal arrays grown from THF solutions at different temperatures and concentrations by the dropletpinned crystallization (DPC) method. (B) TEM micrographs, ED patterns and simulated ED patterns generated from [100] zone of the α-phase crystal (the upper row) and β-phase crystal (the bottom row). (C) The corresponding molecular arrangement diagrams, OFET device morphological illustrations and carrier mobility values for the α-phase crystal (the upper row) and β-phase crystal (the bottom row). (D) Bright-field optical microscopy images, output and transfer characteristics of the OFETs for the α-phase crystal (the left column) and β-phase crystal (the right column). Reproduced with permission [154]. Copyright 2018, American Chemical Society. | |
Recently, Dong and Hu et al. [155] cultivated two polymorphs based on 1, 4-di(anthracen-9-yl)buta-1, 3-diyne (DABD) by the solvent evaporation method. α-Phase polymorph was grown from chloroform solution, while β-phase polymorph was grown from toluene solution. In comparison to α-phase, exhibit simultaneously both superior fluorescence emission and charge transport properties. The maximum emission peaks for α-phase and β-phase was located at 557 nm and 587 nm, respectively. The PLQY of α-phase (3.4%) was about six times lower than that of the β-phase. The bathochromic-shift and elevated PLQY for β-phase relative to α- phase could mainly be boiled down to their structural differences: more planar molecular configuration, stronger π-π stacking structures and larger π-π stacking overlaps in β-phase. Moreover, the OFET devices comprising of β-phase as the active layer showed π-type electrical transfer characteristics with average charge carrier mobility of 0.08 cm2 V-1 s-1 and maximum value of 0.25 cm2 V-1 s-1. These devices exhibited a low threshold voltage (VT) below -10 V with high current on/off ratios (Ion/Ioff) of over 104. Nevertheless, no field-effect performance was observed for OFETs based on α-phase crystalline polymorph as the active layer, due to two main factors: the inappropriate morphology and thickness resulting in poor contact property and large contact resistance as well as the weak intermolecular interactions inducing inefficient charge transport capacity.
3.5. Nonlinear optical modulationNonlinear optical (NLO) techniques, including second harmonic generation (SHG), coherent anti-Stokes Raman scattering (CARS), two-photon fluorescence (TPF), etc., have been widely used in many fields, such as optical communication, electro-optical switches, imaging, drug screening. Apart from the progress of inorganic crystals [156, 157], organic polymer [158, 159] and organic-inorganic hybrid materials [160-162] (for example, metal-organic frameworks, MOFs) in recent years, organic molecular crystals have become one of hot issues in the field of NLO, owing to the advantages of tunable molecular and supramolecular structure, low cost, and large-scale production. For crystalline materials, non-centrosymmetric arrangement is usually the structural basis of second-order nonlinear optical properties. From the perspective of molecular design, constructing organic small molecules with dipolar conjugated asymmetric Dπ-A structure can increase hyperpolarizability (β) and microscopic nonlinearity [163]. Growing crystalline polymorphic forms of organic small molecules helps disclose the relationship between molecular conformation/arrangement and the NLO properties based on a single organic compound, which will further promote NLO performance and optimize design strategies.
In 2015, Xu et al. [164] employed multistep drop-casting growing method to regulate the self-assembly process for diphenylfluorenone (DPFO) molecules. Two polymorphs with different micro-sized morphologies were obtained by controlling growing conditions (microfibers for β-phase formed at higher temperatures and microplates for α-phase formed at lower temperatures). Various microcrystalline morphologies reflect in the difference of molecular packing modes. DPFO molecules in the α-phase belonged to non-centrosymmetric orthorhombic system with space group Ccm21 and presented a twisted conformation with the twist angle of 36.4°. While, DPFO molecules in the β-phase belonged to centrosymmetric orthorhombic system with space group Pbca and exhibited a more planar conformation with the twist angle of 31.2°. For their linear optical properties, yellow β-phase crystals displayed the emission peak at 556 nm (PLQY = 21.8%), while greenish-yellow α-phase crystals showed the emission peak at 545 nm (PLQY = 19%).
Compared with centrosymmetric β-phase, non-centrosymmetric packing mode endowed α-phase with prominent second-order nonlinear optical properties. Under the 800 nm femtosecond laser excitation, α-phase exhibited a sharp peak at 400 nm from second harmonic generation (SHG) and a broad peak centered at 530 nm assigned to two-photon excited fluorescence (TPF), whereas β- phase only presented a broad TPF signal centered at 542 nm without SHG signal. Furthermore, the polarization-dependent experiments for microfibers and microplates were carried out at fixed excitation and detection angles (both of 45°). For the horizontal microfibers, the TPF intensity achieved the maximum value when the polarization angle comes to 90° or 270°, which was perpendicular to the fiber long axis, with a polarization ratio ρ = (Imax - Imin)/(Imax + Imin) of about 0.62. Such behaviors was consistent with the results from the selected-area electron diffraction (SAED) examinations and the theoretical calculations, which illustrated that the orientation of the transition dipole along the [001] direction was perpendicular to the fiber length direction ([010] direction). However, as for the microplates, the SHG and TPF intensities were well-fitted with cos4θ and cos2θ curves, respectively. The TPF intensity achieved the maximum value when the polarization angle came to 0° or 180° with the polarization ratio ρ = 0.46 ± 0.01. This is because that the transition dipole along molecular long axis was perpendicular to the substrate in the optical plane. Unlike the polarization of TPF, the SHG attained its maximum when the polarization angle was about 160° or 340° with the polarization ratio ρ = 0.58 ± 0.02, which may be put down to the second-order nonlinear optical hyperpolarizability β, derived from two parts: the transition dipole (μge) and the permanent dipole moment difference between the ground and excited states (∆μ = μe - μg).
Afterwards, Xu and Feng et al. [165] gained several polymorphs by multiple means based on two positional isomers of naphthalenyl substituted fluorenone (2, 7-di(naphthalen-1-yl)-9H-fluoren-9-one (1-DNFO) and 2, 7-di(naphthalen-2-yl)-9H-fluoren-9- one (2-DNFO)) in this year. Three polymorphs (1α, 1β and 1γ) for 1- DNFO were prepared by antisolvent diffusion method, while two polymorphs for 2-DNFO (2α and 2β) were got through physical vapor deposition method and the solvo-thermal method, respectively. After the observation from thermal analysis (DSC and TGA) and variable temperature powder X-ray diffraction (VT-PXRD), it could be concluded that thermally induced phase transitions occurred between the polymorphs of 1-DNFO and 2-DNFO, respectively. Significantly, 1α polymorph and 1β polymorph with non-centrosymmetric structures presented second-order nonlinear optical responses. They generated both SHG signals and TPF signals when excited by laser at different wavelengths. When it came to polarization-dependent experiments, 1α and 1β display different features. Both SHG and TPF signal intensities for 1β were well-fitted with cos4θ and cos2θ curves and presented two-lobe shapes along with the change of angles in polar coordinates. The polarization ratio ρ of SHG and TPF for 1β are 0.98 ± 0.01 and 0.54 ± 0.01, respectively. However, TPF intensity along with the variation of polarization angles for 1α demonstrated four-fold symmetry mode with ρ = 0.27 ± 0.01, which could be ascribed to the packing mode or defects of the crystal as stated in the original text. Similarly, the change of SHG intensity in polar coordinates for 1α possessed side "minor wings" outlines with ρ = 0.62 ± 0.01, which could be attributed to the influence of the substrate border and the edges as well as the coupling of nonparallel electric dipoles and polarization directions. As for 1g, 2α and 2β with centrosymmetric packing structure, they exhibited only third-order nonlinear responses with TPF signals from the two-photon process. Due to the difference lying in dipole moments for these polymorphs, they showed the highest TPF polarization signals at disparate angles in polar coordinates and varying polarization ratio values (ρ = 0.55 ± 0.01 for 1g, ρ = 0.87 ± 0.01 for 2α and ρ = 0.55 ± 0.01 for 2β).
3.6. Monitoring the crystallization of pharmaceutical polymorphs by fluorescence-lifetime-imaging microscopy (FLIM)Polymorphism is also a common phenomenon in solid state aspects of drug, which played a vital role in determining the quality and performance of drugs [166]. Owing to the various molecular packing styles and intermolecular interactions for polymorphs, there would be differences in both their physical and chemical properties, which may further influence their pharmacological efficacy as drug substances [167]. Thus, it is necessary to conduct research on screening and growth control of polymorphic drugs in the early stages of drug research and development [168]. Crystallization dynamics is the crucial process in that nucleation rate and growth rate jointly dominate the ultimate morphologies, preferred orientations and polymorphic behaviors. It is indeed a complicated process affected by the variation of distinct research systems and external environment factors [169]. Monitoring crystallization process based on nondestructive fluorescence imaging techniques would help us make a better comprehension of crystalline growth and conversion visually and then facilitate to regulate these complex processes effectively [170-172]. Compared with traditional fluorescence imaging techniques, the advanced FLIM technique presents the following advantages: (1) It is independent of the concentration for the sample; (2) It is free from photobleaching; (3) It can overcome a part of interferences derived from equipment; such as the sample's orientation and position, scattering signals, or frequency-doubling signals from excitation light.
As an example, Rautaniemi and co-workers [173] studied the crystallization kinetics processes for a pharmaceutical compound indomethacin with polycrystalline forms based on fluorescence lifetime-imaging microscopy (FLIM) techniques. Different solid indomethacin forms (α, γ and amorphous form) exhibited distinct steady-state emission spectra and time-resolved fluorescence spectra, as shown in Figs. 12A and C. All the fluorescence decay for these indomethacin forms were fitted as double exponential model with two parts of lifetime and amplitudes. The shorter lifetime parts presented 1–2 ns for all forms, whereas the longer lifetime parts exhibited some variations: 5–6 ns for the crystalline forms, 2–3 ns for the amorphous forms. So, there were two ways to quantify crystallization rate and crystallinity degree. The first one is exploiting the variational intensity values at a particular lifetime value from the fluorescence lifetime-distribution analysis when rapid crystallization without moving samples, while the other one is exploiting fluorescencelifetime amplitudes from decay curves over time to calculate kinetic parameters.

|
Download:
|
| Fig. 12. (A) From left to right: molecular structure of indomethacin; normalized excitation (dashed line) and emission (solid line) spectra for different forms of indomethacin; normalized fluorescence-decay curves measured by fluorescencelifetime-imaging microscopy (FLIM) for different forms of indomethacin. (B) FLIM images (80 × 80 μm) of the amorphous indomethacin stored at 60 ℃ and 0% RH for 10 days. The same FLIM images are presented with (the upper row) and without (the bottom row) intensity modulation. (C) FLIM images of γ- and α-crystalline, amorphous, and partially crystallized amorphous indomethacin. Reproduced with permission [173]. Copyright 2018, American Chemical Society. | |
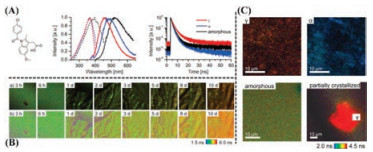
As for the first method, amorphous samples would accelerate the crystallization and tend to generate α-form with the ethanol solution-mediated crystallization. When t = 5 min, a selected unstable area showed the lifetime (τ1 = 0.69 ns, a1 = 0.78; τ2 = 2.0 ns, a2 = 0.22) similar to that of amorphous samples. As time went on until 95 min, this unstable area exhibited the fluorescence lifetime like that of α-form crystalline indomethacin. The change of conversion degree with time for the amorphous indomethacin crystallization process could be fitted according to the first-order reaction model (R2 = 0.977).
According to the second method, crystallization conversion for amorphous samples into γ-form during the storage was observed under 60 ℃ and 0% RH conditions for 10 days, as shown in Fig. 12B. During the crystallization process, the shorter lifetime parts increased from 1.03 ± 0.02 ns to 1.48 ± 0.05 ns with the rise of corresponding amplitude a1, whereas the longer lifetime parts increased from 2.57 ± 0.04 ns to 5.41 ±0.11 ns with the reduction of corresponding amplitude a2. The corresponding relationship between conversion degree and time could be fitted by onedimensional diffusion-controlled reaction model and threedimensional diffusion-controlled reaction model, respectively. Actually, some amorphous samples followed respective crystallization mechanisms for their surface parts and internal parts.
4. Conclusions and perspectivesIn this review, we have summarized the recent advances in photofunctional molecular polymorphic materials, including the methods for polymorph growth and their potential applications in several areas, which by no means represent an exhaustive list of all possible examples. From the crystal growth perspective of the molecular polymorph, traditional solution methods (including solvent evaporation and diffusion methods) are still widely used due to the universality and convenient operation. The development of novel methods like applying external magnetic field and PVT provides the new ideas for single crystal preparation. Additionally, post-synthesis methods by the transition between polymorphs under external stimuli promote the study of structural correlations and differences as well as their property modulation. These reported works are helpful to deep our comprehension and cognition towards molecular structure/crystalline structure-luminescence relationships. From the application perspective, these photoactive polymorphs have promising future of application in many fields, such as fluorescent sensors, laser gain medium, electrode active materials for ECL, optoelectronic devices and visualization of crystallization kinetics. These multiple applications reveal the significance and value of the polymorphism study, both in depth and breadth.
Although some headway has been made in studying the controlled growth and fluorescent applications of organic polymorphic materials, there are still many barriers in this field that need to be broken through. First of all, to date, it still remains a challenge to predict the optimized stable/metastable crystal structures and solid-state optical properties of polymorphs before experiments, especially for complex molecules with large conjugated system. The number of polymorphs for an organic molecule depends on the time devoted and the number of trials currently. Indeed, some prediction and simulation methods need to be developed urgently from a theoretical perspective, which will provide a deep insight into disclosing the essence of organic molecular self-assembly and designing multifunctional polymorphic materials with unique properties and outstanding fluorescence performance. Secondly, at present, the research about preparation methods and practical applications for organic polymorph stays on the macroscopic scale. More attention and further systematic studies should be devoted to the construction of polymorphic micro-/nanostructures and the evaluation towards their micro-/nanosized effects and properties. Some exotic low-dimensional effects of micro-/nanosized materials will endow them wider application prospect in many aspects, including nanoelectronic devices, flexible smart sensors, and so on.
It is expected that growth methods of crystalline polymorphs corresponding to tunable subtle polymorphic structures as reported works can be further migrated into fabricate other neoteric functional crystalline materials. The design principles based on polymorphs with peculiar properties and superior performance on the device can be further extended to other optoelectronic applications. Research of functional moleculebased polymorphs is still on the road and needs collective efforts from all over the world.
AcknowledgmentsThis work was supported by the National Natural Science Foundation of China (Nos. 21771021 and 21822501), the Beijing Nova Program (No. xx2018115), the Fundamental Research Funds for the Central Universities, and Analytical and Measurements Fund of Beijing Normal University.
| [1] |
D. Fox, M.M. Labes, A. Weissberger, Physics and Chemistry of the Organic Solid State, Wiley Interscience, New York, 1965, pp. 725-767.
|
| [2] |
J. Bernstein, Polymorphism in Molecular Crystals, Oxford Univ. Press, 2002.
|
| [3] |
S.L. Price, Phys. Chem. Chem. Phys. 10 (2008) 1996-2009. DOI:10.1039/b719351c |
| [4] |
S.L. Price, Acc. Chem. Res. 42 (2009) 117-126. DOI:10.1021/ar800147t |
| [5] |
R.Hilfiker, M.vonRaumer, Polymorphism in the Pharmaceutical Industry: Solid Form and Drug Development, Wiley-VCH Verlag GmbH, Weinheim, 2019.
|
| [6] |
N. Marom, R.A. DiStasio Jr., V. Atalla, et al., Angew. Chem. Int. Ed. 52 (2013) 6629-6632. DOI:10.1002/anie.201301938 |
| [7] |
A.M. Reilly, A. Tkatchenko, Phys. Rev. Lett. 113 (2014) 055701. DOI:10.1103/PhysRevLett.113.055701 |
| [8] |
S.L. Price, Chem. Soc. Rev. 43 (2014) 2098-2111. DOI:10.1039/C3CS60279F |
| [9] |
M.A. Neumann, J. van de Streek, F.P.A. Fabbiani, P. Hidber, O. Grassmann, Nat. Commun. 6 (2015) 7793. DOI:10.1038/ncomms8793 |
| [10] |
G.J.O. Beran, Chem. Rev. 116 (2016) 5567-5613. DOI:10.1021/acs.chemrev.5b00648 |
| [11] |
C. Guo, J. Wang, J. Li, Z. Wang, S. Tang, J. Phys. Chem. Lett. 7 (2016) 5008-5014. DOI:10.1021/acs.jpclett.6b02276 |
| [12] |
J. Li, J. Sun, Acc. Chem. Res. 50 (2017) 2737-2745. DOI:10.1021/acs.accounts.7b00366 |
| [13] |
P.M. Piaggi, M. Parrinello, Proc. Natl. Acad. Sci. U. S. A. 115 (2018) 10251-10256. DOI:10.1073/pnas.1811056115 |
| [14] |
F. Musil, S. De, J. Yang, et al., Chem. Sci. 9 (2018) 1289-1300. DOI:10.1039/C7SC04665K |
| [15] |
J. Yang, S. De, J.E. Campbell, et al., Chem. Mater. 30 (2018) 4361-4371. DOI:10.1021/acs.chemmater.8b01621 |
| [16] |
J.F. Xu, H.H. Chen, Y.Z. Chen, et al., Sens. Actuators B -Chem. 168 (2012) 14-19. DOI:10.1016/j.snb.2011.12.101 |
| [17] |
Y. Zhang, S. Li, G. Pan, et al., Sens. Actuators B -Chem. 254 (2018) 785-794. DOI:10.1016/j.snb.2017.07.040 |
| [18] |
B. Zhao, G. Xie, H. Wang, C. Han, H. Xu, Chem. Eur. J. 25 (2019) 1010-1017. DOI:10.1002/chem.201805201 |
| [19] |
I. Hladka, D. Volyniuk, O. Bezvikonnyi, et al., J. Mater. Chem. C 6 (2018) 13179-13189. DOI:10.1039/C8TC04867C |
| [20] |
K. Zhou, H. Bai, L. Feng, J. Dai, M. Cui, Anal. Chem. 89 (2017) 9432-9437. DOI:10.1021/acs.analchem.7b02246 |
| [21] |
Y. Li, K. Wang, K. Zhou, et al., Chem. Commun. 54 (2018) 8717-8720. DOI:10.1039/C8CC05259J |
| [22] |
C. Grivas, M. Pollnau, Laser Photonics Rev. 6 (2012) 419-462. DOI:10.1002/lpor.201100034 |
| [23] |
H. Dong, C. Zhang, Y.S. Zhao, J. Mater. Chem. C 5 (2017) 5600-5609. DOI:10.1039/C6TC05474A |
| [24] |
D. Yan, A. Delori, G.O. Lloyd, et al., Angew. Chem. Int. Ed. 50 (2011) 12483-12486. DOI:10.1002/anie.201106391 |
| [25] |
A.J. Cruz-Cabeza, J. Bernstein, Chem. Rev. 114 (2014) 2170-2191. DOI:10.1021/cr400249d |
| [26] |
D. Yan, H. Yang, Q. Meng, H. Lin, M. Wei, Adv. Funct. Mater. 24 (2014) 587-597. DOI:10.1002/adfm.201302072 |
| [27] |
W.H. Fang, J. Am. Chem. Soc. 121 (1999) 8376-8384. DOI:10.1021/ja982334i |
| [28] |
W.H. Fang, Acc. Chem. Res. 41 (2008) 452-457. DOI:10.1021/ar700205f |
| [29] |
C. Jia, A. Migliore, N. Xin, et al., Science 352 (2016) 1443-1445. DOI:10.1126/science.aaf6298 |
| [30] |
N. Xin, J. Guan, C. Zhou, et al., Nat. Rev. Phys. 1 (2019) 211-230. DOI:10.1038/s42254-019-0022-x |
| [31] |
M. Kasha, Rev. Mod. Phys. 31 (1959) 162-169. DOI:10.1103/RevModPhys.31.162 |
| [32] |
A.S. Davydov, Theory of Molecular Excitons, Plenum, New York, 1971.
|
| [33] |
M. Kasha, Discuss. Faraday Soc. 9 (1950) 14-19. DOI:10.1039/df9500900014 |
| [34] |
M. Shimizu, T. Hiyama, Chem. -Asian J. 5 (2010) 1516-1531. DOI:10.1002/asia.200900727 |
| [35] |
J. Gierschner, S.Y. Park, J. Mater. Chem. C 1 (2013) 5818-5832. DOI:10.1039/c3tc31062k |
| [36] |
M.D. Curtis, J. Cao, J.W. Kampf, J. Am. Chem. Soc. 126 (2004) 4318-4328. DOI:10.1021/ja0397916 |
| [37] |
M. Shimizu, T. Hiyama, Chem. Asian J. 5 (2010) 1516-1531. DOI:10.1002/asia.200900727 |
| [38] |
M. Baghgar, M.D. Barnes, ACS Nano 9 (2015) 7105-7112. DOI:10.1021/acsnano.5b03422 |
| [39] |
S. Basak, N. Nandi, A. Baral, A. Banerjee, Chem. Commun. 51 (2015) 780-783. DOI:10.1039/C4CC06680D |
| [40] |
T. Eder, T. Stangl, M. Gmelch, et al., Nat. Commun. 8 (2017) 1641. DOI:10.1038/s41467-017-01773-0 |
| [41] |
N.J. Hestand, F.C. Spano, Acc. Chem. Res. 50 (2017) 341-350. DOI:10.1021/acs.accounts.6b00576 |
| [42] |
S.R. Marques, J.A. Labastide, M.D. Barnes, J. Phys. Chem. C 122 (2018) 15723-15728. DOI:10.1021/acs.jpcc.8b03200 |
| [43] |
N.J. Hestand, F.C. Spano, Chem. Rev. 118 (2018) 7069-7163. DOI:10.1021/acs.chemrev.7b00581 |
| [44] |
A. Nangia, Acc. Chem. Res. 41 (2008) 595-604. DOI:10.1021/ar700203k |
| [45] |
A.Y. Lee, D. Erdemir, A.S. Myerson, Annu. Rev. Chem. Biomol. Eng. 2 (2011) 259-280. DOI:10.1146/annurev-chembioeng-061010-114224 |
| [46] |
D.K. Bucar, R.W. Lancaster, J. Bernstein, Angew. Chem. Int. Ed. 54 (2015) 69729-6993. |
| [47] |
A.J. Cruz-Cabeza, S.M. Reutzel-Edensb, J. Bernstein, Chem. Soc. Rev. 44 (2015) 8619-8635. DOI:10.1039/C5CS00227C |
| [48] |
K.M. Steed, J.W. Steed, Chem. Rev. 115 (2015) 2895-2933. DOI:10.1021/cr500564z |
| [49] |
Y.G. Zhen, H.L. Dong, L. Jiang, W.P. Hu, Chin. Chem. Lett. 27 (2016) 1330-1338. DOI:10.1016/j.cclet.2016.06.023 |
| [50] |
H. Chung, Y. Diao, J. Mater. Chem. C 4 (2016) 3915-3933. DOI:10.1039/C5TC04390E |
| [51] |
D. Yan, D.G. Evans, Mater. Horiz. 1 (2014) 46-57. DOI:10.1039/C3MH00023K |
| [52] |
H. Jiang, C. Kloc, MRS Bull. 38 (2013) 28-33. DOI:10.1557/mrs.2012.308 |
| [53] |
L. Chen, S.Y. Yin, M. Pan, et al., J. Mater. Chem. C 4 (2016) 6962-6966. DOI:10.1039/C6TC01308B |
| [54] |
D. Yan, G. Fan, Y. Guan, et al., Phys. Chem. Chem. Phys. 15 (2013) 19845-19852. DOI:10.1039/c3cp53929f |
| [55] |
R. Li, S. Xiao, Y. Li, et al., Chem. Sci. 5 (2014) 3922-3928. DOI:10.1039/C4SC01243G |
| [56] |
L. Wang, K. Wang, B. Zou, et al., Adv. Mater. 27 (2015) 2918-2922. DOI:10.1002/adma.201500589 |
| [57] |
P. Chen, H. Zhang, L. Niu, et al., Adv. Funct. Mater. 27 (2017) 1700332. DOI:10.1002/adfm.201700332 |
| [58] |
Y. Zhang, Y.Q. Feng, X.X. Tian, et al., Adv. Opt. Mater. 6 (2018) 1800903. DOI:10.1002/adom.201800903 |
| [59] |
G. Huang, Y. Jiang, S. Yang, B.S. Li, B.Z. Tang, Adv. Funct. Mater. 29 (2019) 1900516. DOI:10.1002/adfm.201900516 |
| [60] |
R.J. Davey, S.L.M. Schroeder, J.H. ter Horst, Angew. Chem. Int. Ed. 52 (2013) 2166-2179. DOI:10.1002/anie.201204824 |
| [61] |
Z. Xu, Z. Zhang, X. Jin, Q. Liao, H. Fu, Chem. Asian J. 12 (2017) 2985-2990. DOI:10.1002/asia.201701207 |
| [62] |
P.Y. Gu, G. Liu, J. Zhao, et al., J. Mater. Chem. C 5 (2017) 8869-8874. DOI:10.1039/C7TC03089D |
| [63] |
B. Huang, W.C. Chen, Z. Li, et al., Angew. Chem. Int. Ed. 57 (2018) 12473-12477. DOI:10.1002/anie.201806800 |
| [64] |
C. Zheng, Q. Zang, H. Nie, et al., Mater. Chem. Front. 2 (2018) 180-188. DOI:10.1039/C7QM00435D |
| [65] |
T. Zhang, Z. Zhao, H. Ma, Y. Zhang, W.Z. Yuan, Chem. -Asian J. 14 (2019) 884-889. DOI:10.1002/asia.201801727 |
| [66] |
Z. He, W. Li, G. Chen, Y. Zhang, W.Z. Yuan, Chin. Chem. Lett. 30 (2019) 933-936. DOI:10.1016/j.cclet.2019.03.015 |
| [67] |
Z. Zhang, X. Song, S. Wang, et al., J. Phys. Chem. Lett. 7 (2016) 1697-1702. DOI:10.1021/acs.jpclett.6b00704 |
| [68] |
Y. Zhang, H. Ma, S. Wang, et al., J. Phys. Chem. C 120 (2016) 19759-19767. DOI:10.1021/acs.jpcc.6b05537 |
| [69] |
C. Wang, B. Xu, M. Li, et al., Mater. Horiz. 3 (2016) 220-225. DOI:10.1039/C6MH00025H |
| [70] |
D. Tian, Z. Zhu, L. Xu, H. Cong, J. Zhu, Mater. Horiz. 6 (2019) 1215-1221. DOI:10.1039/C9MH00130A |
| [71] |
G. Giri, E. Verploegen, S.C.B. Mannsfeld, et al., Nature 480 (2011) 504-508. DOI:10.1038/nature10683 |
| [72] |
O. Guillon, J. Gonzalez-Julian, B. Dargatz, et al., Adv. Eng. Mater. 16 (2014) 830-849. DOI:10.1002/adem.201300409 |
| [73] |
E. Timurdogan, C.V. Poulton, M.J. Byrd, M.R. Watts, Nat. Photonics 11 (2017) 200-206. DOI:10.1038/nphoton.2017.14 |
| [74] |
M.Z. Becker, N. Shomrat, Y. Tsur, Adv. Mater. 30 (2018) 1706369. DOI:10.1002/adma.201706369 |
| [75] |
O. Guillon, C. Elsässer, O. Gutfleisch, et al., Mater. Today 21 (2018) 527-536. DOI:10.1016/j.mattod.2018.03.026 |
| [76] |
B. Hu, L. Yan, M. Shao, Adv. Mater. 21 (2009) 1500-1516. DOI:10.1002/adma.200802386 |
| [77] |
M.B.J. Atkinson, D.K. Bwambok, J. Chen, et al., Angew. Chem. Int. Ed. 52 (2013) 10208-10211. DOI:10.1002/anie.201305549 |
| [78] |
J. Potticary, L.R. Terry, C. Bell, et al., Nat. Commun. 7 (2016) 11555. DOI:10.1038/ncomms11555 |
| [79] |
R.A. Laudise, C. Kloc, P.G. Simpkins, T. Siegrist, J. Cryst. Growth 187 (1998) 449-454. DOI:10.1016/S0022-0248(98)00034-7 |
| [80] |
S.M. Yoon, I.C. Hwang, N. Shin, et al., Langmuir 23 (2007) 11875-11882. DOI:10.1021/la702071w |
| [81] |
S. Min Yoon, H.J. Song, H.C. Choi, Adv. Mater. 22 (2010) 2164-2167. DOI:10.1002/adma.200903719 |
| [82] |
A.O.F. Jones, B. Chattopadhyay, Y.H. Geerts, R. Resel, Adv. Funct. Mater. 26 (2016) 2233-2255. DOI:10.1002/adfm.201503169 |
| [83] |
M.A. Reyes-Martinez, A.J. Crosby, A.L. Briseno, Nat. Commun. 6 (2015) 6948. DOI:10.1038/ncomms7948 |
| [84] |
S.Y. Min, T.S. Kim, Y. Lee, et al., Small 11 (2015) 45-62. DOI:10.1002/smll.201401487 |
| [85] |
X. Zhang, J. Jie, W. Deng, et al., Adv. Mater. 28 (2016) 2475-2503. DOI:10.1002/adma.201504206 |
| [86] |
L. Yu, Acc. Chem. Res. 43 (2010) 1257-1266. DOI:10.1021/ar100040r |
| [87] |
Y. Wu, J. Feng, X. Jiang, et al., Nat. Commun. 6 (2015) 6737. DOI:10.1038/ncomms7737 |
| [88] |
T. Liu, K. Cheng, E. Salami-Ranjbaran, et al., J. Chem. Phys. 143 (2015) 084506. DOI:10.1063/1.4928521 |
| [89] |
J. Gómez, J. Jiang, A. Gujral, et al., Soft Matter 12 (2016) 2942-2947. DOI:10.1039/C5SM02944A |
| [90] |
S.S. Dalala, D.M. Waltersa, I. Lyubimovb, J.J. de Pablob, M.D. Ediger, Proc. Natl. Acad. Sci. U. S. A. 112 (2015) 4227-4232. DOI:10.1073/pnas.1421042112 |
| [91] |
C. Park, J.E. Park, H.C. Choi, Acc. Chem. Res. 47 (2014) 2353-2364. DOI:10.1021/ar5000874 |
| [92] |
Y. Xu, Z. Xie, H. Zhang, F. Shen, Y. Ma, CrystEngComm 18 (2016) 6824-6829. DOI:10.1039/C6CE01057A |
| [93] |
J. Hoja, A.M. Reilly, A. Tkatchenko, Wiley Interdiscip. Rev. Comput. Mol. Sci. 7(2017) e1294.
|
| [94] |
F. Gu, C. Zhang, X. Ma, Macromol. Rapid Commun. 40 (2019) 1800751. DOI:10.1002/marc.201800751 |
| [95] |
S. Varughese, J. Mater. Chem. C 2 (2014) 3499-3516. DOI:10.1039/c3tc32414a |
| [96] |
D. Braga, F. Grepioni, Chem. Commun. 29 (2005) 3635-3645. DOI:10.1039/B504668H |
| [97] |
J. Nyman, G.M. Day, Phys. Chem. Chem. Phys. 18 (2016) 31132-31143. DOI:10.1039/C6CP05447A |
| [98] |
J.G. Brandenburg, J. Potticary, H.A. Sparkes, S.L. Price, S.R. Hall, J. Phys. Chem. Lett. 8 (2017) 4319-4324. DOI:10.1021/acs.jpclett.7b01944 |
| [99] |
L. Zhang, Z. Liu, L.Y. Liu, et al., ACS Appl. Mater. Interfaces 10 (2018) 44092-44101. DOI:10.1021/acsami.8b20395 |
| [100] |
M. Dharmarwardana, R.P. Welch, S. Kwon, et al., Chem. Commun. 53 (2017) 9890-9893. DOI:10.1039/C7CC04346E |
| [101] |
C. Ge, J. Liu, X. Ye, et al., J. Phys. Chem. C 122 (2018) 15744-15752. DOI:10.1021/acs.jpcc.8b04164 |
| [102] |
M. Louis, A. Brosseau, R. Guillot, et al., J. Phys. Chem. C 121 (2017) 15897-15907. DOI:10.1021/acs.jpcc.7b01901 |
| [103] |
Y. Beldjoudi, A. Arauzo, J. Campo, et al., J.Am.Chem.Soc. 141 (2019) 6875-6889. DOI:10.1021/jacs.8b11528 |
| [104] |
L. Maini, F. Gallino, M. Zambianchi, et al., Chem.Commun. 51 (2015) 2033-2035. DOI:10.1039/C4CC09177A |
| [105] |
M. Li, Q. Zhang, J. Wang, X. Mei, Chem. Commun. 52 (2016) 11288-11291. DOI:10.1039/C6CC04958C |
| [106] |
T. Yamakado, K. Otsubo, A. Osuka, S. Saito, J. Am. Chem. Soc. 140 (2018) 6245-6248. DOI:10.1021/jacs.8b03833 |
| [107] |
B. Xu, J. He, Y. Mu, et al., Chem. Sci. 6 (2015) 3236-3241. DOI:10.1039/C5SC00466G |
| [108] |
P.S. Hariharan, D. Moon, S.P. Anthony, J. Mater. Chem. C 3 (2015) 8381-8388. DOI:10.1039/C5TC01369K |
| [109] |
Z. Zhuang, P. Shen, S. Ding, et al., Chem. Commun. 52 (2016) 10842-10845. DOI:10.1039/C6CC04233C |
| [110] |
Y. Lei, Y. Zhou, L. Qian, et al., J. Mater. Chem. C 5 (2017) 5183-5192. DOI:10.1039/C7TC00362E |
| [111] |
Y. Zhang, Q. Song, K. Wang, et al., J. Mater. Chem. C 3 (2015) 3049-3054. DOI:10.1039/C4TC02826K |
| [112] |
C. Wang, Z. Li, Mater. Chem. Front. 1 (2017) 2174-2194. DOI:10.1039/C7QM00201G |
| [113] |
Y. Yang, X. Yang, X. Fang, K.Z. Wang, D. Yan, Adv. Sci. 5 (2018) 1801187. DOI:10.1002/advs.201801187 |
| [114] |
W. Zhang, A.R. Oganov, A.F. Goncharov, et al., Science 342 (2013) 1502-1505. DOI:10.1126/science.1244989 |
| [115] |
L. Zhang, Y. Wang, J. Lv, Y. Ma, Nat. Rev. Mater. 2 (2017) 17005. DOI:10.1038/natrevmats.2017.5 |
| [116] |
S.J. Yoon, S.Y. Park, J. Mater. Chem. 21 (2011) 8338-8346. DOI:10.1039/c0jm03711g |
| [117] |
B. Lu, Y. Zhang, X. Yang, et al., J. Mater. Chem. C 6 (2018) 9660-9666. DOI:10.1039/C8TC02444H |
| [118] |
M. Martínez-Abadía, R. Giménez, M.B. Ros, Adv. Mater. 30 (2018) 1704161. DOI:10.1002/adma.201704161 |
| [119] |
Y. Xu, K. Wang, Y. Zhang, et al., J. Mater. Chem. C 4 (2016) 1257-1262. DOI:10.1039/C5TC03745J |
| [120] |
J. Guan, C. Zhang, D. Gao, et al., Mater. Chem. Front. 3 (2019) 1510-1517. DOI:10.1039/C9QM00082H |
| [121] |
W. Guan, W. Zhou, J. Lu, C. Lu, Chem. Soc. Rev. 44 (2015) 6981-7009. DOI:10.1039/C5CS00246J |
| [122] |
L. Bian, H. Shi, X. Wang, et al., J. Am. Chem. Soc. 140 (2018) 10734-10739. DOI:10.1021/jacs.8b03867 |
| [123] |
W. Zhang, D. Yu, Z. Wang, et al., Org. Lett. 21 (2019) 109-113. DOI:10.1021/acs.orglett.8b03538 |
| [124] |
D. Yan, Chem. -Eur. J. 21 (2015) 4880-4896. DOI:10.1002/chem.201405456 |
| [125] |
D. Wu, A.C. Sedgwick, T. Gunnlaugsson, et al., Chem. Soc. Rev. 46 (2017) 7105-7123. DOI:10.1039/C7CS00240H |
| [126] |
R. Gao, X. Fang, D. Yan, J. Mater. Chem. C 7 (2019) 3399-3412. |
| [127] |
L. Wang, K. Wang, H. Zhang, et al., Chem. Commun. 51 (2015) 7701-7704. DOI:10.1039/C5CC01113B |
| [128] |
B. Shao, R. Jin, A. Li, et al., J. Mater. Chem. C 7 (2019) 3263-3268. DOI:10.1039/C9TC00051H |
| [129] |
X. Wang, Q. Liao, H. Li, et al., J. Am. Chem. Soc. 137 (2015) 9289-9295. DOI:10.1021/jacs.5b03051 |
| [130] |
J. Gierschner, S. Varghese, S.Y. Park, Adv. Opt. Mater. 4 (2016) 348-364. DOI:10.1002/adom.201500531 |
| [131] |
P. Baronas, G. Kreiza, P. Adomenas, et al., ACS Appl. Mater. Interfaces 10 (2018) 2768-2775. DOI:10.1021/acsami.7b14702 |
| [132] |
H.H. Fang, J. Yang, J. Feng, et al., Laser Photonics Rev. 8 (2014) 687-715. DOI:10.1002/lpor.201300222 |
| [133] |
W. Zhang, Y.S. Zhao, Chem. Commun. 52 (2016) 8906-8917. DOI:10.1039/C6CC00018E |
| [134] |
C. Zhang, H. Dong, Y.S. Zhao, Adv. Opt. Mater. 6 (2018) 1701193. DOI:10.1002/adom.201701193 |
| [135] |
H. Dong, C. Zhang, J. Yao, Y.S. Zhao, Chem. -Asian J. 11 (2016) 2656-2661. DOI:10.1002/asia.201600387 |
| [136] |
Q. Liao, Z. Wang, Q. Gao, et al., J. Mater. Chem. C 6 (2018) 7994-8002. DOI:10.1039/C8TC01584H |
| [137] |
K. Wang, H. Zhang, S. Chen, et al., Adv. Mater. 26 (2014) 6168-6173. DOI:10.1002/adma.201401114 |
| [138] |
S. Varghese, S.K. Park, S. Casado, et al., Adv. Funct. Mater. 26 (2016) 2349-2356. DOI:10.1002/adfm.201503371 |
| [139] |
Q. Liao, X.G. Wang, S. Lv, et al., ACS Nano 12 (2018) 5359-5367. DOI:10.1021/acsnano.8b00150 |
| [140] |
B. Fang, M. Chu, Z. Wu, et al., J. Mater. Chem. C 7 (2019) 4434-4440. DOI:10.1039/C9TC00156E |
| [141] |
A.J. Bard, Electrogenerated Chemiluminescence, Marcel Dekker, New York, 2004.
|
| [142] |
S. Carrara, F. Arcudi, M. Prato, L. De Cola, Angew. Chem. Int. Ed. 56 (2017) 4757-4761. DOI:10.1002/anie.201611879 |
| [143] |
Y. Chen, S. Zhou, L. Li, J. Zhu, Nano Today 12 (2017) 98-115. DOI:10.1016/j.nantod.2016.12.013 |
| [144] |
R. Tian, S. Zhang, M. Li, et al., Adv. Funct. Mater. 25 (2015) 5006-5015. DOI:10.1002/adfm.201501433 |
| [145] |
Z. Liu, W. Qi, G. Xu, Chem. Soc. Rev. 44 (2015) 3117-3142. DOI:10.1039/C5CS00086F |
| [146] |
G. Fan, D. Yan, Adv. Opt. Mater. 4 (2016) 2139-2147. DOI:10.1002/adom.201600310 |
| [147] |
Z. Li, Y. Zhou, L. Peng, D. Yan, M. Wei, Chem. Commun. 53 (2017) 8862-8865. DOI:10.1039/C7CC04421F |
| [148] |
J. Zhang, S. Arbault, N. Sojic, D. Jiang, Annu. Rec. Anal. Chem. 12 (2019) 275-295. DOI:10.1146/annurev-anchem-061318-115226 |
| [149] |
J. Gu, Y. Gao, J. Wu, et al., ACS Appl. Mater. Interfaces 9 (2017) 8891-8899. DOI:10.1021/acsami.6b16118 |
| [150] |
S. Hotta, T. Yamao, S.Z. Bisri, T. Takenobuc, Y. Iwasa, J. Mater. Chem. C 2 (2014) 965-980. DOI:10.1039/C3TC31998A |
| [151] |
Z.A. Lamport, H.F. Haneef, S. Anand, M. Waldrip, O.D. Jurchescu, J. Appl. Phys. 124 (2018) 071101. DOI:10.1063/1.5042255 |
| [152] |
C. Wang, H. Dong, L. Jiang, W. Hu, Chem. Soc. Rev. 47 (2018) 422-500. DOI:10.1039/C7CS00490G |
| [153] |
Y. Wang, L. Sun, C. Wang, et al., Chem. Soc. Rev. 48 (2019) 1492-1530. DOI:10.1039/C8CS00406D |
| [154] |
C.T. Hsieh, C.Y. Chen, H.Y. Lin, et al., J. Phys. Chem. C 122 (2018) 16242-16248. DOI:10.1021/acs.jpcc.8b02199 |
| [155] |
D. Liu, C. Li, S. Niu, et al., J. Mater. Chem. C 7 (2019) 5925-5930. DOI:10.1039/C9TC01321K |
| [156] |
F. Liang, L. Kang, Z. Lin, Y. Wu, C. Chen, Coord. Chem. Rev. 333 (2017) 57-70. DOI:10.1016/j.ccr.2016.11.012 |
| [157] |
J. Lu, J.N. Yue, L. Xiong, et al., J. Am. Chem. Soc. 141 (2019) 8093-8097. |
| [158] |
R. Tang, S. Zhou, Z. Cheng, et al., Chem. Sci. 8 (2017) 340-347. DOI:10.1039/C6SC02956F |
| [159] |
P. Chen, H. Zhang, M. Han, et al., Mater. Chem. Front. 2 (2018) 1374-1382. DOI:10.1039/C8QM00128F |
| [160] |
R. Medishetty, J.K. Zarȩba, D. Mayer, M. Samo c, R.A. Fischer, Chem. Soc. Rev. 46 (2017) 4976-5004. DOI:10.1039/C7CS00162B |
| [161] |
R. Medishetty, V. Nalla, L. Nemec, et al., Adv. Mater. 29 (2017) 1605637. DOI:10.1002/adma.201605637 |
| [162] |
X. Yang, X. Lin, Y.S. Zhao, D. Yan, Chem. Eur. J. 24 (2018) 6484-6493. DOI:10.1002/chem.201704650 |
| [163] |
M. Li, Y. Li, H. Zhang, et al., J. Mater. Chem. C 5 (2017) 4111-4122. DOI:10.1039/C7TC00713B |
| [164] |
J. Xu, S. Semin, J. Cremers, et al., Adv. Opt. Mater. 3 (2015) 948-956. DOI:10.1002/adom.201400637 |
| [165] |
C. Ju, X. Li, G. Yang, et al., Dyes Pigm. 166 (2019) 272-282. DOI:10.1016/j.dyepig.2019.03.030 |
| [166] |
R. Hilfiker, Polymorphism: in the Pharmaceutical Industry, Wiley-VCH, Weinheim, 2006.
|
| [167] |
J. Bernstein, Cryst. Growth Des. 11 (2011) 632-650. DOI:10.1021/cg1013335 |
| [168] |
A. Llinas, J.M. Goodman, Drug Discov. Today 13 (2008) 198-210. DOI:10.1016/j.drudis.2007.11.006 |
| [169] |
D. Braga, F. Grepioni, L. Maini, Chem. Commun. 46 (2010) 6232-6242. DOI:10.1039/c0cc01195a |
| [170] |
X. Ye, Y. Liu, Y. Lv, et al., Angew. Chem. Int. Ed. 54 (2015) 7976-7980. DOI:10.1002/anie.201503052 |
| [171] |
F. Ito, Y. Suzuki, J. Fujimori, et al., Sci. Rep. 6 (2016) 22918. DOI:10.1038/srep22918 |
| [172] |
Z. Gao, S. Rohani, J. Gong, J. Wang, Engineering 3 (2017) 343-353. DOI:10.1016/J.ENG.2017.03.022 |
| [173] |
K. Rautaniemi, E. Vuorimaa-Laukkanen, C.J. Strachan, T. Laaksonen, Mol. Pharm. 15 (2018) 1964-1971. DOI:10.1021/acs.molpharmaceut.8b00117 |