 2019, Vol. 30


b CAS Key Laboratory of Health Informatics, Shenzhen Institute of Synthetic Biology, Shenzhen-Hong Kong Institute of Brain Science, Shenzhen Institutes of Advanced Technology, Chinese Academy of Sciences, Shenzhen 518055, China
Biological imaging is considered to be one of the most efficient approaches for studying the function and structure of cells and tissues as the capability of visualizing the biological processes. At present, several well-established biological imaging techniques have been widely used for human health care [1], such as MRI (magnetic resonance imaging) [2], X-ray projectional radiography [3], X-ray computed tomography [4], PET (positron emission tomography) [5], SPECT (single photon emission computed tomography) [6]. Taking the advantage of the high penetration depth along with the high contrast imaging probes, these techniques play a vital role in the disease diagnosis and therapy, for example the MRI with gadolinium-based probe could provide a high contrast image between tumor tissue and normal tissue [7] and the fluorodeoxyglucose based PETcould indicate the metabolic process of specific tissue and organs [8]; whereas, the limitations of these imaging techniques are in evidence, such as the hazardous ionizing radiation (CT, PET and SPECT), intrinsically low spatial resolution (MRI (7 T, 0.5 mm) and PET (3 mm)) [9, 10]. In contrast, optical imaging is characterized as a high spatial resolution (diffraction limit) as well as low energy non-hazardous radiation (visible to NIR light) [11]. Especially, the development of fluorescence optical imaging technique results in a qualitative leap in the imaging contrast. However, the optical beam suffers from a huge scattering by tissues, which hinders such an excellent technique from imaging as deep as aforementioned techniques.
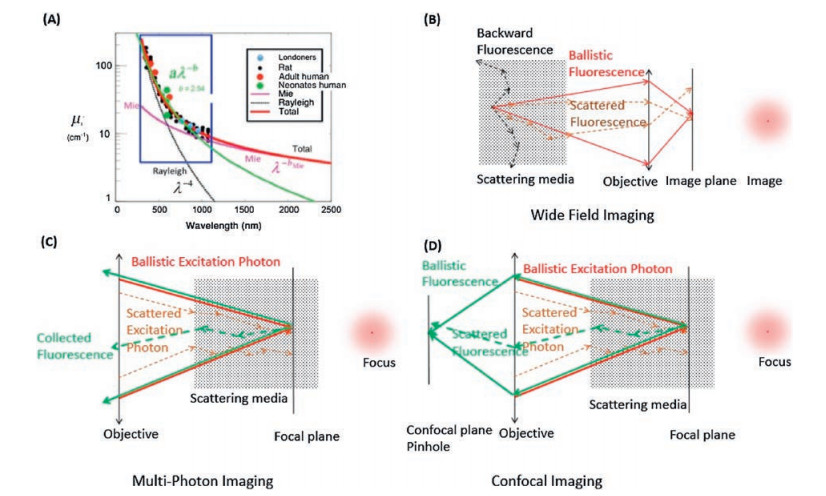
The light scattering by tissue can be described as a combination function of the Ryleigh scattering(1/λ4) and Mie scattering (1/λb) [12], as shown in Fig. 1A. The light experiences more scattering as the wavelength getting shorter. In other words, the longer the wavelength, the further the light could travel in tissue (remaining the original direction). The unscattered light also known as ballistic photon is the only effective contribution to the image of the object. All the deviated light (diffused, snaked) would give rise to the background noise, making the image blur. Figs. 1B-D depict the photon path of generally used optical imaging systems. For the wide field fluorescence imaging system, the image clarity and the imaging depth are determined by the ballistic fluorescence photon. In the case of the multiphoton microscopy, ballistic excitation photon plays a crucial role for the image clarity and depth. All kinds of fluorescence photons (scattered and ballistic) are collected as signal. However, the image clarity and depth of confocal fluorescence microscopy lie on both the ballistic excitation and fluorescence photon as shown in Fig. 1D.

|
Download:
|
| Fig. 1. (A) The reduced light scattering coefficient through tissue, dots represent the experimental results, the magenta curve plotted with a function of λ-b from Mie scattering; the black curve is from Rayleigh scattering as λ-4; the green curve is the fit by a function as aλ-b; the red curve is the fitting of the experimental data with a combination of the Mie and Rayleigh scattering. (B) the scheme of the wide field fluorescence imaging optical path; the excitation beam is not shown, the fluorescence plays a key role on the image quality; red arrow stands for the ballistic fluorescence photon; black dotted arrow for the backward scattering fluorescence photon; brown dotted arrow for the scattered fluorescence photon; the red dot stands for the image of the object, and the blur caused by the scattered fluorescence photon. (C) The scheme of the multiphoton fluorescence imaging; Red arrow stands for the ballistic excitation photon; Brown dotted arrow for the scattered excitation photon; Green arrow stands for the ballistic fluorescence photon; Green dotted arrow for the scattered fluorescence photon; The focus blur caused by the scattered excitation beam. (D) The scheme of the confocal fluorescence imaging; The color arrows stand for the same as in (C). (A) Reproduced with permission [12]. Copyright 2016, Society of Photo-Optical Instrumentation Engineers (SPIE). | |
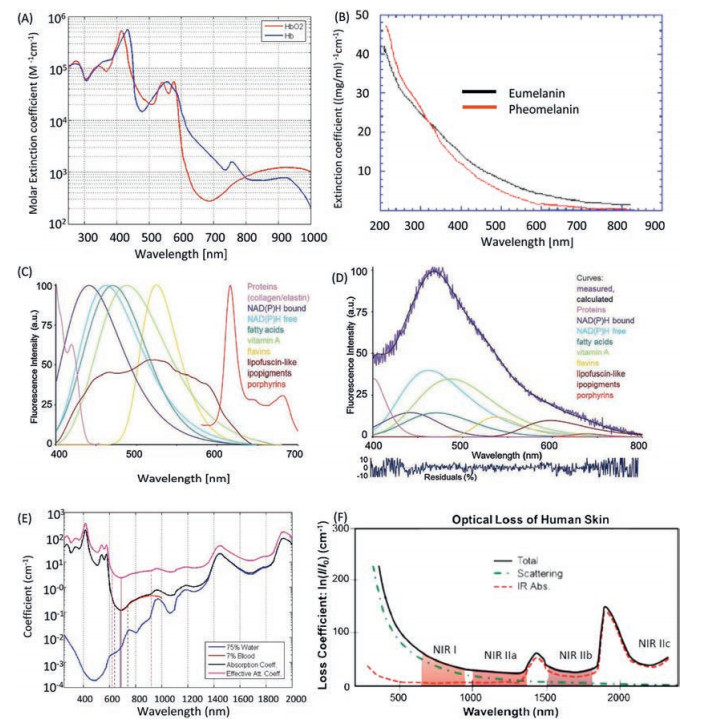
Besides the scattering induced noise, the autofluorescence from the biological molecules would bring another source of noise to biological imaging [13]. Light experiences a dramatic absorption by the biological molecules, especially in the visible range, for instance a huge absorption band around 530 nm could be observed for haemoglobin and oxyhaemoglobin [14], the melanin exhibits a broad absorption band extends to 700 nm (Figs. 2A and B) [15-17]. As a consequence, a high autofluorescence could be observed while biological imaging as unexpected background (Figs. 2C and D) [18]. Furthermore, water as the fundamental molecule of life on earth exhibits a huge overtone absorption in the visible and NIR region (Fig. 2E) [19]. The total attenuation of light through human skin tissue has been record from visible to NIR region, including the scattering and absorption effects (Fig. 2F) [20]. According to the total attenuation of the light in biological materials, the low attenuation region could be assigned as NIR-I region from 700 nm to 900 nm, the NIR-IIa from 1000 nm to 1300 nm, NIR-IIb from 1500 nm to 1700 nm, and even NIR-IIc from 2200 nm to 2500 nm. The definition of NIR spectrum region varies from subject to subject [21]. Herein, we define the NIR light from 700 nm to 2500 nm.

|
Download:
|
| Fig. 2. (A) The molar extinction coefficient (EC) of haemoglobin (blue curve) and oxyhaemoglobin (red curve). (B) The mass extinction coefficient of eumelanin (black curve) and pheomelanin (red curve). (C) Typical spectral profiles of autofluorescence emission from single endogenous fluorophores. Spectra were normalized to the maximum emission peak, except for the broad emission of lipopigments. Excited at 366 nm. (D) Real measured spectrum and calculated curve as the sum of the endogenous fluorophore contributions. (E) The blue curve is the water absorption coefficient (unit as cm-1) scaled by 0.75, the black curve is the total absorption coefficient of arteries; the absorption coefficient of blood scaled by 0.07. (F) The total loss coefficient of light by human skin. The red curve is the total absorption. The green curve is from the scattering and the black curve is total attenuation. (A, B) Reproduced with permission [18a] by Prof. Steven Jacques. (C, D) Reproduced with permission [18b]. Copyright 2015 Carlo Pellicciari. (E) Reproduced with permission [18c] by CC BY-SA 3.0. (F) Reproduced with permission [20]. Copyright 2019, Springer Nature Switzerland AG. | |
In order to obtain high signal background ratio (SBR) image through scattering tissue, the long wavelength imaging (NIR light imaging) is necessary as the lower scattering and autofluorescence background in NIR region. Long excitation wavelength imaging techniques have already been proposed for decades, for instance the laser scan multiphoton microscopy [22]. In recent, by using excitation beam around 1700 nm, a through skull three photon in vivo neuron image have been recorded for about the depth of 500 um [23, 24]. On the other hand, to extend the fluorescence wavelength to NIR region would greatly benefit the imaging system, for which the imaging quality is dominantly determined by the fluorescence wavelength, for instance wide field fluorescence microscopy. The long wavelength NIR imaging is able to reveal the function and structure of the deep tissues, such as neuron communication and diagnosing tumor margin.
NIR fluorophores are crucial to the application of the NIR fluorescence imaging. The NIR-I dyes have been intensively studied like centuries ago, especially for cyanine dyes. The most famous ICG dye (indocyanine green) approved by FDA for clinical application is one kind of the cyanine dyes [25], which significantly benefits the surgeons while distinguishing the tissue margins. In addition, NIR-I fluorescent proteins have been engineered into genetically encoded sensors to report signalling activities. Imaging in even lower scattering and autofluorescence wavelength region, NIR-II imaging, is proposed about 10 years ago as the development in the fluorescence material science [26]. In last ten years, a various of NIR-II fluorophores has been developed, for instance, semiconducting single wall carbon nanotube (SWCNTs), small organic molecules, low bandgap quantum dots and lanthanide doped nanocrystals. Actually, a numerous review has been published on the topic of NIR organic dyes, nanoparticles [20, 25, 27]. Herein, we systematically summarized the fluorescence mechanism of NIR fluorophores, proteins engineering strategies for NIR proteins and their biological applications.
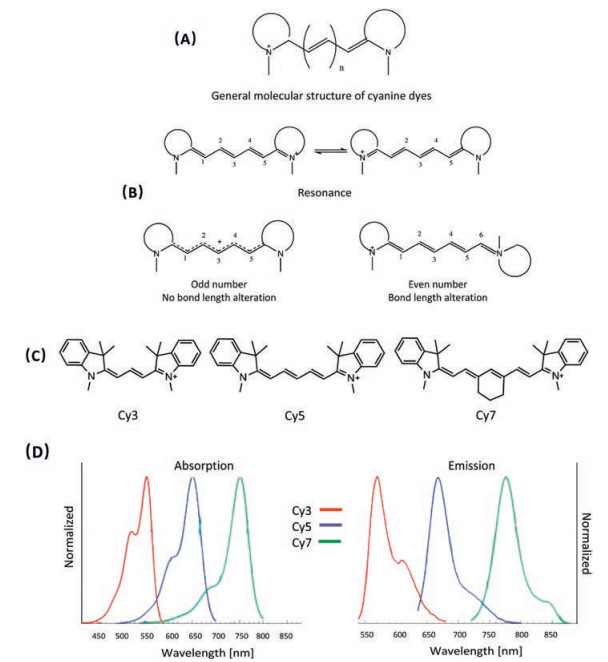
2. NIR organic dyes 2.1. Cyanine dyesCyanine dyes are one of the most well-developed organic dyes, which are features as high molar extinction coefficient, reasonable fluorescence quantum yield and relatively narrow absorption band [28, 29]. The general molecular structure of cyanine dyes is comprised by two nitrogen-containing heterocycles linked over a polymethine bridge with odd number of methine carbons (Fig. 3A). The number of methine carbons in the bridge is crucial for achieving the excellent electronic properties of cyanine dyes [30, 31]. Only the molecule with odd number of methine carbons possesses distinct optical properties, as the resonance geometries of such molecule are indistinguishable. In other words, all the carbon-carbon bonds of the polymethine bridge are almost identical, thus, no observable bond length alternation (BLA) (Fig. 3B) [32]. As a consequence, extraordinary electronic properties could be observed for cyanine dyes. For instance, the electron transition energy of cyanine dye could be gradually decreased by increasing the length of the polymethine bridge [33]. The absorption and emission maximum of cyanine dyes would be red shifted by around 100 nm as extending the polymethine chain by every two carbons (Figs. 3C and D). The electronic structure of cyanine dyes could be successfully described by simple onedimension particle in box quantum mode, which indicates that the corresponding spectrum could be continuously red shifted if there is no bond bending or twisting [32]. All the mentioned properties could not be realized by even number of polymethine carbons, for which the characteristic of double and single bond alternation is evident (Fig. 3B). Besides the excellent optical properties, the low toxicity and high biocompatibility further make cyanine dyes to be one of the most attractive platforms for biological and medicinal applications [27, 34-36].

|
Download:
|
| Fig. 3. (A) The general molecular structure of cyanine dyes. (B) The resonance geometries and the bond length of odd number and even number molecules. (C) The molecular structures of Cy3, Cy5 and Cy7. (D) The corresponding absorption and emission spectra of Cy3, Cy5 and Cy7 in DCM. | |
2.1.1. Fluorescent contrast agent
As early as 1960s the indocyanine green (ICG, one kind of cyanine dye) was tested for clinical treatments. Later on, the US Food and Drug Administration (FDA) approved ICG as a kind of NIRfluorophore for medical application [36]. As other cyanine dyes, the ICG is constructed of two nitrogen-containing heterocycles: benzindole and a heptamethine linker, as shown in (Fig. 4). The introducing of two sulfonate group would dramatically increase the water solubility and biocompatibility of ICG. Taking the advantage of heptamethine linker and the electron rich benzindole units, the ICG exhibits a strong NIR absorption with maximum about 785 nm in methanol (molar extinction coefficient 204, 000 L mol-1 cm-1) and an intensive fluorescence emission with stock shift around 40 nm (quantum yields is about 7.8%) [37]. In addition to the excellent optical properties, the ICG exhibits a strong binding effect to plasma proteins(80% to globulinsand 20% to alpha-lipoprotein and albumin) with bind constant about 5.5 105 L/mol, because of the right hydrophilicity and the aromatic unit of ICG [38]. As a consequence, there is relatively lower leakage for ICG (slower emergence of dye from the vessels, extravasally) in comparison to other fluorophores, like fluorescein [25]. A long bloodstream circulating time up to 20–30 min could be observed. Up to date, an abundant amount of NIR fluorescence imaging tools based on ICG have been developed for clinical application [39-48], such as angiography in ophthalmology, perfusion diagnostics of tissues and organs [48-50], ICG-supported navigation for sentinel lymph node biopsy with tumours (Fig. 4B) [51, 52].

|
Download:
|
| Fig. 4. The biological imaging application of ICG. (A) The molecular structure of ICG. (B) Transcutaneous real-time lymphography for NIR-I detection of the SLN (sentinel lymph node) after injection of ICG (left upper site). The arrows indicate lymphatic vessel and the SLN; (C) The end of the lymphatic vessels with the SLN is marked on the skin for excision. (D) The absorption and emission spectra of ICG in water. (E) The fluorescence of ICG detected by InGaAs camera from 1050 nm to 1650 nm. (F) Brain vessel imaging through skin and skull using 850 nm long pass (LP) NIR-I detection on a silicon camera. (G) Brain vessel imaging through skin and skull using 1300 nm long pass NIR-II detection on an InGaAs camera. (H) Hind-limb vessels imaging through the skin using NIR-I detection. (I) Hind-limb vessels imaging through the skin using NIR-II detection. (J) The intensity across a line of interest for NIR-I imaging. (K) The intensity across a line of interest for NIR-II imaging. (B, C) Reproduced with permission [51]. Copyright 2019, Springer Nature Switzerland AG. (D-K) Reproduced with permission [52]. Copyright 2019, National Academy of Sciences. | |
At present, the clinical application of ICG mainly focus on the first emission peak around 825 nm [53-55], However, the emission shoulder of ICG originated from the high levels vibronic transition could extend up to 1600 nm (low scattering NIR-IIb region) (Fig. 4E). The discovery of the NIR-II fluorescence of ICG shines the light on the clinical translation of NIR-II imaging. As we mentioned at the beginning, the NIR-II imaging would render images much clearer and deeper. An in vivo fluorescence imaging using ICG have been done both in the NIR-I and NIR-II region. The brain vessels are difficult to be resolved through skin and skull using 850 nm long pass filter and a NIR-I silicon camera (Fig. 4F). While switching the detection region to NIR-II by a 1300 nm long pass filter and a NIR-II InGaAs camera, a great image could be recorded with high contrast and resolution (Figs. 4G-J). We believe in the near future the NIR-II clinical fluorescence imaging would be proved by FDA, bring huge benefits to human health care.
Despite the fact that the development of ICG as a fluorescence agent achieves an outstanding success in clinic, the shortage of ICG is evident, such as the poor photostability and low NIR-II emission [56-60]. The design of photostable cyanine dyes is a challenge task, especially for the NIR cyanine dyes, as the long polymethine chain leading to a dramatic photoinduced chemical degradation [61-65]. Several studies have revealed that the introducing of a rigid cyclohexenyl ring into the polymethine bridge would significantly enhance the photostability of cyanine dyes [66-70]. Furthermore, in order to extend the emission wavelength to even lower light scattering region (longer emission wavelength), a series of cyanine dye have been developed via modifying the heterocycle groups and introducing cyclohexenyl into the bridge [71-80], as shown in Fig. 5. As we discussed, the longer the polymethine bridge the redder absorption is expected for cyanine dyes. As a matter of fact, the methine carbon numbers of the most reported cyanine dyes is no more than 7, which might from the concern that the long polymethine would lead to a low fluorescence quantum yield via the fast photoisomerization quenching path.

|
Download:
|
| Fig. 5. The representative NIR cyanine dyes and the targeting units of RGD peptide, phosphonate groups. | |
The dye molecules aforementioned could cause a dramatic nonspecific binding to tissues via the hydrophobic-hydrophilic interaction, static electric interaction or van der Waals interaction, which will introduce a huge background signal in comparison to the region of interest. A various of functional cyanine dyes have emerged to overcome such an undesired background noise [81-84]. These functional cyanine dyes are capable of targeting specific tissues to reduce the background interference. By the targeting imaging, the signal to background ratio could be significantly enhanced. For instance, targeting domains (antibodies, RGD peptides) are conjugated to the dye for enhancing the signal to background ratio [85]; the phosphonate groups have been introduced for specific labelling the bone [86], labelling the lipid rich atherosclerotic [87] and amyloid plaques (in Alzheimer's disease) [88, 89], etc.
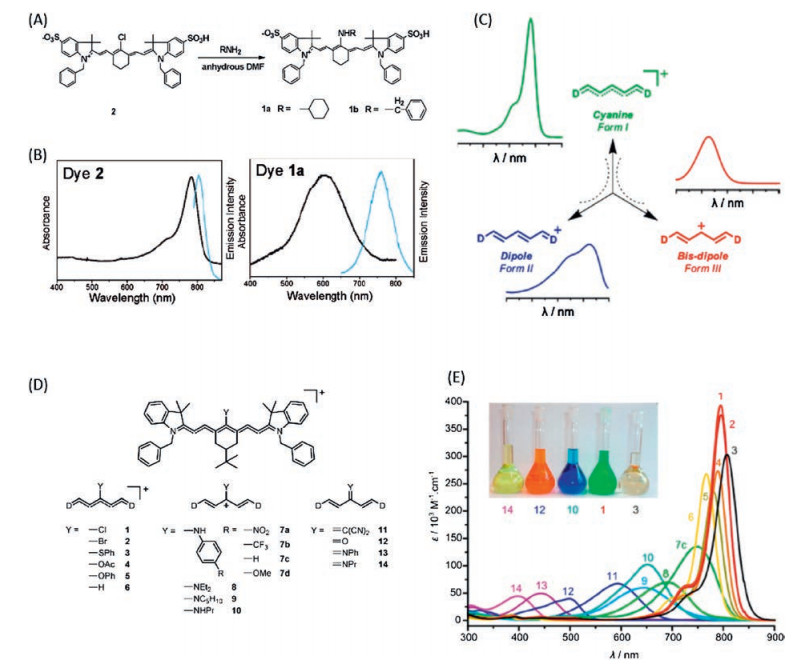
2.1.2. Fluorescent ion probesThe traditional cyanine dyes as a kind of excellent fluorescence contrast agent remarkably advance the application of the molecular imaging on biological research and clinical application. However, the static fluorescence intrinsically limits the application of cyanine dyes on monitoring the dynamic processes of life, for instance, one of the most important phenomena of life: the Ca2+ concentration variation during the neuron activities [90-94]. Recently, a novel cyanine derivative has been developed by substituting the chlorine atom of chlorocyclohexenyl heptamethine cyanine to an amino group, namely aminocyanine (Fig. 6A) [95]. The tiny change in the geometry substantially alters the electronic structure of the cyanine dye, resulting in degeneration of the photo-properties of heptamethine cyanine dyes, such as switching the NIR absorption (783 nm) and emission (783 nm, 803 nm) to red absorption and NIR emission (602 nm, 757 nm) (Figs. 6A and B) [95]. A large Stokes shift is introduced for the aminocyanine dye (about 157 nm) which is attributed to the broken of the pie n-conjugation symmetry (a so called bis-dipole electronic configuration reached) (Fig. 6C) [96, 97]. In spite of the less attractive absorption wavelength of aminocyanine dye, the largestocksshift rendersthem favourablefor fluorescenceimaging as the clear separation of the excitation photon from the collection photon. Moreover, an exciting phenomenon have been discovered as the electronic properties of aminocyanine dye could be finely tuned by the electron density of the amino group, which inspires the design of direct ionic sensing fluorophore based on such molecular scaffold (Figs. 6D and E) [96].

|
Download:
|
| Fig. 6. The photo-properties of aminocyanine dyes. (A) Synthetic scheme for the heptamethine cyanine dye, 1 the aminocyanine dye, 2 chlorocyclohexenyl cyanine dye. (B) The absorption and emission spectrum of the heptamethine dye in water. (C) Three electronic configurations of polymethine dyes and their respective absorption profiles. (D) A series of structures of the heptamethine dyes with gradually modified electronic properties. (E) The absorption spectra of the corresponding heptamethine dyes in dichloromethane at room temperature. (A, B) Reproduced with permission [94]. (C-E) Reproduced with permission [95]. Copyright 2019, American Chemical Society. | |
Most of the reported metal ion sensing fluorophores, such as the fluorescence protein [98-101] and the calcium green [102, 103] are based on the ion-host coordination process. As we know, the coordination binding process is reversible (despite, in some cases, the binding constant is too large). Therefore, the ion sensors based on such approach, with the promise of being able to indicate the dynamic variation of ions, are considered to be an excellent tool for monitoring the biological process, for instance, the Ca2+ concentration variation during neuron activity. As other ion sensing fluorophores, the ion coordination unit is necessary and introduced to modify the amino group of aminocyanine dye (Figs. 7A and B) [104-106]. The binding of the metal ions will significantly affect the electronic structure of the host molecules to render a reasonable change on their absorption or fluorescence properties [107-109]. Two sensing mechanism have been proposed to rationalize the sensing process. One is referred as to the photon-induced electron transfer (PET) process which involves an electron transfer either from the excited state cyanine p-conjugated backbone (namely ESC) to the coordination unit or vice versa. Electron transfer direction depends on the energy of HOMO and LUMO of each other, as shown in Fig. 7. In Fig. 7C, the electron transfers from the HOMO orbital of the coordination unit to that of the ESC, as the electron energy is higher for the former. In Fig. 7D, the LUMO electron of the ESC could transfer to the LUMO orbital of the coordination unit. Both electron transfer processes result in a significant fluorescence quenching of the cyanine dye. The binding with metal ions introduces a vital influence on the electronic structure of the coordination sites (Figs. 7E and F). The PET is hindered by the chelation with metal ions; as a consequence the fluorescence is recovered. In Figs. 7G-J, the electronic configuration is not favourable for PET at free status, whereas, coordination makes the electron transfer capable, the sensor exhibits as fluorescence off. The other one is so called the excited state intramolecular charge transfer (ICT) (Figs. 7K and L). The amino group is characterized as an electron rich donor and the cyanine backbone is functioned as electron acceptor. The binding of metal ions could reduce the electron donation capability of the amino group, therefore, a significant change on absorption and emission spectrum could be observed (could be explained by the bis-dipole mechanism, Fig. 6C).

|
Download:
|
| Fig. 7. The metal ion sensing mechanism of cyanine dyes. (A) Molecular geometry of cyanine dyes with metal ion coordination unit. (B) Cyanine dye binding with metal ioncalcium ion as an example. (C) PET direction without calcium ion binding, from the coordination unit to the cyanine dye backbone, fluorescence quenched. (D) PET direction without calcium ion binding, from the cyanine dye backbone to the coordination unit, fluorescence quenched. (E) PET direction with calcium ion binding, electron transfer from the coordination unit to the cyanine dye backbone inhibited, fluorescence on. (F) PET direction with calcium ion binding, electron transfer from the cyanine dye backbone to the coordination unit inhibited, fluorescence on. (G) PET direction without calcium ion binding, electron transfer from the coordination unit to the cyanine dye backbone inhibited, fluorescence on. (H) PET direction without calcium ion binding, electron transfer from the cyanine dye backbone to the coordination unit inhibited, fluorescence on. (I) PET direction with calcium ion binding, from the coordination unit to the cyanine dye backbone, fluorescence quenched. (J) PET direction with calcium ion binding, from the cyanine dye backbone to the coordination unit, fluorescence quenched. (K) Intramolecular charge transfer (ICT) from the electron rich unit to the electron acceptor unit, without calcium ion binding. (L) Intramolecular charge transfer (ICT) less preferred as the electron density reduced by calcium ion binding. | |
Actually, both PET and ICT mechanism are induced by the regulation of the electron density on the amino group. Therefore, it is hard to differentiate each other just from the molecular structure. For instance, probe A [110] and probe B [109] are similar both on the cyanine backbone and on the coordination unit. Probe A is considered as a PET responsive sensor, whereas probe B undergoes an ICT process (Fig. 8).

|
Download:
|
| Fig. 8. The molecular structures with PET and ICT mechanisms. For probe A, a PET mechanism observed, the bis(2-((2-(ethylthio)ethyl)thio)ethyl) amine (BETA) acts as the electron donor as shown in Fig. 7C. The BETA could bind with a few metal ions, especially for Cu+. The binding with Cu+ would alter the electron density of BETA, as a consequence, the PET process is inhibited, fluorescence is switched on, as shown in Fig. 7E. For probe B, an ICT process observed, the dithia-dioxa-monoaza macrocycle as electron rich unit. The binding of metal ions would reduce the electron density of the macrocycle (the electronic structure will change from bis-dipole to cyanine), as a consequence, the absorption shifted from 695 nm to 860 nm. | |
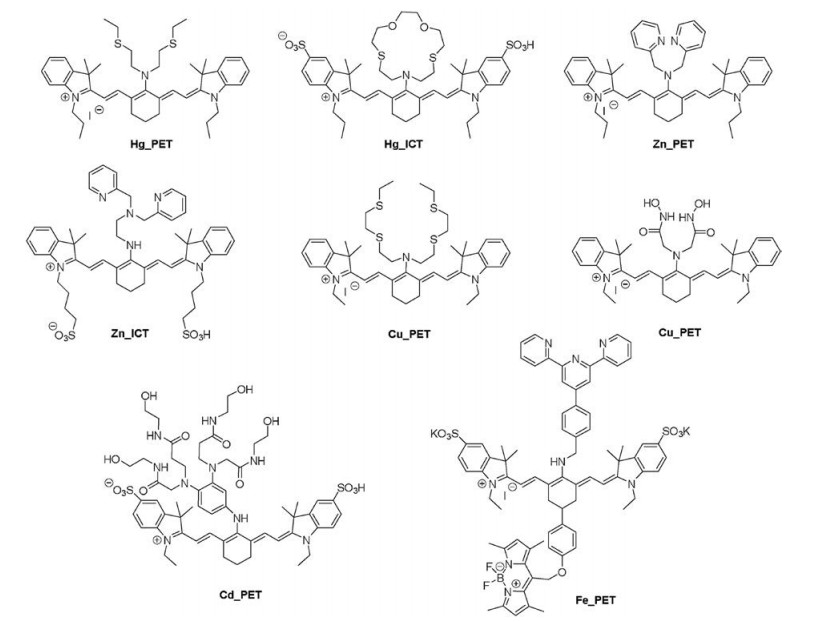
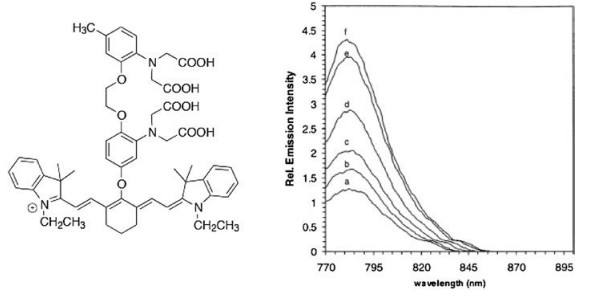
A great amount of ion sensors has emerged basing on the PETor ICT mechanism, such as Hg2+ [108], Cd+ [111], Zn2+ [112, 113], Cu2+, Cu+ [114], Fe2+ [115] (Fig. 9). Calcium ions as one of the most important ions for neuron activity and cardiomyocytes action play an important role for basic biological research [116]. The organic calcium sensors were developed since century ago, for instance the most famous calcium green sensors. However, most of the currently developed calcium sensors are only responsive in the visible region. There are intrinsic difficult for sensing Ca2+ via coordination binding approaches, because the binding effect is too weak for non-transition metals. A NIR Ca2+ was designed recently, the bis(2-aminophenoxy)ethane-N, N, N', N'-tetra acetic acid (BAPTA) unit as calcium binding site [117] (Fig. 10). The fluorescence of the free sensor is quenched by the BAPTA unit due to the photoinduced electron transfer (PET). However, the binding with Ca2+ would induce a dramatic fluorescence switch on effect (almost 4-fold fluorescence increasement at pH 7.2, 100 mmol/L MOPS). In comparison to the visible Ca2+ sensors, like calcium green, there is a long way to catch up for the performance of the NIR Ca2+. Other Ca2+ binding unit like ETH129 ionophore or a stronger conjugation interaction between coordination unit and the cyanine dye, might be necessary for developing large dynamic range calcium NIR sensor.

|
Download:
|
| Fig. 9. The molecular structures of various metal ion sensors based on the PET or ICT mechanism. | |

|
Download:
|
| Fig. 10. The molecular structure of Ca2+ sensor and the corresponding fluorescence emission spectrum variation as a function of Ca2+ concentration. (a) 0 nmol/L; (b) 75 nmol/L; (c) 150 nmol/L; (d) 300 nmol/L; (e) 650 nmol/L; (f) 39.8 μmol/L. All solutions contained 100 μmol/L KCl and at pH 7.2 (100 μmol/L MOPS). Free Ca2+ concentrations adjusted by mixing 10 μmol/L of CaEGTA and 10 μmol/L EGTA in different ratios. Excited at 760 nm. Reproduced with permission [116]. Copyright 2019 Elsevier. | |
2.2. Cyanine-like dye
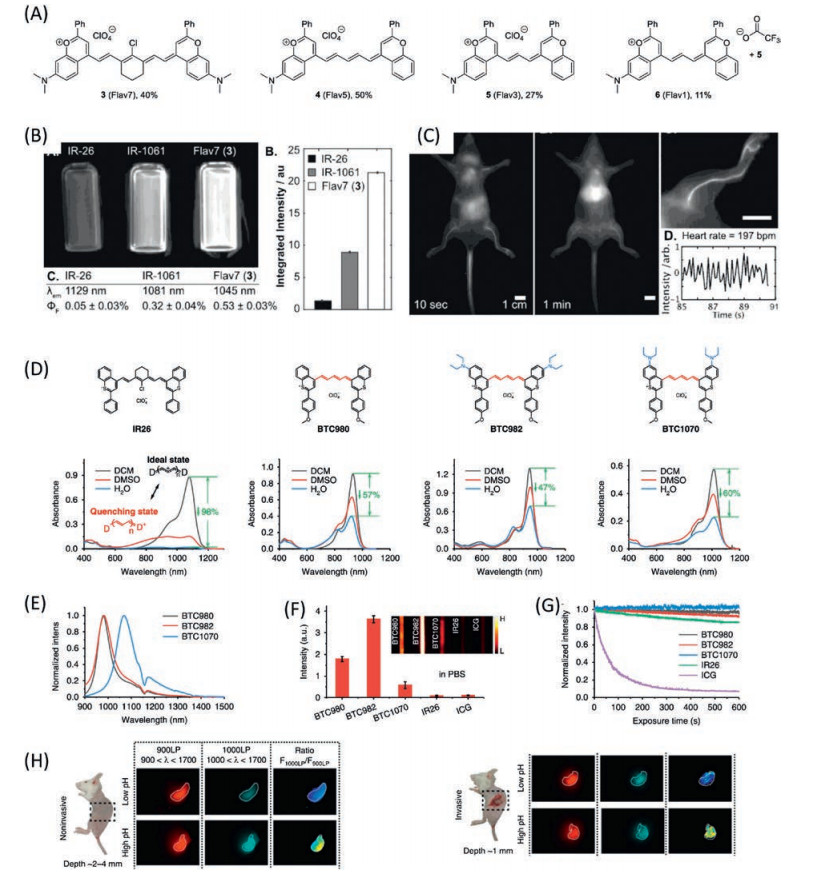
Here we define the cyanine-like dye as a kind of dye that is also comprised with two heterocycle rings and a polymethine bridge, instead of nitrogen heteroatom for cyanine dye, oxygen or other chalcogens heteroatoms involved for this kind of dye, as shown in Fig. 11. The cyanine-like dyes exhibit similar electronic properties as cyanine dyes, for instance extending the polymethine bridge or enriching the electron density on the heterocycle would gradually red shift the corresponding absorption maximum [33, 118]. However, the chalcogens heteroatoms would result in electron rich heterocycles; as a consequence, the transition energy would be much lower in comparison with cyanine dyes with the same polymethine bridges [33, 119, 120]. For example, IR26 with heptamethine bridge exhibits a strong absorption in NIR-II region with maximum around 1070 nm, and reasonable fluorescence quantum yield (Fig. 11B). A series of flavylium polymethine dyes have been developed by introducing amino group on the heterocycle to enrich the electron density [121] as shown in Fig. 11A. It was found that the 5- and 7-methine dyes exhibit exceptional brightness (the molecular extinction coefficient times the emission quantum yields (QY)) in their respective spectral regions (Flav5 emission at 908 nm, Flav7 emission at 1045 nm). A deep and clear NIR-II blood vessel image have been recorded by a micelle formulation of the Flav7 in mice (Fig. 11C). The similar strategy has been applied to develop the sulphide heterocycle polymethine dyes: bezothiopyrylium polymethine dyes [122] (Fig. 11D). Since the further electron enrichment of the sulphide compared to oxygen, the bezothiopyrylium with 5-polymethine bridge exhibits the similar transition energy as the Flav7, 1014 nm and 1045 nm respectively. Taking the advantage of the shorter polymethine bridge, an extraordinary photostability and anti-quenching in water solution have been observed for BTC1070 (Figs. 11E-G). A pH sensing probe based on the BTC1070 has been studied, and an in vivo imaging of the mice stomach was recorded (Fig. 11H). The cyanine-like dyes are considered to be one of the most promising small molecular NIR-II fluorophores. Even though, a significant improvement on the design of NIR-II cyanine-like dyes have been made, the brightness of those dyes is still not in the same stage as the cyanine dye (few hundreds to tens of thousands). A high electron rich heterocycle and a short polymethine bridge might be the reasonable structure for obtaining the stable and bright NIR-II small organic dyes.

|
Download:
|
| Fig. 11. The molecular structure of cyanine-like dyes and the corresponding molecular imaging. (A) The dimethylamino flavylium polymethine dyes. (B) Image of vials of IR- 26, IR-1061, and Flav7 with matched optical density at 808 nm in dichloromethane, excited at 808 nm and collected from 1000 nm to 1600 nm (absolute quantum yields). (C) Images of nude mouse following tail-vein injection of Flav7 micelles with 808 nm excitation and collection from 1000 nm to 1600 nm at 9 frames per second. Intensity versus time plot of signal from the heart region. (D) Chemical structure and absorption spectra of bezothiopyrylium dyes and IR26 in dichloromethane (DCM), dimethyl sulfoxide (DMSO) and H2O (phospholipid micelle formation). (E) Normalized fluorescence spectra of BTC980, BTC982, and BTC1070 in DCM. (F) NIR-II (1000–1700 nm) brightness comparison of equimolar (10 μmol/L) BTC980, BTC982, BTC1070, IR26, and ICG in PBS (pH 7.4). (G) Photostability comparison of all fluorophores (5 μmol/L) in PBS (pH 7.4) under continuous-wave laser exposure (ICG: 808 nm, BTC980: 915 nm, BTC982: 940 nm, BTC1070 and IR26: 1064 nm) at a fluence rate of 2.3 W/cm. (H) In vivo ratiometric fluorescence imaging of gastric pH. (A–C) Reproduced with permission [120]. Copyright 2015 Wiley Publishing Group. (D–H) Reproduced with permission [122]. Copyright 2019, Springer Nature Switzerland. | |
2.3. Hemicyanine dye
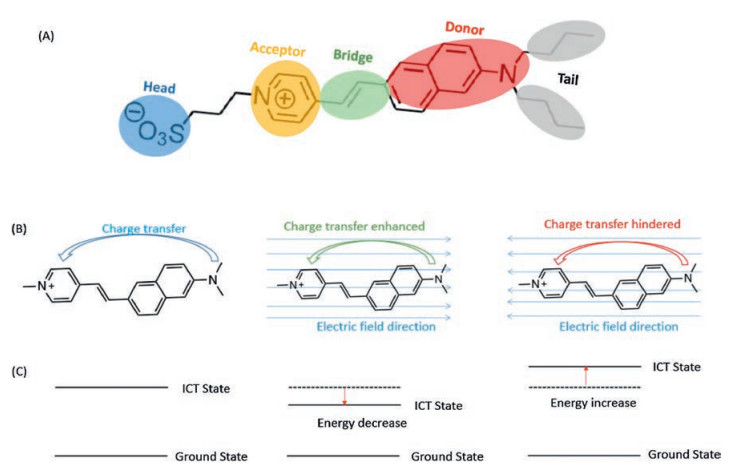
Hemicyanine dye is also known as styryl dye, which is characterized by a nitrogen-containing heterocycle and an amino group linked via π-conjugated bridge [123, 124], as shown in Fig. 12. The amino group at one extremity plays a role as electron donor due to the electron rich character. The nitrogen-containing heterocycle with a positive charge acts as the electron withdrawing group (electron acceptor). The photo-properties of hemicyanine dyes are characterized by a significant feature of ICT, like the broad structureless absorption and a great Stocks shift emission. Besides, the ICT feature, the hemicyanine dye possesses a distinctive electronic property which is referred as to Stark effect, also known as electrochromism [125-127]. In the present of external electric field, the optical properties of hemicyanine dye undergoes a dramatic alternation, for instance the emission spectrum shifting as a function of the external electric field intensity and direction (Fig. 12). In general, the electrochromic dye is called as voltage sensitive dye (VSD). The voltage sensitivity of hemicyanine dye provides a promising approach for directly sensing the action potential of neuron activity [128-130].

|
Download:
|
| Fig. 12. (A) The molecular structure of di-4-ANEPPS, a typical hemicyanine dye for action potential recording. (B) The charge transfer from the donor to acceptor (left), the charge transferprocessis enhanced as the charge transfer direction along the electric field direction(middle), the chargetran sferprocess is hinderedas the directionopposite to the electric filed direction (right). (C) the corresponding electronic structure of the molecular status of (B). | |
The small-molecule and genetically encoded calcium sensors are well-established and most popular approaches for monitoring the neuronal circuit behaviour [102]. However, the concentration variation of calcium ions corresponds to an indirect indication of neuronal activity, which is an intrinsically slow response to the transient membrane potential dynamics (action potential) [100]. Directly recording the action potential is considered to be the most ideal way to study the neural circuits, as the instant response to the neuron activity [131-133]. The electrode-based action potential determination has proven to be a powerful tool in fast recording the neural activity. Nevertheless, the physical size of electrode renders the observation of large amount of neuron activities impossible [134]. The simultaneous measurement of ensemble neurons with a high temporal and spatial resolution is vital for deeper understanding of the neuron activity. To this end, optical fluorescence imaging based on the electrochromic dyes was proposed to monitor the ensemble neuron communication [135]. Since the interaction between electrochromic dye and the external electric field is instantaneous (the absorption happens in less than femtosecond and the fluorescence emission lifetime about nanoseconds) [136], the electrochromic dyes are capable to indicate the action potential in phase. In comparison to the traditional electrode-based methods and Ca2+ sensors, the fluorescence imaging based on electrochromic dye could provide high spatial and temporal resolution for neuron study [128, 137]. In order to realize the transmembrane potential sensing, a careful molecular engineering in the design of electrochromic dye is necessary. Besides the design of the electronic structure of the D-π-A chromophore scaffold, the amphiphilicity of electrochromic dye plays another vital role on successfully probing the neuron activity [138-140]. For the sake of sensing transmembrane potential, the electrochromic dye should be properly inserted into the membrane double layer, with the right orientation. Therefore, the reasonable design of the electrochromic dye in the application of membrane potential detection should mimic the phospholipid geometry, constructed by a hydrophilic head and a hydrophobic tail (Fig. 13).

|
Download:
|
| Fig. 13. The orientation of electrochromic dye in the membrane double layer and the molecular engineering of the electrochromic dye. | |
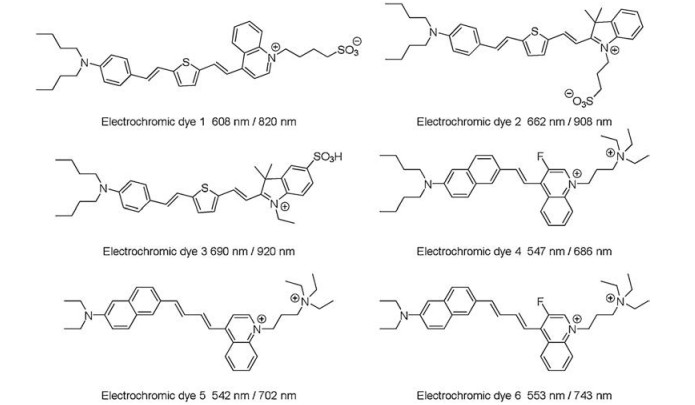
The development of electrochromic dyes significantly advances our understanding of the neuronal electrical events and communications [141-143]. Hemicyanine dyes as the most attractive electrochromic dye have been well developed in last few decades [127, 140, 144-146]. The ANEPPS as shown in Fig. 12, is the most famous electrochromic dye that was designed by L. Loew et al.[147], which is capable to monitor the action potential instantaneously. Since the flexibility in composition of D-π-A units of hemicyanine dyes, a few NIR electrochromic dye have been developed in last few decades [138, 140] as shown in Fig. 14. In order to extend the emission spectrum of electrochromic dye to NIR region, a thiofuran unit was introduced into the π-conjugated bridge [140]. The introducing of thiofuran would significantly lower the emission energy of the electrochromic dyes. For example, the electrochromic dye 1 (Fig. 14) exhibits an absorption and emission maximum around 608 nm and 820 nm respectively, and the corresponding fluorescence intensity change (ΔF/F) per 100 mV is about 6% at 820 nm [140]. A series of fluorinated electrochromic dyes have been developed by Loew et al. [138]. The introducing of the fluoride is able to significantly enhance the photostability of the dye and obtain red shifted emission, for instance, the fluorinated dye — electrochromic dye 6 with absorption and emission maximum around 553 nm and 743 nm respectively. However, the electrochromic dye 5 without fluoride substitution, the emission maximum is blue shifted to 702 nm. A direction comparison on the response time of the neuron activity between the calcium probes and the electrochromic dye have been performed on a mouse acute cortical brain as shown in Fig. 15. The calcium signal exhibits a big overlap between two close fired action potential (Fig. 15B), however the electrochromic dye could reveal an unambiguously differentiation of such a shortly fired pulse. In spite of the exciting results observed by the electrochromic dye on the in vitro neuron activity, a few drawbacks have to overcome before it could be applied for in vivo neuron study with high single to noise ratio. Firstly, only the electrochromic dyes that inset into the membrane bilayer are able to contribute to sense the neuron activity. All the dyes that either adsorbed on the cell membrane surface or endocytosis into the cell would lead to a huge background fluorescence. Secondly, the best action potential response electrochromic dye reported so far exhibits a fluorescence variation about 50% in ΔF/F per 100 mV [127], which is relatively small in comparison to the calcium responsive dyes (Fluo-3 about 200 folds change)[116, 148]. The VSDs based on other mechanisms have also been studied, like electric field induced redistribution or reorientation [128, 149], photoinduced electron transfer (PeT) [150, 151]. Those processes are not going to be reviewedherein, as the response time of such VSDs areslower than electrochromic dyes.
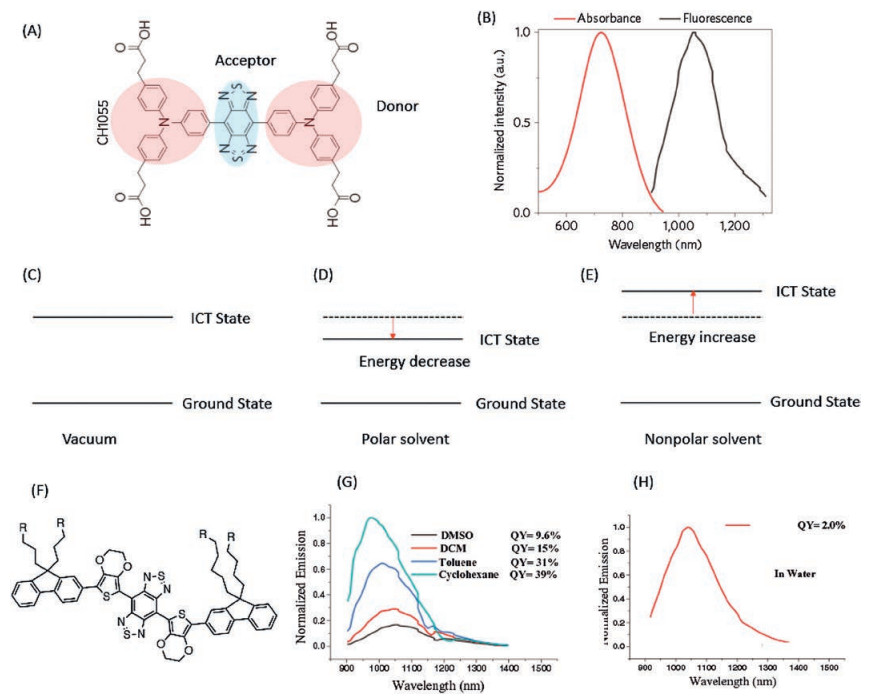
2.4. DAD dyesDonor-Acceptor-Donor (DAD) molecules are a novel kind of dyes developed with emission maximum in the NIR-II region. As the Donor-Acceptor dyes mentioned above, the DAD dyes are also characterized by a population of ICT state while being photoexcited [152]. Therefore, a significant Stocks shift and solvatochromic effect could be observed for DAD dyes, for instance CH1055 with absorption maximum around 750 nm but the emission maximum about 1055 nm in toluene (Figs. 16A and B) [153]. The ICT state is a double-edged sword for the biological imaging with DAD dyes. The ICT character could be able to extend the emission wavelength of DAD dye to the NIR-II region, yet DAD dye becomes very sensitive to the polarity of the environments as the unique electronic properties of ICT state, as shown in Figs. 16C and D [154]. The energyof ICT statecould be significantly stabilized in the polar solvent. As a consequence, the fluorescence of DAD dyes could be dramatically quenched bypolar solvent, especially in the biocompatible aqueous solution. As the solvent polarity varies from the nonpolar solvent cyclohexane to the most polar solvent H2O, the emission maximum of IR-FE red shifted from 980 nm to 1070 nm, meanwhile, the fluorescence quantum yields decreased from 39% to 2% (relative to SWCNT 0.4%) [152], as shown in Figs. 16F-H. As the Hemicyanine dyes, the combination of various donor and acceptor units render a great amount of NIR-II DAD dyes possible, as shown in Fig. 17.
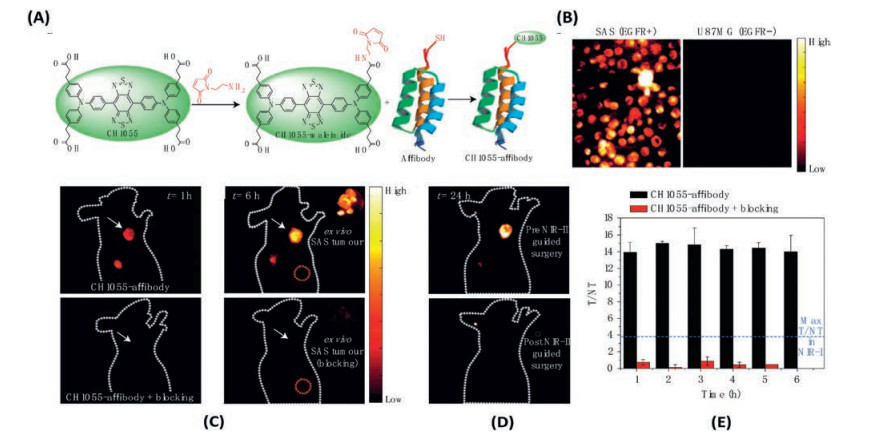
CH1055 is the first NIR-II DAD dye developed by Dai et al., for in vivo biological imaging (Fig. 16A) [153], which is composed by triphenylamine donor unit and benzobisthiadiazole (BBTD) acceptor unit. The strong donor and acceptor effects induce a large Stocks shift about 300 nm of CH1055 (emission maximum around 1055 nm). However, the CH1055 is extremely hydrophobic. In order to make CH1055 biocompatible, a PEGylation reaction has been performed to enhance the water solubility of CH1055. Furthermore, PEGylated CH1055 (CH1055PEG) is capable to be removed from mouse body through renal clearance, nearly 90% excreted within 24 h post injection, with no observable accumulation in the liver (as the relatively small molecular mass 8.9 kDa). A tumor target imaging was performed by conjugating CH1055 to an anti-epidermal growth factor receptor (anti-EGFR) affibody. A high tumour-to-backgroundratiowas observed via CH1055 labelling(as high as 15), which is about 3–5 fold higher than that of ICG antiEGFR (Fig. 18). The huge enhancement in tumor-to-background ratio for NIR-II imaging was due to the lower tissue autofluorescence in NIR-II region and the lower tissue scattering in NIR-II region. The CH1055 reveals the great promising application of DAD dyes on the NIR-II imaging. Nevertheless, the intrinsic intramolecular charge transfer (ICT) properties of CH1055 results in a relatively low fluorescence quantum yield in water about 0.3%. A careful study has been conducted by molecular engineering the DAD dyes (Fig. 16F) [152]. The DAD dyes were designed with the same electron acceptor unit as CH1055 (BBTD), whereas the electron donation effects were tuned by either 4-ethoxylene dioxythiophene (EDOT) or dioxythiophene. Furthermore, dialkylfluorene was introduced on the two extremities as shielding units. The hydrophobic properties of the shielding units in coordination with the dioxyl unit in EDOT effectively prevent the H2O from strongly interacting with the DAD units. A dramatically enhancement of the fluorescence quantum yield in water has been observed (as much as 100-fold enhancement could be realized from DAD12 to DAD10). A very recent study was done by replacing the EDOT with a long alkyl chain thiophene to further enhance the hydrophobic shielding effect and to reduce the intermolecular interaction, DAD3 [155]. A quantum yield of 5.3% has been observed in water. A careful tuning on the electronic properties of the donor and acceptor units, and the shielding units would lead to further improvement on the photo-properties of DAD dyes.
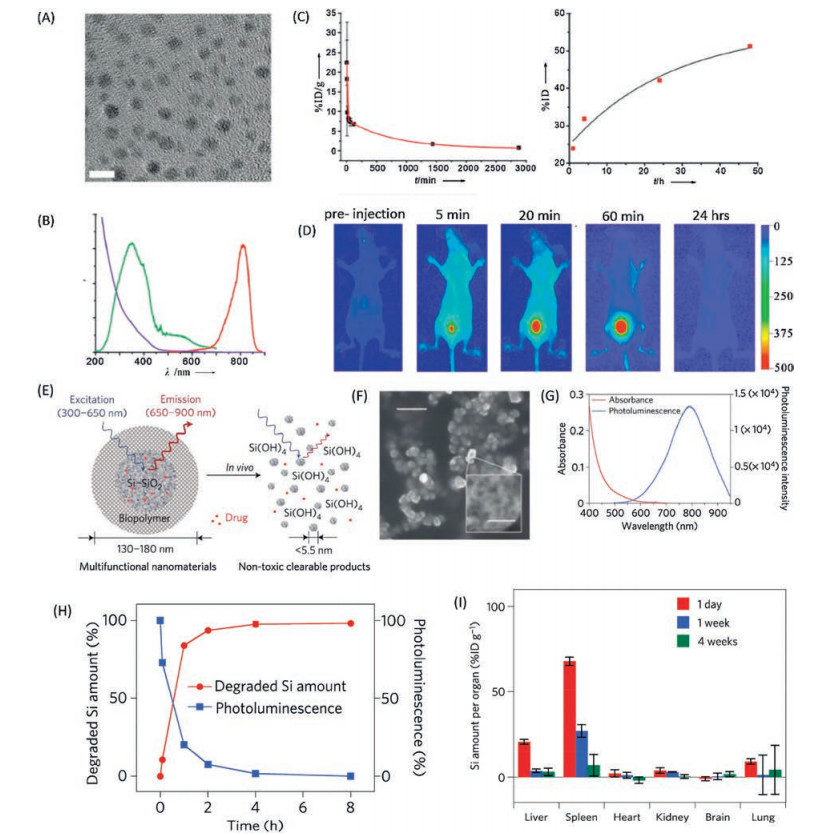
3. NIR nano-fluorophore 3.1. NIR-I nano-fluorophoresApart from the molecular based NIR fluorophores, NIR Nanofluorophores have also been intensively studied, as the relatively high photostability, low photo-blinking, facile preparation processes, etc. [156-159]. At the early stage, the development of the NIR nano-fluorophores mainly focused on the emission maximum in the NIR-I region, such as semiconducting quantum dots, SWCNTs, carbon dots, lanthanide doped nanocrystals, Si nanocrystals, metal nanoparticles [157, 160-162]. For instance, the semiconducting cadmium chalcogenide quantum dots with proper bandgap have the capability to give bright emission in the NIR-I region. However, the high toxicity of such kind of quantum dots render any clinical trial impossible [160, 163]. Several novel low toxic NIR-I Nano-fluorophores have been developed in last few decades, such as the luminescent gold-based nanoparticles and silica based NIR nanoparticles. In general, the gold nanoparticles are characterised by a strong resonance plasmon absorption but no luminescence [164, 165]. Nevertheless, the glutathione-coated gold nanoparticles exhibit a significant luminescence which is stemming from the oxidation state of gold atom in the nanoparticle [166]. A NIR glutathione coated gold nanoparticles have been developed with emission maximum around 800 nm and size about 2.6 nm (Figs. 19A and B). The pharmacokinetics of such kind of nanoparticles are found to be similar as the small molecule contrast agent (t1/2a of 5.0 min, and t1/2b of 12.7 h) [167] (Figs. 19C and D). The renal clearable properties of luminescent gold nanoparticle provide a powerful tool for the study of the kidney dysfunction [168-170]. However, the relatively low emission quantum yield of such nanoparticles in comparison to the small organic fluorophores limits the further clinical application [171]. Besides the luminescent gold nanoparticle, the Si nanocrystalis considered to be one of the most promising NIR-I nanofluorophore for biological application as the quick biodegradation to nontoxic silicic acid [156, 172, 173]. The photoluminescence of Si nanocrystals is proposed to be resulted from the localized defect emission and the emission from the quantum confine effect [174]. As a matter of fact, in most of the case, the localized defect emission is dominant. A porous Si nanoparticle with emission maximum of 900 nm, quantum yield about 10% (rhodamine) and size about 100 nm have been developed for in vivo biological imaging [172] (Figs. 19E-G). It was found that the Si Nanofluorophores could be almost totally degraded within 5 h in the environment of PBS, pH 7.4 (Fig. 19H). There is very small amount of Si could be observed in organs like liver, spleen after 4 weeks of injection (Fig. 19I). These recently developed NIR-I Nano-fluorophores with the capability of fast clearance shows a great potential for clinical translation.

|
Download:
|
| Fig. 14. The molecular structures of representative NIR Hemicyanine dyes. | |

|
Download:
|
| Fig. 15. Simultaneous voltage and calcium imaging of a single dendritic spine. (A) Reconstruction of the segment of proximal basal dendrite (a mouse acute cortical brain slice). (B) The response of Calcium Green Dextran fluorescence to two somatically initiated APs. (C) Simultaneously recorded electrochromic dye 4 (Fig. 14) fluorescence transients. Both dyes are excited with the same two-photon laser 1020 nm. (D) Single-sweep VSD fluorescence. The vertical scale bars in B, C and D correspond to ΔF/F. Reproduced with permission [137]. Copyright 2019, National Academy of Sciences. | |

|
Download:
|
| Fig. 16. The molecular geometry and electronic structures of DAD dyes. (A) The molecular structure of typical DAD dye, CH1055. (B) The absorption and emission spectra of CH1055 in toluene. (C) The ICT state and Ground state energy level of DAD dye in vacuum. (D) The ICT state and ground state energy level of DAD dye in polar solvent, the ICT state energy is much lower in such case. (E) The ICT state and ground state energy level of DAD dye in nonpolar solvent, the ICT state energy is increased in such case. (F) The molecular structure of engineered DAD dye (IR-FE) for high emission quantum yield. (G) The emission spectra and quantum yield of IR-FE in different solvent. (H) The emission spectra and quantum yield of PEGlylated IR-FE in water. (A, B) reproduced with permission [152, 153]. Copyright 2019, Springer Nature Switzerland AG. (F–H) Reproduced with permission [151, 152]. Copyright 2015, Wiley Publishing Group. | |

|
Download:
|
| Fig. 17. The molecular structures of representative DAD dyes. DAD1 [155a], DAD2 [155b], DAD3 [152], DAD4 [155c], DAD5 [155d], DAD6 [153], DAD7 [155e], DAD8 [155f], DAD9 [155g, 155h], DAD10, DAD11, DAD12 [152]. | |

|
Download:
|
| Fig. 18. Tumour imaging with CH1055-anti-EGFR affibody and imaging guided tumour surgery. (A) The synthesis of the CH1055-affibody. (B) Cancer cells imaging; the squamous cell carcinoma (SAS) cell line used for in vivo molecular imaging showed strong selective staining in vitro compared to U87MG cells (low EGFR). (C) NIR-II fluorescence tumor imaging taken 1 h and 6 h after an intravenous injection of CH1055-affibody (60 μg). The upper panel exhibits significant tumour targeting and the bottom panel shows no observable fluorescence (injected with blocking dose, CH1055-affibody plus free affibody). (D) Tumor images of 24h post-injection before and after performing NIR-II fluorescence image-guided surgery. (E) Tumor-to-normal tissue ratios. Reproduced with permission [152]. Copyright 2019, Springer Nature Switzerland AG. | |

|
Download:
|
| Fig. 19. (A) Typical transmission electron microscopy (TEM; scale bar =5 nm) image of GS-[198Au]AuNPs. (B) The absorption (blue), excitation (green), and emission (red) spectra of GS-[198Au]AuNPs in aqueous solution. (C) The time–activity curve (TAC) of GS-[198Au]AuNPs in blood. The pharmacokinetic parameters were determined by fitting the data with a two-compartment model and excretion of GS-[198Au]AuNPs in the urine at 1, 4, 24, and 48 h p.i. (D) In vivo fluorescence imaging of a live mouse after IV injection of GS-[198Au]AuNPs. (E) Schematic diagram depicting the structure and in vivo degradation process for the (biopolymer-coated) nanoparticles used in this study. (F) SEM image of LPSiNPs (the inset shows the porous nanostructure of one of the nanoparticles). The scale bar is 500 nm (50 nm for the inset). (G) Photoluminescence emission and absorbance spectra of LPSiNPs. Photoluminescence is measured using ultraviolet excitation (λ =370 nm). (H) Appearance of silicon in solution (by ICP-OES) and photoluminescence intensity from a sample of LPSiNPs (50 μg/mL) incubated in PBS solution as a function of time. (I) In vivo biodistribution and biodegradation of LPSiNPs over a period of 4 weeks in a mouse. Aliquots of LPSiNPs were intravenously injected into the mouse (n = 3 or 4, dose =20 mg/kg). The silicon concentration in the organs was determined at different time points after injection using ICP-OES. (A–D) Reproduced with permission [166]. Copyright 2015, Wiley Publishing Group. (E–I) Reproduced with permission [171]. Copyright 2019, Springer Nature Switzerland AG. | |
3.2. Carbon nanotubes as NIR-II molecular-imaging agents
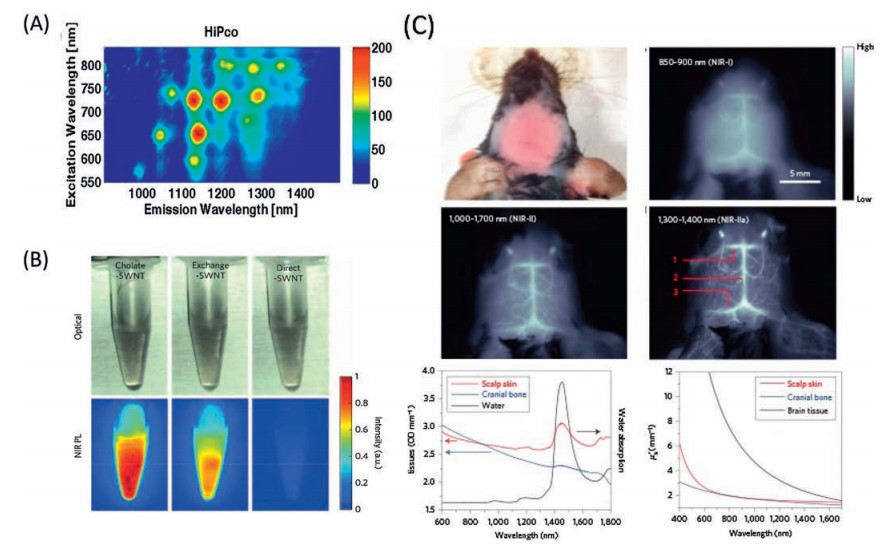
The booming of NIR-II fluorescence imaging was ignited by the application of the photo-luminescence semiconducting SWCNTs to blood vessel labelling [26]. The unique electronic structure of semiconducting SWCNTs leads to a plenty of excitation and emission bands through visible to NIR-II region [175-180] (Fig. 20A). However, the extremely hydrophobic properties of SWCNT inhibit them to be used in biological system. Critical experimental approaches are necessary to make the SWCNTs water soluble and biocompatible. For instance, an ultra-intensive sonicating procedure have been developed to disperse the SWCNT into water at the present of cholate [26]. It was found that the cholate-SWCNT dispersion process is necessary for obtaining a high luminescence intensity of SWCNT in water, as the direct phospholipid–polyethylene glycol dispersion of SWCNT results in significant luminescence quenching; whereas, the exchanging cholate to phospholipid–polyethylene glycol could highly retain the luminescence property of SWCNT (Fig. 20B). An IR800-SWCNT conjugate was developed for direct comparison on the imaging quality between the NIR-I and NIR-II region [181], as shown in Fig. 20C. Aclear brain vesselimage with intactscalp and skull could be reached by selecting the imaging wavelength in the range of the NIR-II luminescence of SWCNT, due to the low autofluorescence and the reduced scattering in the NIR-II region. The study reveals the distinct advantage for the NIR-II imaging over NIR-I imaging. The photoluminescence of SWCNTs presents the promising future of the NIR-II in vivo imaging in the study of animal mode and the health care. However, the intrinsic low luminescence quantum yield limits the further application of SWCNTs.

|
Download:
|
| Fig. 20. The biological imaging of SWCNTs. (A) The photoluminescence of HiPco SWCNTs as a function of excitation wavelength. (B) The luminescence intensity of SWCNTs in water solution by different preparation approaches. (C) The mouse brain vessel imaging with intact scalp and skull. Reproduced with permission [174, 181]. Copyright 2019, Springer Nature Switzerland AG. | |
3.3. NIR-II emissive QDs
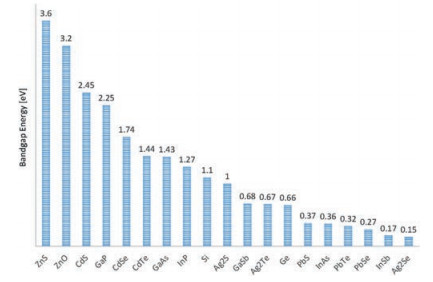
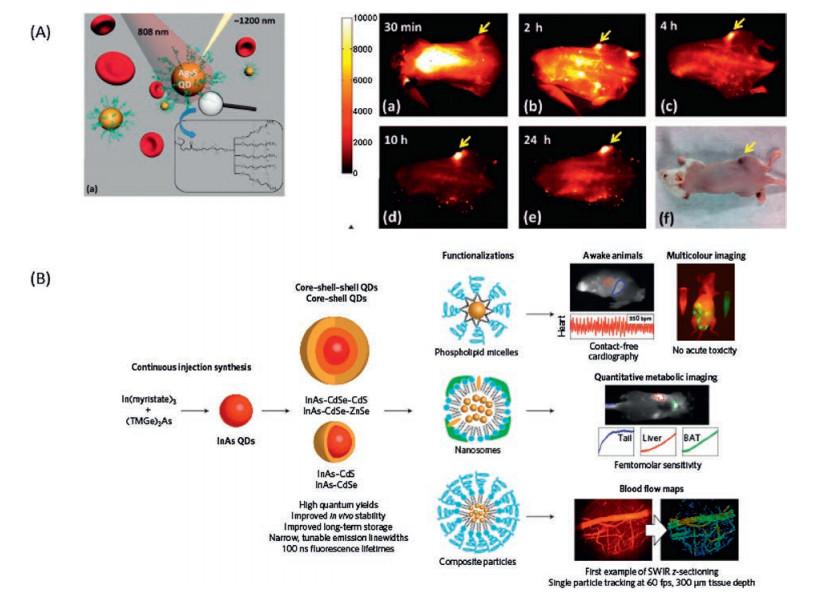
Quantum dots as one of the most distinct fluorophores, have been considered to be excellent probes for biological study since it was discovered [182-184]. The quantum confine effect renders the transition energy of quantum dots finely adjustable via size and shape [185, 186]. A rainbow emission could be facilely prepared by just controlling the reaction time, which is unique over any other fluorophores. Furthermore, the high absorption cross section, emission quantum yield and strong resistance to photobleaching make them to be one of the outstanding fluorescent for biological imaging [187]. The bandgap energy of bulk semiconductor provides the up limit of the transition energy of quantum dots, as by the quantum confine effect, the smaller the size the larger the transition energy [188]. Fig. 21 presents the bulk bandgap of common used semiconductors [189-191]. The CdSe and CdTe with the right transition energy in the NIR-I region, both are the most studied NIR-I quantum dots for biological imaging [160, 163, 192, 193]. However, the toxicity of Cd2+ ions is the main concern for the in vivo application of Cd2+ containing quantum dots. The Ag2S quantum dots are the first developed NIR-II emission quantum dots for NIR-II bioimaging [194-202] (Fig. 22A). Since the silver chalcogenide is much less toxic in the sense of element composition, it holds a promising clinical translation future. A 6-arm PEG coated Ag2S with size about 5.4 nm and emission maximum around 1200 nm was prepared for in vivo mouse model imaging (Fig. 22A). Taking the advantage of the strong NIR-II emission (emission quantum yields about 15%, relative to 0.4% SWCNTs), a high tumor signal to normal tissue background ratio (up to 15) have been achieved by passive tumor targeting. The InAs and PbS are two well established quantum dots with similar bulk band gap about 0.37 eV. In spite of the intrinsic toxicityof the As2+ and Pb2+, the bright luminescence renders them suitable for deep imaging study on animal mode [203-206]. The InAs-CdSe-CdS and InAs-CdSe-ZnS core shell-shell quantum dots were developed with emission maximum around 1300 nm [207] (Fig. 22B). The InAs based quantum dots exhibitsan extraordinarily high emission quantum yields as about 30% versus to the SWCNT 0.1%, which is almost 10 times greater than the Ag2Se and PbS. The InAs based quantum dots was made into larger composite nanoparticle with the help of polymer surfactant and soy bean oil to enhance the circulation time. A high speed and highresolution z section brain vessel in vivo images were able to be acquired by using the InAs composite nanoparticle. A single nanoparticle was successfully recorded at frame rate of 60 Hz (Fig. 22B). To further reduce the light scattering and tissue auto fluorescence, the PbS based quantum dots were developed with emission maximum wavelength around 1600 nm, which correspondingtothe NIR-IIbregionimaging [208].Inordertoinhibitthe fluorescence quenching of the PbS quantum dot while exposed in aqueous environment, an inorganic shell CdS was coated to isolate the PbS emission core from interacting with complex biological environment. An SBR as high as 30 was reached via the PbS@CdS system. From Fig. 21, we could find that there are heavy metal free semiconductors with the right band gap in NIR-IIc region, with the promising for clinical imaging, for instance the InSb. However, a stable and facile quantum dots preparation approaches need to be developed.

|
Download:
|
| Fig. 21. The bandgap energy of bulk semiconductors. | |

|
Download:
|
| Fig. 22. The biological application of represented quantum dots. (A) NIR-II Ag2S quantum dots with branched PEG coating: (a–e) Time course of NIR-II fluorescence images of the same mouse injected with PEG-Ag2S QDs; (f) A white-light optical image of the same mouse at 24 h p.i. (B) A schematic overview of the synthesis of core–shell and core. (A) Reproduced with permission [195]. Copyright 2019, Springer Nature Switzerland AG. (B) Reproduced with permission [202]. Copyright 2019, Springer Nature Switzerland AG. | |
3.4. Lanthanide doped NIR-II nanocrystals
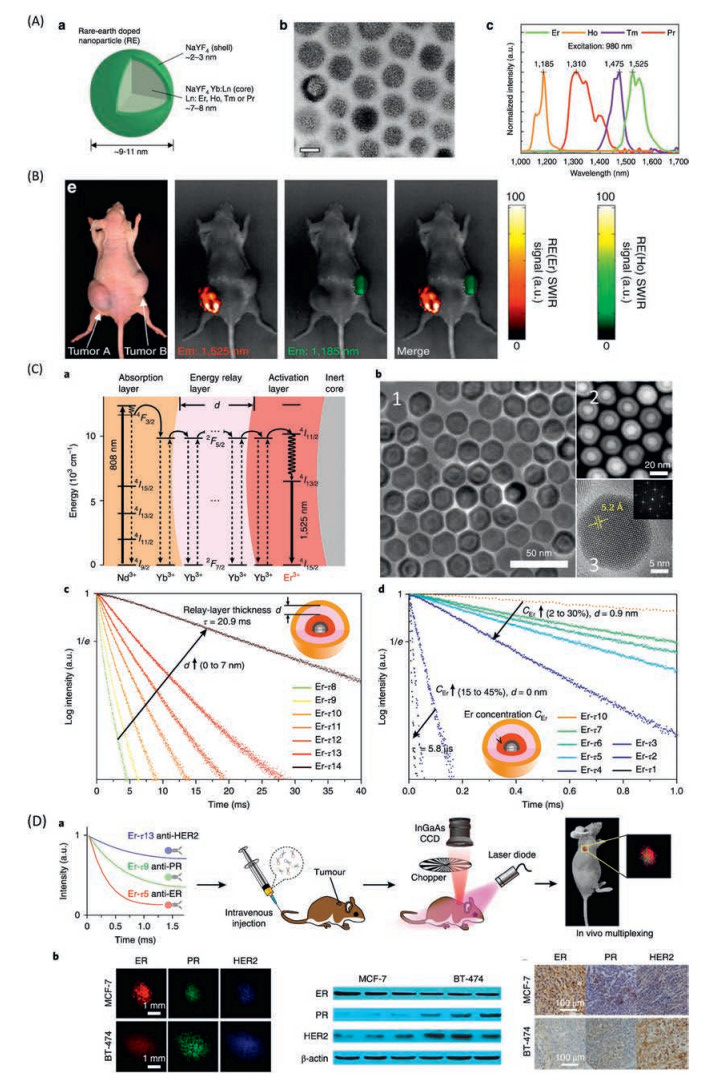
Lanthanide-doped nanocrystals have been attracting a huge attention on the application of biological study, since the excellent luminescence up conversion nanocrystal discovered [209-212]. Furthermore, the toxicity of most of the Lanthanide is negligible, for instance the Gadolinium complex injected for MRI contrast [213]. The down conversion luminescence lanthanide doped nanocrystals have been developed in recent years as the promising NIR-II emission for deep tissue imaging [214-218]. The lanthanide doped nanocrystals are composed by a sensitizer, for example Yb, and different activators like erbium, thulium, holmium [219]. The sensitizer absorbs the photon energy then transfer to the adjacent activator atoms which could emit light at another lower wavelength [220]. The emission wavelength could be facilely tuned by doping different activator atoms, for instance Er is the best for emission at 1525 nm. Furthermore, the f-f transition of emission activator leads to a relatively sharp emission band with half maximum full width less than 100 nm, which render them capable for multicolor imaging with less interference [219] (Fig. 23A). A multicolor imaging has been done with Er and Ho doped down conversion nanocrystal at 1525 nm and 1185 nm [214]. Two individual tumors were able to be diagnosed by injection Ho and Er doped nanocrystal into different tumor site (Fig. 23B).

|
Download:
|
| Fig. 23. The biological imaging application of lanthanide doped nanocrystals. (A) Rare earth nanoprobes consist of a NaYF4 Yb:Ln-doped core (Ln:Er, Ho, Tm or Pr) coated by a shell of NaYF4 (a); TEM images of nanoprobes with scale bar of 10 nm (b); NIR-II emissions of holmium (Ho), praseodymium (Pr), thulium (Tm) and erbium (Er) doped nanocrystals (c). (B) Two color images of Er- and Ho-doped nanocrystals injected into two tumor sites. (C) Energy level diagram presents the luminescence process of the core–multi-shell nanoparticles (a); Transmission electron microscopy (TEM) image (b1), high-angle annular dark-field scanning transmission electron microscopy (HAADF-STEM) image (b2), high-resolution (HR) TEM image and the corresponding fast Fourier transform of the Er-τ12 (NaGdF4@NaGdF4:Yb, Er@NaYF4:Yb@NaYF4:Yb) nanoparticles (b3); Luminescence decay measured at 1525 nm from the Er doped nanoparticles with energy relay shells thickness d from 0 to 7 nm (identical composition) (c); Luminescence decay curves of the nanoparticles with Er3+ doping concentration CEr from 2% to 30% for d= 0.9 nm and from 15% to 45% for d= 0 nm (d). (D) Three batches of Er nanoparticles with distinct lifetimes are conjugated to three antibodies (anti-ER, anti-PR and anti-HER2), respectively, and intravenously injected into the mouse via tail vein. Lifetime-resolved imaging is then performed to quantify the biomarker expressions on the tumour (a); Lifetime-resolved images for the MCF-7 and BT-474 tumours are fitted with three lifetime channels, represented by the red, green and blue monochromatic image sets (b). Reproduced with permission [214, 221]. Copyright 2019, Springer Nature Switzerland AG. | |
The multicolor imaging by lanthanide doped nanocrystals could also be realized via tuning the emission lifetime [221]. The energy transfer rate from the sensitizer to the activator could be finely adjusted by an energy migration layer. A core-shell-shell-shell lanthanide doped nanocrystal has been developed (Fig. 23C). Nd as sensitizer layer and Er as activation layer, in between a layer of Yb are designed for the energy migration and energy relay layer. By changing the thickness of the energy relay layer from 0 nm to 7 nm, a lifetime variation from 1.25 ms to 7.21 ms could be reached. Furthermore, the lifetime could also be controlled by fixing the energy relay thickness and varying the doping ratio of the Er in the activation layer, for instance at layer thickness of 0.9 nm, the lifetime could vary from 0.292 ms at Er 2% to 2.27 ms at 30%. Three distinguishable lifetime 0.5 ms, 1.73 ms, 7.21 ms have been chosen to conjugate with anti-ER, anti-PR and anti-HER2 respectively, for in vivo tumor targeting imaging (Fig. 23D). Two tumor subtypes, MCF-7 and BT-474 could be clearly distinguished by lifetime imaging.
In order to enhance the down conversion efficiency of lanthanide doped nanocrystals, as which is a competition process to up conversion, a series of additional dopant have been studied. For instance, with the dopant of Ce, the up conversion could be dramatically suppressed, therefore, a high down conversion emission could be observed [222]. The lanthanide doped nanocrystals exhibit a promising clinical translation for the less toxicity and high photostability. However, the pink elephant in such nanocrystals is that the molar absorption coefficient of the sensitizer is extraordinarily low. For instance, the molar absorption coefficient of mostly used sensitizer, Yb at 980 nm is about 15 L mol-1 cm-1 [223], which is about four orders lower than that of ICG. In order to reach a reasonable signal to noise ratio, usually a high dose (10 mg/mL) and light intensity (about 100 mW/cm2) are applied [214, 222].
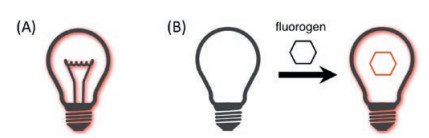
4. Near-infrared fluorescent proteinsUnlike chemical dye or nanomaterial, genetically encoded fluorescent proteins (FPs) are proteins that contain a fluorophore, allowing specific labeling of proteins of interest within a cell or defined cells within tissue. Based on the origin of fluorophore, FPs can be divided into two classes: autofluorescent proteins (AFPs) with a fluorophore formed by an autocatalytic cyclization of the tripeptide Xaa-Tyr-Gly (where Xaa is variable) within their own polypeptide sequence [224], and ligand-induced fluorescent proteins (LiFPs) utilizing natural or synthetic cofactors as a fluorophore [225]. In the latter case, fluorophores are fluorogenic, meaning they exhibit little to no fluorescence in solution but become strongly fluorescent when bound to the protein moiety [225] (Fig. 24). This fluorescence change is usually attributed to a change in fluorescence quantum yield, chromophore extinction coefficient and a spectral shift [226].

|
Download:
|
| Fig. 24. General concepts of autofluorescent proteins (AFPs) and ligand-induced fluorescent proteins (LiFPs). AFPs are constitutively fluorescent (A) while LiFPs fluorescence only when bound with their cognate fluorogens (B), which are nonfluorescent in solution. | |
Fluorophores in FPs are typically polyaromatic compounds having a conjugated π-electron system, which along with the protein environment around the fluorophore determines the fluorescence spectra of FPs. Due to the short conjugation length, AFPs are limited to 611 nm in excitation maximum [227] and 684 nm in emission maximum [228]. On the contrary, some fluorogens possess much longer conjugation length, pushing the fluorescence of LiFPs to the near-infrared region (emission peak ≥ 700 nm). In addition, in contrast to AFPs, the fluorescence maturation in LiFPs is oxygen independent, thus allowing their use in anaerobic conditions [225]. In the past ten years, great efforts and advances have been made to engineer NIR LiFPs with improved spectroscopic and photophysical properties. Therefore, this part gives a brief review on the development and applications of NIR LiFPs, focusing on the protein engineering strategy.
4.1. NIR LiFPs with natural fluorogensLiFPs with natural fluorogens are engineered from photoreceptors that are light-sensitive proteins involved in the sensing and response to light in a variety of organisms. To sense light, photoreceptors typically incorporate endogenous cofactors in living cells as a chromophore that reacts to light via photoisomerization or photoreduction, thus initiating a conformational change of the receptor, subsequently triggering signalling cascades, and eventually reverting back to the dark-adapted state either via thermal relaxation or with light illumination [225]. Accordingly, most of the energy from absorbed photons is converted to chemical energy to drive the photocycle, making photoreceptors non-fluorescent or very weakly fluorescent. Therefore, to obtain bright FPs, the photocycle of photoreceptors should be suppressed or blocked to maximize fluorescence quantum efficiency, and meanwhile the local protein environment around the chromophore must be optimized.
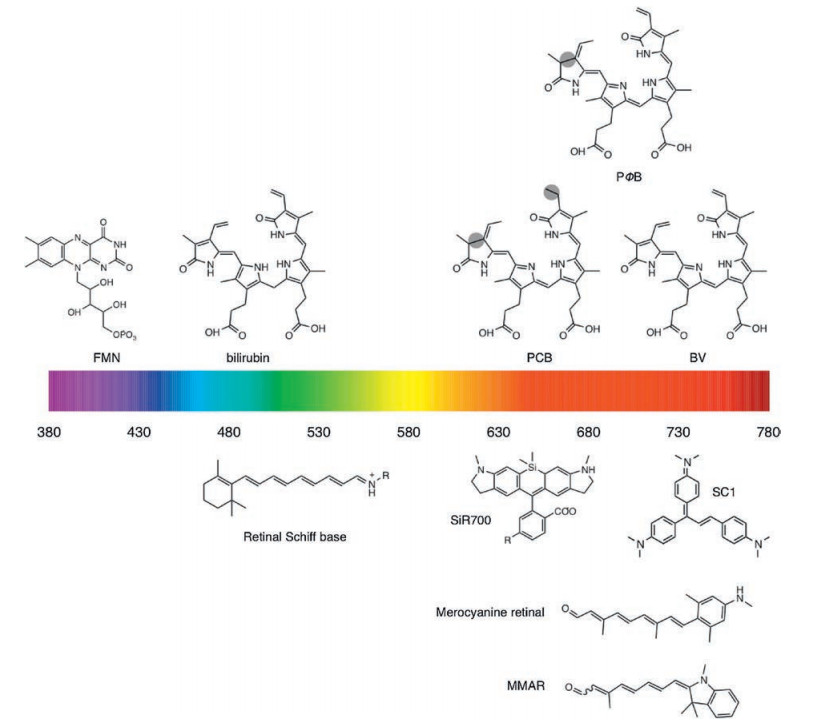
Photoreceptors can efficiently incorporate four types of natural cofactors: bilins, bilirubin, flavins, and retina (Fig. 25). Of these cofactors, bilins and retina exhibit long conjugated π-electron systems, and thus could emit NIR photons when bound to engineered photoreceptors. Bilins consist of four linearly arranged pyrrole rings and exist in nature as biliverdin (BV), phycoerythrobilin (PEB), phycoviolobilin (PVB), phycourobilin (PUB), and phytochromobilin (PΦB), phycocyanobilin (PCB), all of which differ only in single double bonds (Fig. 25). Unlike other bilins, BV is ubiquitous in mammals, enabling BV-induced FPs behave like AFPs when expressed in mammalian cells. More importantly, BV has a longer conjugation than other bilins, yielding absorption maximum up to ~760 nm [229]. So far, three kinds of photoreceptors have been engineered into BV-bound FPs: bacteriophytochrome, cyanobacteriochrome, and allophycocyanin. Remarkably, due to the difference in the conformation of BV and the protein environment around BV, the emission maxima of BV-induced FPs fall within 660–720 nm [229].

|
Download:
|
| Fig. 25. Structure of selected natural fluorophores and synthetic fluorogens. Differences between BV, PCB and PΦB are shaded. | |
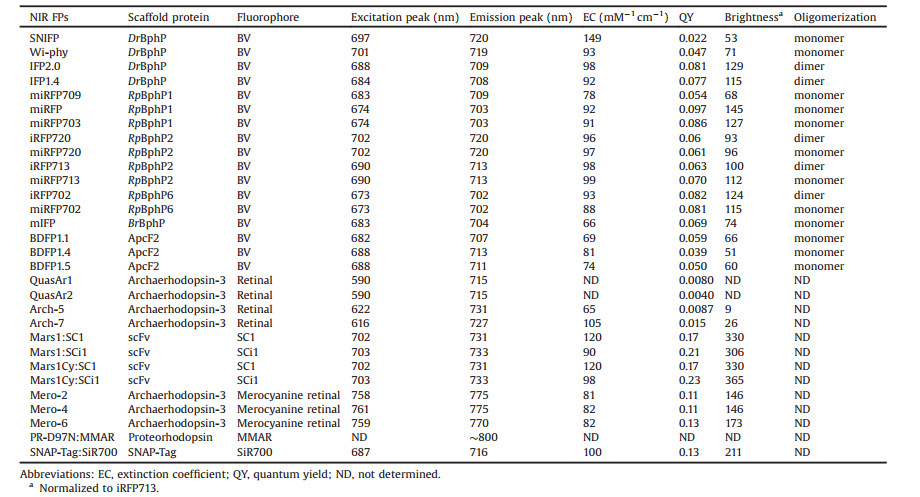
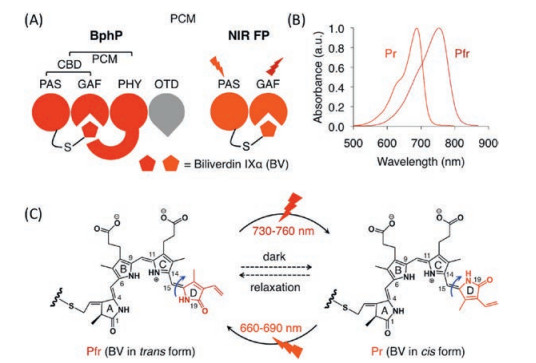
Bacteriophytochromes (BphPs) are red-light photoreceptors that regulate light responses via reversible photoconversion between red (Pr, 660–690 nm) and far-red (Pfr, 730–760 nm) light-absorbing states [229]. A typical BphP consists of a photosensory module (PCM) possessing PAS (Per-ARNT-Sim), GAF (cGMP phosphodiesterase/adenyl cyclase/FhlA) and PHY domains and an output transducing domain (OTD) [230] (Fig. 26). In BphPs, BV is positioned within the GAF domain and binds covalently to a conserved Cys residue in the PAS domain through a single cysteinyl thioether linkage to its ring A vinyl side chain. The PHY domain is required for the integrity of the Pfr form of BphP and thus essential for efficient photoconversion. BphP-based NIR FPs can be achieved by truncating the PHY and OTD domains of BphP and introducing specific mutations surrounding BV to stabilize the Pr state. With this strategy, Shu et al. reported the first NIR FP, IFP1.4, derived from Deinococcus radiodurans BphP and demonstrated its superiority to far-red AFPs in deep tissue in 2009. However, IFP1.4 is dimeric, prone to photobleaching and dim without exogenous supply of BV. To overcome these limitations, Shu and Verkhusha's groups utilized different BphPs to develop a series of NIR FPs grouped into IFP and iRFP families [231] (Fig. 27), which have QYs less than 0.10 (Table 1). Although these FPsuse endogenous BV as a fluorophore, fluorescence can often be increased by supplementing cells with extra BV [232] or by coexpressing heme oxygenase [233] to increase the intracellular concentration of BV. Therefore, the effective brightness of BV-derived NIR FPs in living cells is determined not only by molecular brightness (product of QY and EC) but also by intracellular stability, affinity for BV and protein expression level [234]. A variety of biological applications including multiplex and in vivo imaging of cells and molecules have been reported and extensively reviewed elsewhere [229, 231]. Very recently, an NIR calcium indicator with large dynamic range was engineered based on a circular permutated NIR FP, providing an efficient route to engineer genetically encoded NIR reporters for other molecules [235].

|
Download:
|
| Fig. 26. Structure, absorbance spectra and photochemical properties of BphP. (A) Domain organization of BphP and its derivatives. In BphP, BV is secured in the chromophore binding pocket of the GAF domain and binds covalently to the conserved cysteine residue in the N-terminus of the PAS domain. (B) Absorbance spectra of a typical NIR BphP. (C) Conversion between the Pfr state and the Pr state and vice versa is induced by far-red or red light, respectively, owing to trans-cis photoisomerization of the D-ring of the BV chromophore around the C15 = C16 double bond (blue arrow). In the dark, the photoconverted state spontaneously reverts back to the ground state. | |

|
Download:
|
| Fig. 27. Protein scaffolds for NIR FPs. Chromophores and the substrate benzylgunaine are shown as sticks. The labels in the brackets denote PDB entries. | |
|
|
Table 1 Key characteristics of NIR FPs. |
Allophycocyanin (APC) is a ~105 kDa phycobiliprotein located in the core of the phycobilisome, the light-harvesting complex present in cyanobacteria, red algae and glaucophytes [236]. APC is organized as cylinders composed of four APC subunits (ApcA, ApcB. ApcD and ApcF) and two linker proteins (ApcC and ApcE) [237]. APC-related proteins (APCs, ApcA-F) share a similar structure with a globin-like fold consisting of seven helices with an N-terminal helix extension (Fig. 27). Unlike BphPs, APCs, which are nonphotochromic and naturally brightly fluorescent, utilize a PCB chromophore, either covalently linked to a conserved Cys residue in the protein via its pyrrole ring A or being non-covalent due to the missing conserved Cys residue. Interestingly, the latter APCs, found in far-red light photoacclimated cyanobacteria, are red-shifted with absorption maxima beyond 700 nm [238]. By reverting back to the conserved Cys, ApcF2 from cyanobacterium Chroococcidiopsis thermalis was chromophorylated with non-native BV and converted into a series of thermostable and pH-tolerant monomeric NIR FPs [239] (Table 1), providing a basis for engineering APC-based NIR FPs. However, these NIR FPs have low efficiency of BV binding, resulting in significantly lower brightness in mammalian cells than the BphP-based NIR FPs, which could be tackled by exploring different APCs in future.
Conventional microbial rhodopsins are a family of the retinalbinding seven-transmembrane proteins found in archaebacteria, bacteria and eubacteria, and function as bacteria sensors, lightdriven ion pumps and light-gated channels [240]. In the dark, the retinal chromophore is covalently bound to a conserved Lys residue in the 7th transmembrane helix through a protonated retinal Schiff base (RSB) linkage where the proton is stabilized by a conserved Asp or Glu residue called counterion. Upon photoexcitation, retinal isomerizes from the all-trans to the cis-13 configuration, triggering a cyclic reaction involving deprotonation of RSB, conformational changes of the protein, reprotonation of RSB, and the reversal of retinal isomerisation [241]. Among microbial rhodopsins, proton-pumping ones are of particular interest because some of them exhibit dim far-red fluorescence beyond680 nm [242, 243], being promising candidates for engineering NIR FPs. However, the proton-pumping rhodopsins from nature are optimally activated by light in the range of 450–570 nm [244]. The absorption maximum of microbial rhodopsin is determined not only by retina itself, but also by the polarity of the retinal binding cavity and the distance between the protonated RSB and its counterion. For example, it has been reported that mutating Asp95 (counterion) to Asn in the Archaerhodopsin 3 (Arch), a proton-pumping rhodopsin from halobacterium Halorubrum sodomense, causes bathochromic shift of 30 nm in absorption [242]. In addition, this mutation abolishes the protonpumping activity of Arch with increased fluorescence. Inspired by this, two groups independently developed Arch-based nonpumping NIR FPs with large Stokes shift: QuasArs [245] and Arch-5/7 [246] (Table 1), whose absorption and emission maxima are 590– 628 nm and 715-731 nm, respectively. However, one disadvantage of both FPs is that only cell plasma membrane or membrane protein can be labeled. Interestingly, the fluorescence of QuasArs is sensitive to membrane voltage, allowing measurement of action potentials in neurons. When combined with blue light-activable optogenetic actuator CheRiff, all-optical electrophysiology, simultaneous optical perturbation and measurement of membrane voltage, was achieved in brain slices [245].
4.2. NIR LiFPs with synthetic fluorogensIn parallel to the development of LiFPs incorporating endogenous fluorogens, LiFPs that bind synthetic fluorogens have also been explored. Synthetic fluorogens present their inherent strengths and weaknesses [225]. On one hand, they can be tailored to achieve desired spectral and photophysical properties, which are in theory only limited by design imagination. Furthermore, they are particularly useful when fluorescence is desired only at a specific time, for example pulse-chase imaging [247]. On the other hand, as fluorophores are synthetic, they usually exhibit low binding efficiency to protein tags, thus requiring extensive protein evolution. In addition, NIR fluorogen delivery into living cells or crossing blood-brain barrier in vivo may be challenging due to the relatively large size and high hydrophilicity. To date, NIR LiFPs with synthetic fluorogens are very few and can be generally classified into two categories: fluorogen-binding proteins and self-labeling proteins, both of which can form a fluorescent complex with a fluorogen in a covalent or non-covalent manner.
Fluorogen-binding proteins including antibodies, FAST, fibronectin, CRABPII and DARPs can be converted into LiFPs through non-covalent binding with their cognate fluorogens [225]. However, the emission maxima of these FPs are below 660 nm [225], except for single-chain derived scFV-based NIR Mars1:SC1 with peak emission near 730 nm [248]. An easy and effective way to redshifting would be extending the conjugation length of natural fluorophores in photoreceptors. Meanwhile, to improve the molecular brightness, photoreceptors could be optimized to increase the binding efficiency to modified fluorophores. Consistent with this, two groups developed two retinal analogues 3- methylamino-16-nor-1, 2, 3, 4-didehydroretinal (MMAR) [249] and merocyanine retinal [250], which covalently bind to engineered proton-pumping rhodopsins via a RSB linkage and emit NIR fluorescence with emission peak ranging from 750 nm to 800 nm. However, both FPs are more suited to bacterial imaging applications, and thus need further optimization for expression and stability if used in mammalian cells.
Self-labeling proteins such as HaloTag or SNAP-Tag utilize the covalent ligation of biorthogonal ligands to a tagged protein. By linking the ligands with various synthetic fluorogens, self-labeling proteins emit fluorescence via three mechanisms including release of fluorescence quenchers, change in environmental sensitivity of fluorophores and fluorophore generation in situ [251]. Although some fluorogens have been developed for use with these protein tags, the first and only NIR fluorogen SiR700 was reported in 2016 [252]. SiR700 is a derivative of carboxylated silicon rhodamine and emits NIR fluorescence with emission peak at 716 nm when bound to SNAP-Tag. Interestingly, SiR700 is highly photostable, cellpermeable and fluorogenic, allowing for long-term live cell imaging. In conjunction with far-red fluorogen SiR650, dual-color super-resolution imaging was achieved in living cells. This FP could be used for in vivo imaging because self-labeling proteins have been demonstrated to work in living animals [253]. Unlike fluorogen-binding proteins, self-labeling proteins are more general because they can be easily made without protein engineering, offering more possibilities to screen NIR FPs even NIR II FPs.
5. OutlookThe fluorescence probes in the NIR window have demonstrated an excellent ability of monitoring biological processes and disease diagnosis as the low light scattering and reduced autofluorescence. However, current NIR fluorophores/complexes suffer from low brightness, relatively short emission wavelength and a limited number of NIR sensors.
Firstly, the development of dynamic response NIR fluorescence probes, for instance the neuron responsive fluorophores (calcium sensing fluorophore, voltage sensitive dyes), is one of the huge challenges, yet which could bring about a new era for understanding the complex neuron communication. At present, there are several NIR-I Ca2+ sensing fluorophore developed, however, in comparison to the visible small organic molecules, for example the famous Fluo-3, the current NIR-I calcium probes suffer from poor dynamic range. There is about 200-fold enhancement on the fluorescence via binding with Ca2+ for Fluo-3, however that of cyanine dyes is about only 5 or 6. Furthermore, the photostability is the other main concern for the sensing fluorophore, especially for cyanine dye-based sensors. There is no neuron responsive fluorophore have been reported in the NIR-II range so far. To discover novel sensing mechanism that could render NIR-II fluorophore suitable for calcium sensing or voltage response would significantly advance our understanding of brain function. The voltage sensitive dye provides a unique scope for neuron action potential monitoring. However, in order to give a best signal to background ratio, the VSD should be inserted into the neuron membrane, any misplacement of the VSDs would give rise to the background signal. Therefore, for in vivo neuron action potential detection, targeting location on the membrane would significantly improve the SBR, and render the large-scale neuron communication instance observation possible.
Secondly, ICG is the only FDA approved NIR fluorophore with emission peaks longer than 800 nm. The clinical application of ICG leads to a great advance in blood vessel visualization for surgeons. However, the blood vessel labelling is only one of the tiny droplets in the ocean of ICG biological application. The ICG based targeting molecular imaging of specific physiological structure is the vast ocean in clinical application, especially for tumor targeting labelling. The most straight forward way to speed up the FDA approval procedure is to conjugate the ICG with the FDA approved tumor specific antibodies, such as anti-EGFR, anti-HER-2 and antiCD20. The antibody conjugated ICG together with imaging tools (endoscopy system) would assist the surgeons to better decide the margins between the tumor tissue and the normal tissue, to reduce the tumor re-emergence. In spite of the advantages of the NIR-II fluorescence imaging for deep tissues, there is no NIR-II fluorophore that have been approved for clinical trials. As we have discussed, there are still a few drawbacks that the NRII fluorophore needs to overcome to conduct clinical application: (1) The small organic NIR-II fluorophores are the first option for clinical application, as they have the capability of renal clearance. However, currently reported small organic NIR-II fluorophores suffers from the low absorption molar extinction coefficient and low emission quantum yield. The development of bright fluorophores would promote the clinical trial. (2) NIR-IIb or even longer emission wavelength would further enhance the image clarity due to the even lower scattering. However, in this region, the traditional organic small molecules reach the theoretical quantum limits. The inorganic nanoparticles such as quantum dots, or lanthanide doped nanocrystals exhibits a huge advantage in the photostability, and emission quantum yield in this region. For instance, the most intensive studied PbS exhibits strong absorption and emission in the NIR-IIb region as the wellestablished preparation methods. Unfortunately, the toxicity of Pb2+ hinder them for any possibility of clinical trial. The non-heavy metal contained quantum dots like InSb with bulk bandgap around 0.17 eV would be the promising alternative NIR-IIb fluorophore for clinical translation. Therefore, the development of facile quantum dots preparation approaches for NIR-IIb non-heavy metal containing quantum dots would be promising for deep tissue imaging in clinical setting. Though the toxicity of lanthanide doped nanocrystal is less concerned, the intrinsic low absorption coefficient renders a high dose injection, which is not favorite for clinical trial. Therefore, the way to enhance the sensitizer absorption coefficient would reduce the injection dose and make the clinical application of lanthanide doped nanocrystals possible.
Thirdly, existing genetically encoded NIR FPs still suffer from relatively large size, relatively short-wavelength emission, and low effective brightness in living cells, and thus havebig room to improve compared to non-protein NIR probes. Future studies could be focused on three directions. First, BphP-based NIR FPs are relatively large with molecular weight of~56 kDa, preventing from labeling small proteins and peptides. Very recently, a BV-bound monomeric far-red FP (with Ex/Em peak at 645/670 nm), miRFP670nano, was developed using a 17 kDa GAF domain from a red/green cyanobacteriochrome (CBCR) [254] that utilizes PCB as a chromophore. To obtain a small NIR FP, miRFP670nano could be further red-shifted from 670 nm to ≥700 nm through structureguided mutagenesis. Second, all NIR FPs with natural fluorogens have excitation maxima around or below 700 nm. In 2016, the Lagarias group identified some far-red/red and far-red/orange CBCRs, of which one CBCR with PFB has absorption maximum at 752 nm and one CBCR with PCB is fluorescent (with Ex/Em at 728/ 740 nm) [255], raising the possibility of using CBCRs as a template to engineer NIR FPs with excitation maxima beyond 720 nm. More red-shifted NIR FPs reaching into the NIR-II window could be achieved by adding more conjugated groups onto SiR700 compatible with self-labeling proteins. Third, NIR FPs with natural fluorogens are usually engineered in E. coli expressing excessive fluorogens, and very often resulting variants exhibit low effective brightness in mammalian cells due to low binding affinity and concentration of endogenous fluorogens. When combined with mammalian cell-based somatic hypermuatation [256] and recently developed robotic-based screening system [257], bright variants with high affinity to natural fluorogens in mammalian cells could be obtained.
In conclusion, the development of biocompatible, functional and high-performance fluorescent probes would significantly advance our understanding of the complex biological processes and the development of novel diagnostic and therapeutic approaches for diseases.
AcknowledgmentsThis work is financially supported by the National Key Research and Development Program of China(No.2017YFA0700403), National Natural Science Foundation of China (Nos. 31670872, 21874145, 2018M633180, 21905296), Shenzhen Science and Technology Innovation Committee (Nos. KQJSCX20170331161420421, JCYJ20170818163925063, JCYJ20170818164040422, GJHS2017031 4160302802), Chinese Academy of Sciences (No. GJJSTD20180002).
| [1] |
C.A. Roobottom, G. Mitchell, G. Morgan-Hughes, Clin. Radiol. 65 (2010) 859-867. DOI:10.1016/j.crad.2010.04.021 |
| [2] |
W. Che, L. Zhang, Y. Li, et al., Anal. Chem. 91 (2019) 3467-3474. DOI:10.1021/acs.analchem.8b05024 |
| [3] |
R. Hill, B. Healy, L. Holloway, et al., Phys. Med. Biol. 59 (2014) R183-R231. DOI:10.1088/0031-9155/59/6/R183 |
| [4] |
Z. Chen, P. Zhao, Z. Luo, et al., ACS Nano 10 (2016) 10049-10057. DOI:10.1021/acsnano.6b04695 |
| [5] |
N. Zhang, M. Li, X. Sun, H. Jia, W. Liu, Biomaterials 159 (2018) 25-36. DOI:10.1016/j.biomaterials.2018.01.007 |
| [6] |
F.J. Bonte, T.S. Harris, L.S. Hynan, E.H. Bigio, C.L. White, Clin. Nucl. Med. 31 (2006) 376-378. DOI:10.1097/01.rlu.0000222736.81365.63 |
| [7] |
M.G. Lentschig, P. Reimer, U.L. Rausch-Lentschig, et al., Radiology 208 (1998) 353-357. DOI:10.1148/radiology.208.2.9680558 |
| [8] |
H. Minn, A. Salonen, J. Friberg, et al., J. Nucl. Med. 45 (2004) 972-979. |
| [9] |
A. Nowogrodzki, Nature 563 (2018) 24-26. DOI:10.1038/d41586-018-07182-7 |
| [10] |
W.W. Moses, Nucl. Instrum. Methods Phys. Res. A 648 (2011) S236-S240.
|
| [11] |
A.P. Gibson, J.C. Hebden, S.R. Arridge, Phys. Med. Biol. 50 (2005) R1-R43. DOI:10.1088/0031-9155/50/4/R01 |
| [12] |
V.V. Tuchin, J. Biomed. Opt. 21 (2016) 071114.
|
| [13] |
M. Monici, Biotechnol. Annu. Rev. 11 (2005) 227-256. DOI:10.1016/S1387-2656(05)11007-2 |
| [14] |
M.K. Moaveni, A Multiple Scattering Field Theory Applied to Whole Blood, Ph. D. Dissertation, University of Washington, 1970.
|
| [15] |
T. Sarna, R.C. Sealy, Photochem. Photobiol. 39 (1984) 69-74. DOI:10.1111/j.1751-1097.1984.tb03406.x |
| [16] |
P.R. Crippa, V. Cristofoletti, N. Romeo, Biochim. Biophys. Acta 538 (1978) 164-170. DOI:10.1016/0304-4165(78)90260-X |
| [17] |
C.M.J. Hu, L. Zhang, S. Aryal, et al., Proc. Natl. Acad. Sci. U. S. A. 108 (2011) 10980-10985. DOI:10.1073/pnas.1106634108 |
| [18] |
A.C. Croce, G. Bottiroli, Eur. J. Histochem. 58 (2014) 320-337. |
| [19] |
G.M. Hale, M.R. Querry, Appl. Opt. 12 (1973) 555-563. DOI:10.1364/AO.12.000555 |
| [20] |
A.M. Smith, M.C. Mancini, S.M. Nie, Nat. Nanotechnol. 4 (2009) 710-711. DOI:10.1038/nnano.2009.326 |
| [21] |
Infrared Radiation, Van Nostrand's Scientific Encyclopedia, John Wiley & Sons, Inc., Hoboken, 2007.
|
| [22] |
W. Denk, J.H. Strickler, W.W. Webb, Science 248 (1990) 73-76. DOI:10.1126/science.2321027 |
| [23] |
T. Wang, D.G. Ouzounov, C. Wu, et al., Nat. Methods 15 (2018) 789-792. DOI:10.1038/s41592-018-0115-y |
| [24] |
D.G. Ouzounov, T. Wang, M. Wang, et al., Nat. Methods 14 (2017) 388-390. DOI:10.1038/nmeth.4183 |
| [25] |
J.T. Alander, I. Kaartinen, A. Laakso, et al., Int. J. Biomed. Imaging 2012 (2012) 940585. |
| [26] |
K. Welsher, Z. Liu, S.P. Sherlock, et al., Nat. Nanotechnol. 4 (2009) 773-780. DOI:10.1038/nnano.2009.294 |
| [27] |
J. Fabian, H. Nakazumi, M. Matsuoka, Chem. Rev. 92 (1992) 1197-1226. DOI:10.1021/cr00014a003 |
| [28] |
A. Mishra, R.K. Behera, P.K. Behera, B.K. Mishra, G.B. Behera, Chem. Rev. 100 (2000) 1973-2011. DOI:10.1021/cr990402t |
| [29] |
Y. Lv, M. Liu, Y. Zhang, et al., ACS Nano 12 (2018) 1350-1358. DOI:10.1021/acsnano.7b07716 |
| [30] |
W. König, Angew. Chem. 38 (1925) 743-748. DOI:10.1002/ange.19250383504 |
| [31] |
T. Li, P. Wang, W. Guo, et al., ACS Nano 13 (2019) 6770-6781. DOI:10.1021/acsnano.9b01346 |
| [32] |
J. Autschbach, J. Chem. Educ. 84 (2007) 1840-1845. DOI:10.1021/ed084p1840 |
| [33] |
J.L. Bricks, A.D. Kachkovskii, Y.L. Slominskii, A.O. Gerasov, S.V. Popov, Dyes Pigments 121 (2015) 238-255. DOI:10.1016/j.dyepig.2015.05.016 |
| [34] |
K. Kiyose, H. Kojima, Chem.-Asian J. 3 (2008) 506-515. DOI:10.1002/asia.200700267 |
| [35] |
C. Hu, W. Sun, J. Cao, et al., Org. Lett. 15 (2013) 4022-4025. DOI:10.1021/ol401838p |
| [36] |
J.V. Frangioni, Curr. Opin. Chem. Biol. 7 (2003) 626-634. DOI:10.1016/j.cbpa.2003.08.007 |
| [37] |
R.C. Benson, H.A. Kues, Phys. Med. Biol. 23 (1978) 159-163. DOI:10.1088/0031-9155/23/1/017 |
| [38] |
M.Y. Berezin, K. Guo, W. Akers, et al., Biochemistry 50 (2011) 2691-2700. DOI:10.1021/bi2000966 |
| [39] |
E. Tanaka, F.Y. Chen, R. Flaumenhaft, et al., J. Thorac. Cardiovasc. Surg. 138 (2009) 133-140. DOI:10.1016/j.jtcvs.2008.09.082 |
| [40] |
A. Matsui, E. Tanaka, H.S. Choi, et al., Surgery 148 (2010) 87-95. DOI:10.1016/j.surg.2009.12.004 |
| [41] |
F.P.R. Verbeek, J.R. van der Vorst, B.E. Schaafsma, et al., J. Urol. 190 (2013) 574-579. DOI:10.1016/j.juro.2013.02.3187 |
| [42] |
S.L. Troyan, V. Kianzad, S.L. Gibbs-Strauss, et al., Ann. Surg. Oncol. 16 (2009) 2943-2952. DOI:10.1245/s10434-009-0594-2 |
| [43] |
Y. Ashitate, C.S. Vooght, M. Hutteman, et al., Mol. Imaging 11 (2012) 301-308. |
| [44] |
F.P.R. Verbeek, B.E. Schaafsma, Q.R.J.G. Tummers, et al., Surg. Endosc. 28 (2014) 1076-1082. DOI:10.1007/s00464-013-3305-9 |
| [45] |
J.R. van der Vorst, B.E. Schaafsma, M. Hutteman, et al., Cancer 119 (2013) 3411-3418. DOI:10.1002/cncr.28203 |
| [46] |
Q.R.J.G. Tummers, A. Schepers, J.F. Hamming, et al., Surgery 158 (2015) 1323-1330. DOI:10.1016/j.surg.2015.03.027 |
| [47] |
Q.R.J.G. Tummers, F.P.R. Verbeek, H.A.J.M. Prevoo, et al., Surg. Innov. 22 (2015) 20-25. DOI:10.1177/1553350614535857 |
| [48] |
F.P.R. Verbeek, Q.R.J.G. Tummers, D.D.D. Rietbergen, et al., Int. J. Gynecol. Cancer 25 (2015) 1086-1093. DOI:10.1097/IGC.0000000000000419 |
| [49] |
D. Milej, A. Gerega, N. Zo _łek, et al., Phys. Med. Biol. 57 (2012) 6725-6742. DOI:10.1088/0031-9155/57/20/6725 |
| [50] |
W. Weigl, D. Milej, A. Gerega, et al., NeuroImage 85 (2014) 555-565. DOI:10.1016/j.neuroimage.2013.06.065 |
| [51] |
C. Hirche, D. Murawa, Z. Mohr, S. Kneif, M. Huenerbein, Breast Cancer Res. Tr. 121 (2010) 373-378. DOI:10.1007/s10549-010-0760-z |
| [52] |
J.A. Carr, D. Franke, J.R. Caram, et al., Proc. Natl. Acad. Sci. U. S.A. 115 (2018) 4465-4470. DOI:10.1073/pnas.1718917115 |
| [53] |
P.E. Burrows, M.L. Gonzalez-Garay, J.C. Rasmussen, et al., Proc. Natl. Acad. Sci. U. S. A. 110 (2013) 8621-8626. DOI:10.1073/pnas.1222722110 |
| [54] |
E.L. Rosenthal, J.M. Warram, E. de Boer, et al., Clin. Cancer Res. 21 (2015) 3658-3666. DOI:10.1158/1078-0432.CCR-14-3284 |
| [55] |
J.S.D. Mieog, S.L. Troyan, M. Hutteman, et al., Ann. Surg. Oncol. 18 (2011) 2483-2491. DOI:10.1245/s10434-011-1566-x |
| [56] |
C.D. Geddes, H.S. Cao, J.R. Lakowicz, Spectrochim. Acta A Mol. Biomol. Spectrosc. 59 (2003) 2611-2617. DOI:10.1016/S1386-1425(03)00015-5 |
| [57] |
V. Saxena, M. Sadoqi, J. Shao, J. Photochem. Photobiol. B 74 (2004) 29-38. DOI:10.1016/j.jphotobiol.2004.01.002 |
| [58] |
W. Holzer, M. Mauerer, A. Penzkofer, J. Photochem. Photobiol. B 47 (1998) 155-164. DOI:10.1016/S1011-1344(98)00216-4 |
| [59] |
E. Engel, R. Schraml, T. Maisch, et al., Invest. Ophthalmol. Visual Sci. 49 (2008) 1777-1783. DOI:10.1167/iovs.07-0911 |
| [60] |
S. Mindt, I. Karampinis, M. John, M. Neumaier, K. Nowak, Photochem. Photobiol. Sci. 17 (2018) 1189-1196. DOI:10.1039/C8PP00064F |
| [61] |
G.M. Fischer, C. Jungst, M. Isomaki-Krondahl, et al., Chem. Commun. 46 (2010) 5289-5291. DOI:10.1039/c0cc00359j |
| [62] |
J. Chen, I.R. Corbin, H. Li, et al., J. Am. Chem. Soc. 129 (2007) 5798-5799. DOI:10.1021/ja069336k |
| [63] |
S.A. Hilderbrand, R. Weissleder, Curr. Opin. Chem. Biol. 14 (2010) 71-79. DOI:10.1016/j.cbpa.2009.09.029 |
| [64] |
K. Jyothish, K.T. Arun, D. Ramaiah, Org. Lett. 6 (2004) 3965-3968. DOI:10.1021/ol048411y |
| [65] |
J. Panda, P.R. Virkler, M.R. Detty, J. Org. Chem. 68 (2003) 1804-1809. DOI:10.1021/jo026645u |
| [66] |
G.A. Reynolds, K.H. Drexhage, J. Org. Chem. 42 (1977) 885-888. DOI:10.1021/jo00425a027 |
| [67] |
N. Narayanan, G. Patonay, J. Org. Chem. 60 (1995) 2391-2395. DOI:10.1021/jo00113a018 |
| [68] |
S.J. Mason, S. Balasubramanian, Org. Lett. 4 (2002) 4261-4264. DOI:10.1021/ol026836j |
| [69] |
S.J. Mason, J.L. Hake, J. Nairne, W.J. Cummins, S. Balasubramanian, J. Org. Chem. 70 (2005) 2939-2949. DOI:10.1021/jo0479415 |
| [70] |
M. Lopalco, E.N. Koini, J.K. Cho, M. Bradley, Org. Biomol. Chem. 7 (2009) 856-859. DOI:10.1039/b820719b |
| [71] |
Y.G. Wang, K.J. Zhou, G. Huang, et al., Nat. Mater. 13 (2014) 204-212. DOI:10.1038/nmat3819 |
| [72] |
N.P. Withana, M. Garland, M. Verdoes, et al., Nat. Protoc. 11 (2016) 184-191. DOI:10.1038/nprot.2016.004 |
| [73] |
S. Onoe, T. Temma, Y. Shimizu, M. Ono, H. Saji, Cancer Med. 3 (2014) 775-786. DOI:10.1002/cam4.252 |
| [74] |
L.E. Edgington, A.B. Berger, G. Blum, et al., Nat. Med. 15 (2009) 967-973. DOI:10.1038/nm.1938 |
| [75] |
G. Blum, G. von Degenfeld, M.J. Merchant, H.M. Blau, M. Bogyo, Nat. Chem. Biol. 3 (2007) 668-677. DOI:10.1038/nchembio.2007.26 |
| [76] |
H.S. Choi, S.L. Gibbs, J.H. Lee, et al., Nat. Biotechnol. 31 (2013) 148-153. DOI:10.1038/nbt.2468 |
| [77] |
H. Hyun, M. Henary, T. Gao, et al., Mol. Imaging Biol. 18 (2016) 52-61. DOI:10.1007/s11307-015-0870-4 |
| [78] |
K.R. Bhushan, P. Misra, F. Liu, et al., J. Am. Chem. Soc. 130 (2008) 17648-17649. DOI:10.1021/ja807099s |
| [79] |
Z.R. Zhang, S. Achilefu, Org. Lett. 6 (2004) 2067-2070. DOI:10.1021/ol049258a |
| [80] |
L. Strekowski, M. Lipowska, G. Patonay, J. Org. Chem. 57 (1992) 4578-4580. DOI:10.1021/jo00043a009 |
| [81] |
H.S. Choi, K. Nasr, S. Alyabyev, et al., Angew. Chem. Int. Ed. 50 (2011) 6258-6263. DOI:10.1002/anie.201102459 |
| [82] |
A. Zaheer, R.E. Lenkinski, A. Mahmood, et al., Nat. Biotechnol. 19 (2001) 1148-1154. DOI:10.1038/nbt1201-1148 |
| [83] |
M.G. House, T. Kobayashi, B. Weber, et al., Nat. Commun. 6 (2015) 6. |
| [84] |
S.R. Mujumdar, R.B. Mujumdar, C.M. Grant, A.S. Waggoner, Bioconjugate Chem. 7 (1996) 356-362. DOI:10.1021/bc960021b |
| [85] |
C.H. Quek, K.W. Leong, Nanomaterials 2 (2012) 92-112. DOI:10.3390/nano2020092 |
| [86] |
H. Hyun, H. Wada, K. Bao, et al., Angew. Chem. Int. Ed. 53 (2014) 10668-10672. DOI:10.1002/anie.201404930 |
| [87] |
C. Vinegoni, I. Botnaru, E. Aikawa, et al., Sci. Transl. Med. 3 (2011) 84ra45. |
| [88] |
M. Hintersteiner, A. Enz, P. Frey, et al., Nat. Biotechnol. 23 (2005) 577-583. DOI:10.1038/nbt1085 |
| [89] |
M. Staderini, M.A. Martin, M.L. Bolognesi, J.C. Menendez, Chem. Soc. Rev. 44 (2015) 1807-1819. DOI:10.1039/C4CS00337C |
| [90] |
G.J. Augustine, M.P. Charlton, S.J. Smith, Annu. Rev. Neurosci. 10 (1987) 633-693. DOI:10.1146/annurev.ne.10.030187.003221 |
| [91] |
W.G. Wier, M.B. Cannell, J.R. Berlin, E. Marban, W.J. Lederer, Science 235 (1987) 325-328. DOI:10.1126/science.3798114 |
| [92] |
N.M. Woods, K.S.R. Cuthbertson, P.H. Cobbold, Cell Calcium 8 (1987) 79-100. DOI:10.1016/0143-4160(87)90038-8 |
| [93] |
R.Y. Tsien, Annu. Rev. Biophys. Bioeng. 12 (1983) 91-116. DOI:10.1146/annurev.bb.12.060183.000515 |
| [94] |
P.H. Cobbold, T.J. Rink, Biochem. J. 248 (1987) 313-328. DOI:10.1042/bj2480313 |
| [95] |
X.J. Peng, F.L. Song, E. Lu, et al., J. Am. Chem. Soc. 127 (2005) 4170-4171. DOI:10.1021/ja043413z |
| [96] |
S. Pascal, A. Haefele, C. Monnereau, et al., J. Phys. Chem. A 118 (2014) 4038-4047. DOI:10.1021/jp501358q |
| [97] |
B. Le Guennic, D. Jacquemin, Acc. Chem. Res. 48 (2015) 530-537. DOI:10.1021/ar500447q |
| [98] |
J. Nakai, M. Ohkura, K. Imoto, Nat. Biotechnol. 19 (2001) 137-141. DOI:10.1038/84397 |
| [99] |
Y.N. Tallini, M. Ohkura, B.R. Choi, et al., Proc. Natl. Acad. Sci. U. S. A. 103 (2006) 4753-4758. DOI:10.1073/pnas.0509378103 |
| [100] |
L. Tian, S.A. Hires, T. Mao, et al., Nat. Methods 6 (2009) 875-881. DOI:10.1038/nmeth.1398 |
| [101] |
G. Ji, M.E. Feldman, K.Y. Deng, et al., J. Biol. Chem. 279 (2004) 21461-21468. DOI:10.1074/jbc.M401084200 |
| [102] |
O. Tour, S.R. Adams, R.A. Kerr, et al., Nat. Chem. Biol. 3 (2007) 423. DOI:10.1038/nchembio.2007.4 |
| [103] |
N.L. Allbritton, E. Oancea, M.A. Kuhn, T. Meyer, Proc. Natl. Acad. Sci. U. S. A. 91 (1994) 12458.
|
| [104] |
B. Kaur, N. Kaur, S. Kumar, Coord. Chem. Rev. 358 (2018) 13-69. DOI:10.1016/j.ccr.2017.12.002 |
| [105] |
W. Sun, S. Guo, C. Hu, J. Fan, X. Peng, Chem. Rev. 116 (2016) 7768-7817. DOI:10.1021/acs.chemrev.6b00001 |
| [106] |
A. Matsui, K. Umezawa, Y. Shindo, et al., Chem. Commun. 47 (2011) 10407-10409. DOI:10.1039/c1cc14045k |
| [107] |
Z. Guo, W. Zhu, M. Zhu, X. Wu, H. Tian, Chem.-Eur. J. 16 (2010) 14424-14432. DOI:10.1002/chem.201001769 |
| [108] |
B. Tang, L.J. Cui, K.H. Xu, et al., ChemBioChem 9 (2008) 1159-1164. DOI:10.1002/cbic.200800001 |
| [109] |
M. Zhu, M. Yuan, X. Liu, et al., Org. Lett. 10 (2008) 1481-1484. DOI:10.1021/ol800197t |
| [110] |
X. Cao, W. Lin, W. Wan, Chem. Commun. 48 (2012) 6247-6249. DOI:10.1039/c2cc32114a |
| [111] |
Y. Yang, T. Cheng, W. Zhu, Y. Xu, X. Qian, Org. Lett. 13 (2011) 264-267. DOI:10.1021/ol102692p |
| [112] |
K. Kiyose, H. Kojima, Y. Urano, T. Nagano, J. Am. Chem. Soc. 128 (2006) 6548-6549. DOI:10.1021/ja060399c |
| [113] |
B. Tang, H. Huang, K. Xu, et al., Chem. Commun. (2006) 3609-3611.
|
| [114] |
P. Li, X. Duan, Z. Chen, et al., Chem. Commun. 47 (2011) 7755-7757. DOI:10.1039/c1cc11885d |
| [115] |
P. Li, L. Fang, H. Zhou, et al., Chem.-Eur. J. 17 (2011) 10520-10523. DOI:10.1002/chem.201101327 |
| [116] |
E.H. Kim, G. Chin, G. Rong, K.E. Poskanzer, H.A. Clark, Acc. Chem. Res. 51 (2018) 1023-1032. DOI:10.1021/acs.accounts.7b00564 |
| [117] |
B. Ozmen, E.U. Akkaya, Tetrahedron Lett. 41 (2000) 9185-9188. DOI:10.1016/S0040-4039(00)01662-2 |
| [118] |
N. Narayanan, G. Patonay, J. Org. Chem. 60 (1995) 2391-2395. DOI:10.1021/jo00113a018 |
| [119] |
L.M. Tolbert, X. Zhao, J. Am. Chem. Soc. 119 (1997) 3253-3258. DOI:10.1021/ja9626953 |
| [120] |
P.A. Bouit, C. Aronica, L. Toupet, et al., J. Am. Chem. Soc. 132 (2010) 4328-4335. DOI:10.1021/ja9100886 |
| [121] |
E.D. Cosco, J.R. Caram, O.T. Bruns, et al., Angew. Chem. Int. Ed. 56 (2017) 13126-13129. DOI:10.1002/anie.201706974 |
| [122] |
S. Wang, Y. Fan, D. Li, et al., Nat. Commun. 10 (2019) 1058-1068. DOI:10.1038/s41467-019-09043-x |
| [123] |
B. Jędrzejewska, J. Kabatc, M. Pietrzak, J. Pączkowski, Dyes Pigments 58 (2003) 47-58. DOI:10.1016/S0143-7208(03)00035-4 |
| [124] |
Y. Shan, J. Tang, H. Lai, Tetrahedron Lett. 53 (2012) 1341-1344. DOI:10.1016/j.tetlet.2011.12.133 |
| [125] |
B. Kuhn, P. Fromherz, J. Phys. Chem. B 107 (2003) 7903-7913. DOI:10.1021/jp0345811 |
| [126] |
B. Kuhn, P. Fromherz, W. Denk, Biophys. J. 87 (2004) 631-639. DOI:10.1529/biophysj.104.040477 |
| [127] |
P. Fromherz, G. Hübener, B. Kuhn, M.J. Hinner, Eur. Biophys. J. 37 (2008) 509-514. DOI:10.1007/s00249-007-0210-y |
| [128] |
D.S. Peterka, H. Takahashi, R. Yuste, Neuron 69 (2011) 9-21. DOI:10.1016/j.neuron.2010.12.010 |
| [129] |
G. Ortiz, P. Liu, S.H.H. Naing, V.R. Muller, E.W. Miller, J. Am. Chem. Soc. 141 (2019) 6631-6638. DOI:10.1021/jacs.9b01261 |
| [130] |
R.U. Kulkarni, E.W. Miller, Biochemistry 56 (2017) 5171-5177. DOI:10.1021/acs.biochem.7b00490 |
| [131] |
G.H. Kim, K. Kim, E. Lee, et al., Materials 11 (2018) 1995. DOI:10.3390/ma11101995 |
| [132] |
L. Cohen, Annu. Rev. Physiol. 51 (1989) 487-490. DOI:10.1146/annurev.ph.51.030189.002415 |
| [133] |
L.B. Cohen, S. Lesher, Soc. Gen. Physiol. Ser. 40 (1986) 71-99. |
| [134] |
J.R. Choi, S.M. Kim, R.H. Ryu, S.P. Kim, J.W. Sohn, Exp. Neurobiol. 27 (2018) 453-471. DOI:10.5607/en.2018.27.6.453 |
| [135] |
A. Arieli, A. Sterkin, A. Grinvald, A. Aertsen, Science 273 (1996) 1868-1871. DOI:10.1126/science.273.5283.1868 |
| [136] |
K. Ramasesha, S.R. Leone, D.M. Neumark, Annu. Rev. Phys. Chem. 67 (2016) 41-63. DOI:10.1146/annurev-physchem-040215-112025 |
| [137] |
G. Bu, H. Adams, E.J. Berbari, M. Rubart, Biophys. J. 96 (2009) 2532-2546. DOI:10.1016/j.bpj.2008.12.3896 |
| [138] |
P. Yan, C.D. Acker, W.L. Zhou, et al., Proc. Natl. Acad. Sci. U. S. A. 109 (2012) 20443-20448. DOI:10.1073/pnas.1214850109 |
| [139] |
F. Meng, Y. Liu, J. Niu, W. Lin, RSC Adv. 7 (2017) 16087-16091. DOI:10.1039/C7RA00661F |
| [140] |
G. Salama, B.R. Choi, G. Azour, et al., J. Membr. Biol. 208 (2005) 125-140. DOI:10.1007/s00232-005-0826-8 |
| [141] |
L. Cohen, H. Hopp, J. Wu, et al., Annu. Rev. Physiol. 51 (1989) 527-541. DOI:10.1146/annurev.ph.51.030189.002523 |
| [142] |
B.J. Baker, E.K. Kosmidis, D. Vucinic, et al., Cell. Mol.Neurobiol. 25 (2005) 245-282. DOI:10.1007/s10571-005-3059-6 |
| [143] |
M. Djurisic, M. Zochowski, M. Wachowiak, et al., Methods Enzymol. 361 (2003) 423-451. DOI:10.1016/S0076-6879(03)61022-0 |
| [144] |
L.M. Loew, L.B. Cohen, J. Dix, et al., J. Membr. Biol. 130 (1992) 1-10. |
| [145] |
R.S. Bedlack, M.D. Wei, L.M. Loew, Neuron 9 (1992) 393-403. DOI:10.1016/0896-6273(92)90178-G |
| [146] |
M. Canepari, S. Willadt, D. Zecevic, K.E. Vogt, Biophys. J. 98 (2010) 2032-2040. DOI:10.1016/j.bpj.2010.01.024 |
| [147] |
E. Fluhler, V.G. Burnham, L.M. Loew, Biochemistry 24 (1985) 5749-5755. DOI:10.1021/bi00342a010 |
| [148] |
D. Thomas, S.C. Tovey, T.J. Collins, et al., Cell Calcium 28 (2000) 213-223. DOI:10.1054/ceca.2000.0152 |
| [149] |
B. Ehrenberg, V. Montana, M.D. Wei, J.P. Wuskell, L.M. Loew, Biophys. J. 53 (1988) 785-794. DOI:10.1016/S0006-3495(88)83158-8 |
| [150] |
E.W. Miller, Curr. Opin. Chem. Biol. 33 (2016) 74-80. DOI:10.1016/j.cbpa.2016.06.003 |
| [151] |
R.U. Kulkarni, H. Yin, N. Pourmandi, et al., ACS Chem. Biol. 12 (2017) 407-413. DOI:10.1021/acschembio.6b00981 |
| [152] |
Q. Yang, Z. Ma, H. Wang, et al., Adv. Mater. 29 (2017) 1605497. DOI:10.1002/adma.201605497 |
| [153] |
A.L. Antaris, H. Chen, K. Cheng, et al., Nat. Mater. 15 (2016) 235-242. DOI:10.1038/nmat4476 |
| [154] |
R. Ghosh, A. Nandi, D.K. Palit, Phys. Chem. Chem. Phys. 18 (2016) 7661-7671. DOI:10.1039/C5CP07778H |
| [155] |
(a) Q. Yang, Z. Hu, S. Zhu, et al., J. Am. Chem. Soc. 140 (2018) 1715-1724; (b) X.D. Zhang, H. Wang, A.L. Antaris, et al., Adv. Mater. 28 (2016) 6872-6879; (c) S.J. Zhu, Q.L. Yang, A.L. Antarisa, et al., Proc. Natl. Acad. Sci. U. S. A. 114 (2017) 962-967; (d) C. Yin, X. Zhen, Q.L. Fan, W. Huang, K.Y. Pu, ACS Nano 11 (2017) 4174-4182; (e) D. Mao, W.B. Wu, S.L. Ji, et al., Chem 3 (2017) 991-1007; (f) Y. Cai, P.P. Liang, Q.Y. Tang, et al., ACS Nano 11 (2017) 1054-1063; (g) Y. Sun, C.R. Qu, H. Chen, et al., Chem. Sci. 7 (2016) 6203-6207; (h) Y. Sun, M.M. Ding, X.D. Zeng, et al., Chem. Sci. 8 (2017) 3489-3493. |
| [156] |
Y. Zhong, F. Peng, F. Bao, et al., J. Am. Chem. Soc. 135 (2013) 8350-8356. DOI:10.1021/ja4026227 |
| [157] |
Y. Song, S. Zhu, B. Yang, RSC Adv. 4 (2014) 27184-27200. DOI:10.1039/c3ra47994c |
| [158] |
M. Bruchez, M. Moronne, P. Gin, S. Weiss, A.P. Alivisatos, Science 281 (1998) 2013-2016. DOI:10.1126/science.281.5385.2013 |
| [159] |
A.P. Alivisatos, Science 271 (1996) 933-937. DOI:10.1126/science.271.5251.933 |
| [160] |
M. Hasegawa, Y. Tsukasaki, T. Ohyanagi, T. Jin, Chem. Commun. 49 (2013) 228-230. DOI:10.1039/C2CC36870F |
| [161] |
G. Hong, S. Diao, A.L. Antaris, H. Dai, Chem. Rev. 115 (2015) 10816-10906. DOI:10.1021/acs.chemrev.5b00008 |
| [162] |
L.D. Sun, H. Dong, P.Z. Zhang, C.H. Yan, Annu. Rev. Phys. Chem. 66 (2015) 619-642. DOI:10.1146/annurev-physchem-040214-121344 |
| [163] |
H.S. Choi, B.I. Ipe, P. Misra, et al., Nano Lett. 9 (2009) 2354-2359. DOI:10.1021/nl900872r |
| [164] |
S. Link, M.A. El-Sayed, J. Phys. Chem. B 103 (1999) 8410-8426. DOI:10.1021/jp9917648 |
| [165] |
S. Link, M.A. Ei-Sayed, Annu. Rev. Phys. Chem. 54 (2003) 331-366. DOI:10.1146/annurev.physchem.54.011002.103759 |
| [166] |
C. Zhou, C. Sun, M. Yu, et al., J. Phys. Chem. C 114 (2010) 7727-7732. |
| [167] |
C. Zhou, G. Hao, P. Thomas, et al., Angew. Chem. Int. Ed. 51 (2012) 10118-10122. DOI:10.1002/anie.201203031 |
| [168] |
M. Yu, J. Zhou, B. Du, et al., Angew. Chem. Int. Ed. 55 (2016) 2787-2791. DOI:10.1002/anie.201511148 |
| [169] |
M. Yu, J. Liu, X. Ning, J. Zheng, Angew. Chem. Int. Ed. 54 (2015) 15434-15438. DOI:10.1002/anie.201507868 |
| [170] |
J. Liu, M. Yu, C. Zhou, et al., J. Am. Chem. Soc. 135 (2013) 4978-4981. DOI:10.1021/ja401612x |
| [171] |
C.C. Huang, Z. Yang, K.H. Lee, H.T. Chang, Angew. Chem. Int. Ed. 46 (2007) 6824-6828. DOI:10.1002/anie.200700803 |
| [172] |
J.H. Park, L. Gu, G. von Maltzahn, et al., Nat. Mater. 8 (2009) 331-336. DOI:10.1038/nmat2398 |
| [173] |
L. Gu, D.J. Hall, Z.T. Qin, et al., Nat. Commun. 4 (2013) 7. |
| [174] |
S. Godefroo, M. Hayne, M. Jivanescu, et al., Nat. Nanotechnol. 3 (2008) 174-178. DOI:10.1038/nnano.2008.7 |
| [175] |
K. Welsher, S.P. Sherlock, H. Dai, Proc. Natl. Acad. Sci. U. S. A. 108 (2011) 8943-8948. DOI:10.1073/pnas.1014501108 |
| [176] |
G. Hong, J.C. Lee, J.T. Robinson, et al., Nat. Med. 18 (2012) 1841-1846. DOI:10.1038/nm.2995 |
| [177] |
M.J. O'Connell, S.M. Bachilo, C.B. Huffman, et al., Science 297 (2002) 593-596. DOI:10.1126/science.1072631 |
| [178] |
M.S. Dresselhaus, G. Dresselhaus, R. Saito, Carbon 33 (1995) 883-891. DOI:10.1016/0008-6223(95)00017-8 |
| [179] |
S. Miyazaki, S. Miyazaki, J. Vac. Sci. Technol. B 19 (2001) 2212-2216. DOI:10.1116/1.1418405 |
| [180] |
J. Ma, J.N. Wang, X.X. Wang, J. Mater. Chem. 19 (2009) 3033-3041. DOI:10.1039/b820088b |
| [181] |
G. Hong, S. Diao, J. Chang, et al., Nat. Photonics 8 (2014) 723-730. DOI:10.1038/nphoton.2014.166 |
| [182] |
M. Dahan, S. Levi, C. Luccardini, et al., Science 302 (2003) 442-445. DOI:10.1126/science.1088525 |
| [183] |
M. Howarth, W. Liu, S. Puthenveetil, et al., Nat. Methods 5 (2008) 397-399. DOI:10.1038/nmeth.1206 |
| [184] |
M.E. Akerman, W.C.W. Chan, P. Laakkonen, S.N. Bhatia, E. Ruoslahti, Proc.Natl. Acad. Sci. U. S. A. 99 (2002) 12617-12621. DOI:10.1073/pnas.152463399 |
| [185] |
D. Bera, L. Qian, T.K. Tseng, P.H. Holloway, Materials 3 (2010) 2260-2345. DOI:10.3390/ma3042260 |
| [186] |
C.B. Murray, C.R. Kagan, M.G. Bawendi, Annu. Rev. Mater. Sci. 30 (2000) 545-610. DOI:10.1146/annurev.matsci.30.1.545 |
| [187] |
C.A. Leatherdale, W.K. Woo, F.V. Mikulec, M.G. Bawendi, J. Phys. Chem. B 106 (2002) 7619-7622. DOI:10.1021/jp025698c |
| [188] |
D.J. Norris, A.L. Efros, S.C. Erwin, nanocrystals Doped, Science 319 (2008) 1776-1779. DOI:10.1126/science.1143802 |
| [189] |
M.G. Kanatzidis, Chem. Mater. 22 (2010) 648-659. DOI:10.1021/cm902195j |
| [190] |
C. Kittel, Introduction to Solid State Physics, 6th ed., John Wiley, New York, 1986 p. 185.
|
| [191] |
O. Madelung, Semiconductors: Data Handbook, 3rd. ed., Springer, New York, 2004.
|
| [192] |
S. Neeleshwar, C.L. Chen, C.B. Tsai, et al., Phys. Rev. B 71 (2005) 201307. DOI:10.1103/PhysRevB.71.201307 |
| [193] |
J.H. Park, L. Gu, G. von Maltzahn, et al., Nat. Mater. 8 (2009) 331-336. DOI:10.1038/nmat2398 |
| [194] |
Y. Zhang, Y. Zhang, G. Hong, et al., Biomaterials 34 (2013) 3639-3646. DOI:10.1016/j.biomaterials.2013.01.089 |
| [195] |
G. Hong, J.T. Robinson, Y. Zhang, et al., Angew. Chem. Int. Ed. 51 (2012) 9818-9821. DOI:10.1002/anie.201206059 |
| [196] |
R. Gui, A. Wan, X. Liu, W. Yuan, H. Jin, Nanoscale 6 (2014) 5467-5473. DOI:10.1039/c4nr00282b |
| [197] |
Y. Du, B. Xu, T. Fu, et al., J. Am. Chem. Soc. 132 (2010) 1470-1471. DOI:10.1021/ja909490r |
| [198] |
C. Li, F. Li, Y. Zhang, et al., ACS Nano 9 (2015) 12255-12263. DOI:10.1021/acsnano.5b05503 |
| [199] |
F. Hu, C. Li, Y. Zhang, et al., Nano Res. 8 (2015) 1637-1647. DOI:10.1007/s12274-014-0653-2 |
| [200] |
G. Chen, F. Tian, Y. Zhang, et al., Adv. Funct. Mater. 24 (2014) 2481-2488. DOI:10.1002/adfm.201303263 |
| [201] |
B. Dong, C. Li, G. Chen, et al., Chem. Mater. 25 (2013) 2503-2509. DOI:10.1021/cm400812v |
| [202] |
Y. Kong, J. Chen, H. Fang, et al., Chem. Mater. 28 (2016) 3041-3050. DOI:10.1021/acs.chemmater.6b00208 |
| [203] |
Y. Tsukasaki, M. Morimatsu, G. Nishimura, et al., RSC Adv. 4 (2014) 41164-41171. DOI:10.1039/C4RA06098A |
| [204] |
Y. Nakane, Y. Tsukasaki, T. Sakata, H. Yasuda, T. Jin, Chem. Commun. 49 (2013) 7584-7586. DOI:10.1039/c3cc44000a |
| [205] |
Y. Tsukasaki, A. Komatsuzaki, Y. Mori, et al., Chem. Commun. 50 (2014) 14356-14359. DOI:10.1039/C4CC06542E |
| [206] |
A. Sasaki, Y. Tsukasaki, A. Komatsuzaki, et al., Nanoscale 7 (2015) 5115-5119. DOI:10.1039/C4NR06480A |
| [207] |
O.T. Bruns, T.S. Bischof, D.K. Harris, et al., Nat. Biomed. Eng. 1 (2017) 0056. DOI:10.1038/s41551-017-0056 |
| [208] |
M. Zhang, J. Yue, R. Cui, et al., Proc. Natl. Acad. Sci. U. S. A. 115 (2018) 6590-6595. DOI:10.1073/pnas.1806153115 |
| [209] |
Y. Liu, Y. Lu, X. Yang, et al., Nature 543 (2017) 229-233. DOI:10.1038/nature21366 |
| [210] |
B. Zhou, B. Shi, D. Jin, X. Liu, Nat. Nanotechnol. 10 (2015) 924-936. DOI:10.1038/nnano.2015.251 |
| [211] |
F. Wang, Y. Han, C.S. Lim, et al., Nature 463 (2010) 1061-1065. DOI:10.1038/nature08777 |
| [212] |
S. Wen, J. Zhou, K. Zheng, Nat. Commun. 9 (2018) 2415.
|
| [213] |
J.G. Penfield, R.F. Reilly Jr., Nat. Clin. Pract. Nephrol. 3 (2007) 654-668.
|
| [214] |
D.J. Naczynski, M.C. Tan, M. Zevon, et al., Nat. Commun. 4 (2013) 10. |
| [215] |
U. Rocha, K.U. Kumar, C. Jacinto, et al., Small 10 (2014) 1141-1154. DOI:10.1002/smll.201301716 |
| [216] |
X.W. Zhang, Z. Zhao, X. Zhang, et al., Nano Res. 8 (2015) 636-648. DOI:10.1007/s12274-014-0548-2 |
| [217] |
L.D. Sun, H. Dong, P.Z. Zhang, C.H. Yan, Annu.Rev.Phys.Chem. 66 (2015) 619-642. DOI:10.1146/annurev-physchem-040214-121344 |
| [218] |
X.F. Yu, M. Li, M.Y. Xie, et al., Nano Res. 3 (2010) 51-60. DOI:10.1007/s12274-010-1008-2 |
| [219] |
J. Xu, A. Gulzar, P. Yang, et al., Coord. Chem. Rev. 381 (2019) 104-134. DOI:10.1016/j.ccr.2018.11.014 |
| [220] |
E. Hemmer, P. Acosta-Mora, J. Mendez-Ramos, S. Fischer, J. Phys. Chem. B 5 (2017) 4365-4392. |
| [221] |
Y. Fan, P. Wang, Y. Lu, et al., Nat. Nanotechnol. 13 (2018) 941-946. DOI:10.1038/s41565-018-0221-0 |
| [222] |
Y.T. Zhong, Z.R. Ma, S.J. Zhu, et al., Nat. Commun. 8 (2017) 7. DOI:10.1038/s41467-016-0008-7 |
| [223] |
M. Oh, J. Yi, U. Seo, et al., New Phys. Sae Mulli 67 (2017) 499-503. DOI:10.3938/NPSM.67.499 |
| [224] |
E.A. Rodriguez, R.E. Campbell, J.Y. Lin, et al., Trends Biochem. Sci. 42 (2017) 111-129. DOI:10.1016/j.tibs.2016.09.010 |
| [225] |
L. Jullien, A. Gautier, Methods Appl. Fluoresc. 3 (2015)042007.
|
| [226] |
M.P. Bruchez, Curr. Opin. Chem. Biol. 27 (2015) 18-23. DOI:10.1016/j.cbpa.2015.05.014 |
| [227] |
K.S. Morozova, K.D. Piatkevich, T.J. Gould, et al., Biophys. J. 99 (2010) L13-L15.
|
| [228] |
Z. Li, Z. Zhang, L. Bi, et al., PLoS One 11 (2016) e0148749.
|
| [229] |
O.S. Oliinyk, K.G. Chernov, V.V. Verkhusha, Int. J. Mol. Sci. 18 (2017) 1691.
|
| [230] |
C. Liu, X. Gong, R. Lin, et al., Theranostics 6 (2016) 2414-2430. DOI:10.7150/thno.15878 |
| [231] |
D.M. Shcherbakova, O.V. Stepanenko, K.K. Turoverov, V.V. Verkhusha, Trends Biotechnol. 36 (2018) 1230-1243. DOI:10.1016/j.tibtech.2018.06.011 |
| [232] |
X. Shu, A. Royant, M.Z. Lin, et al., Science 324 (2009) 804-807. DOI:10.1126/science.1168683 |
| [233] |
D. Yu, M.A. Baird, J.R. Allen, et al., Nat. Methods 12 (2015) 763-765. DOI:10.1038/nmeth.3447 |
| [234] |
G.S. Filonov, K.D. Piatkevich, L.M. Ting, et al., Nat. Biotechnol. 29 (2011) 757-761. DOI:10.1038/nbt.1918 |
| [235] |
Y. Qian, K.D. Piatkevich, B. Mc Larney, et al., Nat. Methods 16 (2019) 171-174. DOI:10.1038/s41592-018-0294-6 |
| [236] |
R. MacColl, Biochim. Biophys. Acta 1657 (2004) 73-81. DOI:10.1016/j.bbabio.2004.04.005 |
| [237] |
J. Dagnino-Leone, M. Figueroa, C. Mella, et al., PLoS One 12 (2017) e0177540.
|
| [238] |
F. Gan, S. Zhang, N.C. Rockwell, et al., Science 345 (2014) 1312-1317. DOI:10.1126/science.1256963 |
| [239] |
W.L. Ding, D. Miao, Y.N. Hou, et al., Biochim. Biophys. Acta:Mol. Cell Res. 1864 (2017) 1877-1886. DOI:10.1016/j.bbamcr.2017.08.002 |
| [240] |
E.G. Govorunova, O.A. Sineshchekov, H. Li, J.L. Spudich, Annu. Rev. Biochem. 86 (2017) 845-872. DOI:10.1146/annurev-biochem-101910-144233 |
| [241] |
F. Zhang, J. Vierock, O. Yizhar, et al., Cell 147 (2011) 1446-1457. DOI:10.1016/j.cell.2011.12.004 |
| [242] |
J.M. Kralj, A.D. Douglass, D.R. Hochbaum, D. Maclaurin, A.E. Cohen, Nat. Methods 9 (2011) 90-95. |
| [243] |
J.M. Kralj, D.R. Hochbaum, A.D. Douglass, A.E. Cohen, Science 333 (2011) 345-348. DOI:10.1126/science.1204763 |
| [244] |
R.S. McIsaac, C.N. Bedbrook, F.H. Arnold, Curr. Opin. Struct. Biol. 33 (2015) 8-15. DOI:10.1016/j.sbi.2015.05.001 |
| [245] |
D.R. Hochbaum, Y. Zhao, S.L. Farhi, et al., Nat. Methods 11 (2014) 825-833. DOI:10.1038/nmeth.3000 |
| [246] |
R.S. McIsaac, M.K. Engqvist, T. Wannier, et al., Proc. Natl. Acad. Sci. U. S. A. 111 (2014) 13034-13039. DOI:10.1073/pnas.1413987111 |
| [247] |
D.L. Bodor, M.G. Rodriguez, N. Moreno, L.E. Jansen, Curr. Protoc. Cell Biol. 55 (2012) 8.8.1-8.8.34.
|
| [248] |
M. Zhang, S.K. Chakraborty, P. Sampath, et al., J. Clin. Invest. 125 (2015) 3915-3927. DOI:10.1172/JCI81086 |
| [249] |
S. Ganapathy, H. Venselaar, Q. Chen, et al., J. Am. Chem. Soc. 139 (2017) 2338-2344. DOI:10.1021/jacs.6b11366 |
| [250] |
L. Herwig, A.J. Rice, C.N. Bedbrook, et al., Cell Chem. Biol. 24 (2017) 415-425. DOI:10.1016/j.chembiol.2017.02.008 |
| [251] |
S. Leng, Q.L. Qiao, Y. Gao, et al., Chin. Chem. Lett. 28 (2017) 1911-1915. DOI:10.1016/j.cclet.2017.03.034 |
| [252] |
G. Lukinavicius, L. Reymond, K. Umezawa, et al., J. Am. Chem. Soc. 138 (2016) 9365-9368. DOI:10.1021/jacs.6b04782 |
| [253] |
K. Bojkowska, F. Santoni de Sio, I. Barde, et al., Chem. Biol. 18 (2011) 805-815. DOI:10.1016/j.chembiol.2011.03.014 |
| [254] |
O.S. Oliinyk, A.A. Shemetov, S. Pletnev, D.M. Shcherbakova, V.V. Verkhusha, Nat. Commun. 10 (2019) 279.
|
| [255] |
N.C. Rockwell, S.S. Martin, J.C. Lagarias, Biochemistry 55 (2016) 3907-3919. DOI:10.1021/acs.biochem.6b00299 |
| [256] |
L. Wang, W.C. Jackson, P.A. Steinbach, R.Y. Tsien, Proc. Natl. Acad. Sci. U. S. A. 101 (2004) 16745-16749. DOI:10.1073/pnas.0407752101 |
| [257] |
K.D. Piatkevich, E.E. Jung, C. Straub, et al., Nat. Chem. Biol. 14 (2018) 352-360. DOI:10.1038/s41589-018-0004-9 |