 2019, Vol. 30


b Research Institute of Applied Chemistry, Shanxi University, Taiyuan 030006, China
Hydrogen peroxide (H2O2), as one of the most important markers for reactive oxygen species (ROS), can influence growth, development, and fitness of living organisms. At low levels (< 0.7 μmol/L), H2O2 also functions a ubiquitous intracellular second messenger [1, 2], which can activate signaling pathways to stimulate cell proliferation [3], differentiation [4] and migration [5]. H2O2 is produced through a few different pathways, such as NADPH oxidase, the electron transport chain in the mitochondria, various oxidases in peroxisomes and phagosomes in specialized cells of the immune system, and consumed by superoxide dismutase (SOD) or catalase enzymes in living systems. In living cells, the release and compartmentalization of H2O2 is precisely controlled and exquisitely regulated. However, under the conditions of stress or stimulation by exogenous chemicals, ROS generated aberrantly may attack cellular biomolecules, such as proteins [6, 7], liposomes [8], and DNA [9, 10] and induce oxidative stress. Indeed, oxidative stress is closely related with many diseases, including cancer [11, 12] and neurodegenerative disorders, such as Alzheimer's [13], Parkinson's [14], and Huntington's [15] diseases.
The involvement of H2O2 in cellular signaling and disease states motivated the development of chemical tools that can be employed to monitor the level change in situ. Among them, fluorescence labeling is a powerful technique, because of its nondisruptive, real-time and visualization features [16-31]. Compared with other fluorescent indicators, such as fluorescence proteins, quantum dots and nanoparticles, organic fluorescence probes are widely appreciated by chemists and biologists, due to their unique advantages: small size, easy modification, low toxicity and adjustable emission band.
In recent years, a variety of fluorescent probes have been developed for specifically monitoring H2O2 in vitro, ex vivo and in vivo, including five main response strategies: the reaction with arylboronates or phenylboronic acid to phenols [32-37], the conversion of oxonium or diketone to acid [38], oxidation of phenol to quinone [39], carbon-carbon double bond cleavage [40] and tandem Payne/Dakin reaction [41]. However, most of these probes enter cells through free diffusion, randomly distribute in the cytoplasm and lack organelle-targetable or accumulated capacity. However, the function of H2O2 is largely dependent on the subcellular compartment. Considering these demands, some targetable H2O2 fluorescent probes were designed and synthesized.
In this review, we summarized the reported targetable fluorescent probes that were used for the sensing H2O2 in mitochondria, nuclei and lysosomes (Scheme 1). The review is divided into three sections according to above different organelles. In every section, we further classify probes according to different targetable strategies. Finally, we state our perspective on the development of new probes for local visualization H2O2 in living cells.

|
Download:
|
| Scheme 1. Schematic diagram of cell's structures. | |
2. Mitochondria-targetable H2O2 fluorescent probes
Mitochondria are considered the major source of H2O2 and primary cellular compartment of oxygen consumption [42, 43]. Mitochondria-targetable H2O2 probes were shown in Scheme 2.

|
Download:
|
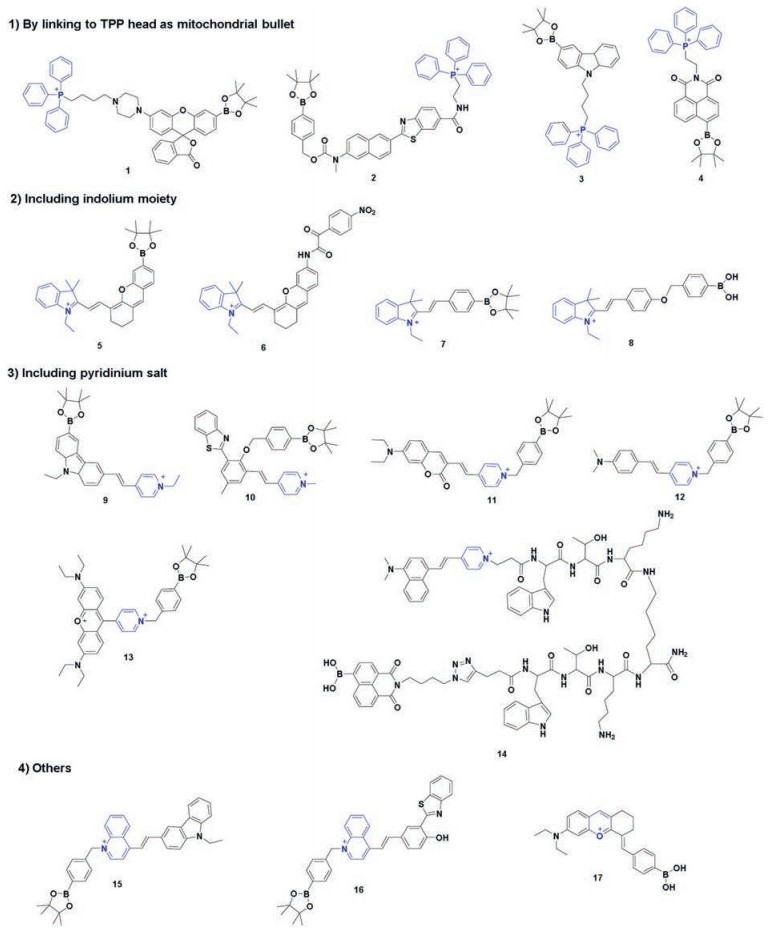
| Scheme 2. The structural formula of probes 1-17. | |
Specifically, the mitochondrial membrane has typically a potential of -180 mV, therefore dyes with cationic ion can easily penetrate the mitochondrial membranes and subsequently accumulate inside it [44]. Positively charged groups, such as triphenylphosphonium (TPP), indolium moiety, quaternarized pyridine group, quaternarized quinoline unit and oxonium ion showed excellent mitochondrial target feature.
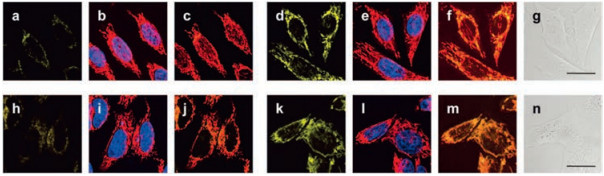
2.1. By linking to TPP head as mitochondrial bulletIn 2008, Chang et al. using rhodamine dye as a fluorophore and TPP head as a targetable group, designed and synthesized first mitochondria-directed H2O2 fluorescent probe 1 [45]. Reaction of probe 1 with H2O2 can trigger an enhanced fluorescence emission (λem = 528 nm). Owing to its chemospecific boronate switch, the probe showed highly selectivity for H2O2, over ROS like HOCl, O2- and NO. 100 μmol/L H2O2 addition resulted in a large increase of fluorescence signal in HeLa cells, meaning that probe 1 was able to detect H2O2 in living cells (Fig. 1). In co-staining experiments, probe 1 and a commercially available mitochondrial indicator (MitoTracker Deep Red) showed excellent overlap. This co-staining experiment was operated in a wide variety of cell types (HEK293, Cos-7 and CHO.K1 cell lines). Importantly, probe 1 was successfully used to visualize endogenous H2O2 increase in the mitochondria of living cells, upon stimulation with paraquat, a small-molecule inducer of Parkinson's-like phenotypes.

|
Download:
|
| Fig. 1. Confocal fluorescence images of HeLa cells with increases in mitochondrial H2O2 levels visualized using probe 1. Images displayed represent emission intensities collected in optical windows between 527 nm and 601 nm upon excitation at 510 nm for probe 1. HeLa cells incubated with 5 μmol/L probe 1 for 60 min at 37 ℃ and imaged with probe 1 (a), MitoTracker Red and Hoechst (overlay, b), and probe 1 with MitoTracker Red (overlay, c). HeLa cells incubated with 5 μmol/L probe 1 for 60 min at 37 ℃ with 100 μmol/L H2O2 added for the final 40 min and imaged with probe 1 (d), MitoTracker Red and Hoechst (overlay, e), probe 1 and MitoTracker Red (overlay, f), and brightfield (g) with 20 μm scale bar. HeLa cells incubated with 5 μmol/L probe 1 for 60 min at 37 ℃ and imaged with probe 1 (h), MitoTracker Red and Hoechst (overlay, i), and probe 1 with MitoTracker Red (overlay, j). HeLa cells incubated for 24 h with 1 mmol/L paraquat, then washed and incubated with 5 μmol/L probe 1 for 60 min at 37 ℃ and imaged with probe 1 (k), MitoTracker Red and Hoechst (overlay, l), probe 1 and MitoTracker Red (overlay, m), and brightfield (n) with 20 mm scale bar [45]. Copied with permission [45]. Copyright 2008, American Chemical Society. | |
In 2012, Kim and coworkers developed first two-photon and ratiometric H2O2 fluorescent probe 2 [46] by introducing fluorophore based on 6-(benzo[d]thiazol-2'-yl)-2-(N, N-dimethylamino)naphthalene and TPP head. The boronate and TPP were modified at both ends of the molecule to minimize the interactions between them. After response to H2O2, the fluorescence peak of probe 2 in MOPS buffer (30 mmol/L MOPS, 100 mmol/L KCl, pH 7.4) changed from 470 nm to 545 nm. The ratio of the emission intensities at 400–470 nm (Fblue) and 530–600 nm (Fyellow) increased by 75-fold. The probe exhibited high sensitivity with 4.6 μmol/L detection limit. A co-localization cells imaging with commercially available MitoTracker Red in Raw 264.7 and high Pearson's colocalization coefficient (0.91) indicated that probe 2 accumulated predominantly in mitochondria. Importantly, this probe was capable of detecting changes in H2O2 levels in tissues at depths ranging from 100 to 180 mm using two-photon microscopy.
In 2016, Wong et al. also reported a two-photon fluorescent probe 3 [47] for mitochondrial H2O2 imaging based on carbazole fluorophore and TPP head. After treatment with H2O2, probe 3 changed into a highly fluorescent product (majored at 430 nm) due to the chemospecific deprotection of boronate to hydroxyl functionality. Compared with other H2O2 probes, probe 3 exhibited a fast response time (~15 min), improved sensitivity and low interference from another ROS. In HeLa cells, the red fluorescence from MitoTracker Red and the blue signal from probe 3 overlapped very well with Pearson's co-localization coefficient 0.925, confirming mitochondria-localization specificity of probe 3.
In 2019, an ICT-based fluorescent probe 4 [48] was synthesized for the detection of mitochondrial H2O2, with radical fluorescence intensity changes at 553 nm (up to 120-fold) and a large Stokes shift (93 nm). Probe 4 presented excellent cell permeability and mitochondria targeting ability. Furthermore, this probe was used for monitoring the change in H2O2 levels upon stimulation by m-chlorophenylhydrazone (CCCP), an inducer of apoptosis through a mitochondria-dependent pathway.
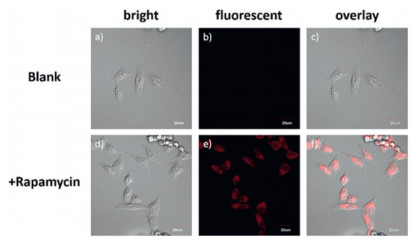
2.2. Including indolium moietyFor biological applications, TPP head is issue of concern due to the toxicity. Thus, other targeting moieties successively were developed and applied. In 2016, the Peng group, using a hemicyanine dye modified a borate ester moiety, developed a "turn-on" H2O2 fluorescent probe 5 [49] with near-infrared (NIR) emission. Upon the addition of 200 μmol/L H2O2, the absorption peak at 554 nm of probe 5 decreased and a new peak at 685 nm appeared. When excited with 685 nm and 554 nm respectively, the ratio of the fluorescence intensity at 709 nm (I685/I554) showed a significant increase from 3.0 to 30.8. High sensitivity and good specificity enabled probe 5 to be suitable for sensing endogenous H2O2 generated by autophagy with the stimulation of rapamycin (Fig. 2) in MCF7 cells. Fluorescence signal of probe 5 and Rhodamine 123 (a commercially available mitochondrial tracker) in MCF-7 cells overlapped well with a Pearson's coefficient of 0.98, which confirmed that probe 5 was localized in the mitochondria.

|
Download:
|
| Fig. 2. Confocal images of endogenous H2O2 in MCF-7 cells. The excitation wavelength was 635 nm and the emission wavelength was collected at 700-750 nm. (a–c) Cells were stained with probe 5 (2.5 μmol/L) for 15 min and then incubated with 5 μL DMSO for 90 min. (d–f) Cells were stained with probe 5 (2.5 μmol/L) for 15 min and then incubated with 250 nmol/L (dissolved in 5 μL DMSO) rapamycin for 90 min. Scale bar = 20 mm. Copied with permission [49]. Copyright 2016, Royal Society of Chemistry. | |
In the same year, Tang et al. also reported a "turn-on" H2O2 fluorescent probe 6 [50] based on hemicyanine dye. Unlike probe 5, probe 6 introduced the α-ketoamide moiety as a novel reaction switch specific for H2O2. Upon reaction with H2O2, probe 6 showed significant fluorescence enhancement (λex/λem = 670/704 nm) and favorable characteristics, in terms of high specificity, high sensitivity and rapid response. In HepG2 cells, the red channel fluorescencesignal(probe 6)and that of green channel(MitoTracker Green) merged well, with 0.96 of Pearson's colocalization coefficient, indicating that probe 6 was organelle-specifically trapped in mitochondria. With the aid of probe 6, the visualization of H2O2 upregulation was realized in ischemiareperfusion injury models.
In 2016, Tang et al. also developed other mitochondriatargetable merocyanine-based H2O2 fluorescence probe 7 [51]. Upon addition of H2O2, the fluorescence intensity of probe 7 at 530 nm increased gradually with the fluorescence quantum yield increasing from 0.043 to 0.15. They also synthesized a novel zinc ion (Zn2+) fluorescence probe (emission peak at 779 nm) for imaging Zn2+ inside mitochondria in living cells and zebrafish. By simultaneous two-color fluorescence imaging utilizing these two probes, it was discovered that exogenous and endogenous H2O2 can stimulate an increase in the concentration of free Zn2+ within mitochondria (Fig. 3), which indicated for the first time that H2O2 and Zn2+ levels changed synergistically.

|
Download:
|
| Fig. 3. The simultaneous fluorescence imaging of H2O2 and Zn2+ in macrophages induced by LPS (10 μg/mL). (A) The fluorescence images of probe 7 (20 μmol/L, green channel, λex 514 nm/λem 530–600 nm) and Zn probe (20 μmol/L, red channel, λex 633 nm/λem 730–800 nm). (B) The average fluorescence intensity from (A) at different times. Copied with permission [51]. Copyright 2016, Royal Society of Chemistry. | |
In 2016, Tang et al. developed probe 8 [52] to detect H2O2 in mitochondria. Probe 8 is comprised merocyanine as a fluorescence reporter and boronic acid as a specific response group. After reaction with H2O2, probe 8 showed an enhanced fluorescence emission (λem = 555 nm). For co-staining experiments in HepG2 and 4T1 cells, the fluorescence of probe 8 was well co-localized with that of MitoTracker Deep Red (overlap coefficient 0.90). At the same time, authors synthesized another probe for monitoring the level change of H2O2 in Endoplasmic Reticulum. Upon addition of H2O2, the maximum emission peak of this ER-targetable sensor exhibited a 100 nm red shift from 458 nm to 558 nm. By using the two probes for simultaneous fluorescence imaging of H2O2 levels, the results of variations changes of H2O2 levels in mitochondria and ER was shown, during diverse apoptotic stimuli, such as Lbuthionine sulfoximine (BSO), CCCP and Tunicamycin (Tm). This is the first example of simultaneous fluorescence imaging of H2O2 levels in different organelle during apoptosis.
2.3. Including pyridinium saltLin group introduced a carbazole-based fluorophore as a novel fluorescent dye for developing a mitochondra-targetable fluorescence probe 9 [53] for visualization the change of H2O2. Under excited at 405 nm, probe 9 showed a "turn-off" response, and the fluorescence intensity evidently decreased at 575 nm, with the addition of H2O2. It possessed a large Stokes shift and achieved the highly sensitive detection of H2O2 in aqueous solution. Co-location tests were employed to prove the mitochondrial target property.
Tang group [54] developed a mitochondria-targetable ratiometric probe 10 with a NIR emission and a large Stokes shift (357 nm), almost at the same time. The probe exhibited a weak emission band centered at 539 nm. Treatment with H2O2 induced the increase of a new emission band centered at 669 nm and disappearance of the emission at 539 nm. The intensity ratio (F669/F539) of probe 10 exhibited a good linear correlation with the concentration of H2O2. The mitochondria-targeting ability of probe was verified through co-localization assay with probe 10 and MitoTracker Green, with high intensity correlation analysis and Pearson's correlation coefficient (0.948) in A549 cells.
Zhang et al. constructed a mitochondria-targeted ratiometric fluorescent probe 11 [55] based on coumarin as the fluorophore and boronate moiety as the reaction site. In the absence of H2O2, probe 11 exhibited very strong red fluorescence due to pyridinium cation as the strong electron withdrawing group. After reactionwith H2O2, the fluorescence intensity at 640 nm a gradually decreased and a bright green-colored fluorescence was observed. The probe 11 can be quantitative, highly selective and sensitive recognition to H2O2 with lowdetectionlimit (10 nmol/L) in the solution, and can be used for determining H2O2 in living cells by ratiometric fluorescence imaging with excellent mitochondrial targeting.
In 2016, a mitochondria-targetable fluorescence probe 12 [56] was reported to dual-detection H2O2 and viscosity in mitochondria with a large turn-on fluorescence signal around 510 and 604 nm. The probe had high selectivity of H2O2 over other ROS and high sensitivity (around 67-fold). In addition, with the change of solution viscosity, the spectra of the probe showed obvious changes (around 16-fold fluorescence enhanced). Fluorescence imaging showed that the staining of probe 12 fitted well with that of MitoTracker Deep Red. The intensity scatter plot of probe 12 channel and MitoTracker channel was high correlated with a high overlap Pearson's coefficient of 0.93. These results indicated that the probe can be used to monitor the level of H2O2 and viscosity changes in mitochondria.
Ge's group developed a rosamine-based H2O2 probe 13 [57] with pyronine-pyridinium skeleton. Upon addition with H2O2, the probe exhibited "turn-on" response accompanied by 33-fold fluorescent enhancement majored at 604 nm. Confocal fluorescent imaging was performed in HeLa cells and Ges-1 cells with probe 13. Its emission matched well with the MitoTracker Green fluorescence, suggesting that the probe can be used for detecting mitochondrial H2O2.
Yi et al. synthesized a mitochondria-targeted H2O2 fluorescence probe 14 [58] based on positively charged styryl dye tagging with a DNA groove binding peptide and a 1, 8-naphthalimide-based H2O2 reporter. The binding peptide can facilitate the styryl group of probe 14 to intercalate into the stacks of DNA base pairs, and then release a red fluorescence emission (majored at 646 nm, λex = 455 nm). The red fluorescence signal showed an excellent colocation with MitoTracker Green in HeLa (Fig. 4) and HepG2 cells, suggesting probe binding to mitochondrial DNA (mtDNA). In the presence of H2O2, probe 14 emitted green fluorescence centered at 555 nm. Thus, probe 14 can be used to reflect the change of the H2O2 level near mtDNA in living cells.

|
Download:
|
| Fig. 4. CLSM images of HeLa cells colabeled with (a–e) probe 12 (5 μmol/L)/MitoTracker (500 nmol/L), and (f–i) probe 14 (5 μmol/L)/ LysoTracker (1 μmol/L) at 37 ℃. (a, f) Red channel: 635±25 nm for probe 14, λex = 458 nm; (b, g) green channel: 530±20 nm for MitoTracker or LysoTracker, λex = 488 nm; (c, h) the brightfield image; and (d, i) the overlay images of red and green channels. (e, j) The correlation of Mito/LysoTracker and probe 14 intensities. Scale bar =20 μm. Copied with permission [58]. Copyright 2015, American Chemical Society. | |
2.4. Others
In 2016, Shao and co-workers reported a novel mitochondriatargetable cationic probe 15 [59], by introducing carbazole group as the fluorogen; p-pinacolborylbenzyl moiety as the reaction site for H2O2; quaternarized quinoline unit as mitochondria-targeted carrier. After the addition with H2O2, the solution color of probe 15 changed from light-red to colorless. And, treatment with H2O2 triggers a dramatic increase of fluorescence intensity at 527 nm, with 33-fold increase. The "turn-on" fluorescence response showed high sensitivity, appreciable water solubility and rapid response time. In living cells, the probe signal fitted very well with the fluorescence of MitoTracker Deep Red, which confirmed that the dye was in the mitochondria. And the probe can respond to localized exogenous and endogenous changes of H2O2 levels in living cells.
Based on quaternarized quinoline unit as a mitochondriatargeted carrier, in 2018, Song's group developed another mitochondria-targeting H2O2 fluorescence probe 16 [60] in ratiometric manner. In the design of probe 16, 2-(2'-hydroxyphenyl)benzothiazoles (HBT) dye was attached to the nitrogen atom in quinoline moiety. Upon the addition of H2O2 to the solution of probe 16, the H2O2-triggered oxidation of borate made the emission peak changing from 666 nm to 594 nm. By confocal imaging experiments, it was verified that probe 16 could detect both endogenous and exogenous H2O2 in living cells. In addition, HeLa cells were treated with probe 16 and commercially available mitochondria probe Rhodamine 123. The finely merged image with a Pearson's colocalization coefficient of 0.94 clearly demonstrated that the probe was specific for mitochondria staining.
Zhou's group employed Nile-Red and DCM derivative to develop a new two-photon and near-infrared fluorescent probe 17 [61] for detecting mitochondrial H2O2. The fluorescence intensity was quenched by the boric acid moiety through suppress the intramolecular charge transfer (ICT) effect. Upon addition of H2O2, boric acid moiety be oxidized to the OH group, resulting in the recovery of ICT effect and turning on the fluorescence. The probe exhibited a more than ~105-fold fluorescence intensity enhancement at emission wavelength of 665 nm after reaction with H2O2. HeLa cells were co-incubated with probe 17 and Rhodamine 123, followed by treatment with H2O2, the fluorescent intensity obviously enhanced in the red channel (probe 17) and a good overlap with Rhodamine 123 (green channel). In addition, the probe was capable for image mitochondrial H2O2 in one-photo and two-photo manner.
3. Nuclei-targetable H2O2 fluorescent probesCell nucleus, the most critical organelle in living cell, houses the vast majority of DNA. Excess reactive oxygen speces can attack DNA and induce oxidative modifications of DNA bases (including oxidation of purines and pyrimidines, strand breaks and so on), finally forming mutations and even cancer (if unrepaired in a timely manner). However, nuclei-targeting fluorescent probes were extremely scarce. Currently, limited methods were used to construct nucleus-directed probes (Scheme 3).

|
Download:
|
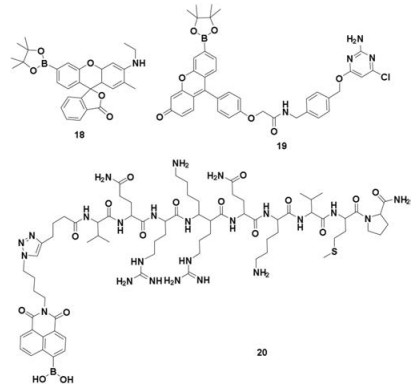
| Scheme 3. The structural formula of probes 18–20. | |
3.1. Serendipitously discovered nucleus-targeted probe
In 2011, Chang's group serendipitously discovered a nucleustargeted and H2O2-specific fluorescent probe 18 [62] (Scheme 3). The probe features two major visible region absorptions (λabs = 468 nm, ε = 27, 300 L mol-1 cm-1; λabs = 490 nm, ε = 26, 000 L mol-1 cm-1) and a weak emission (λem = 530 nm). Reaction of probe 18 with H2O2 triggers a fluorescence increase. Confocal imaging of both HEK293 and HeLa cells loaded with probe 18 and the nuclear stain Hoechst 33342 show good colocalization of the two dyes, establishing that the probe can selectively accumulate in the nuclei. Similar results were observed in a wide variety of cell types, including HeLa, CHO.K1, NIH 3T3, Swiss 3T3, COS-7, A431, and Raw 264.7 Macrophages, demonstrating that probe 18 can visualize changes in localized nuclear H2O2 pools in a range of mammalian cell systems. With the aid of probe 18, a reduction in nuclear H2O2 levels in worms overexpressing sir-2.1 was revealed in in vivo imaging analysis.
3.2. Selective protein labeling techniqueAnother commonly used method of nuclear targeting is protein labeling. Selective protein labeling in living cells with synthetic compounds is feasible in either a covalent (such as HaloTag, SNAPTag, iarsenic compounds to tetracysteine haiprins) or noncovalent manner. In 2010, Chang and co-workers exploited a new class of organelle-targeted reporters for cellular H2O2 through the versatility of the SNAP-tag labeling technology. They synthesized SNAP-tag substrates for coupling to a permeable and selective H2O2 probe to obtain probe 19 [63] (Scheme 3). The probe exhibited a prominent absorption at 495 nm and fluorescent emission maximum at 513 nm. Localization of probe 19 to nuclei is achieved by fusion of SNAP-tag to the C-terminus of the histone H2B protein (SNAP-H2B). Imaging experiments using scanning confocal microscopy established nucleus target of the SNAP-tag probe and their fluorescence turn-on in response to changes in local H2O2 levels.
3.3. Nuclear localization signal peptide strategyThe third nucleus-targetable methodology is linking H2O2 dyes to the nuclear localization signal (NLS) peptides. The NLS peptides can transport cargo into the nuclei by specific recognition and binding to importin α, forming NLS-importin α-importin β trimer [64, 65], which mediates interactions with the pore complex and finally enters nuclei. In 2014, Yi's groupdeveloped a nucleus-directed H2O2 fluorescent probe 20 [66] (Scheme 3) based on VQRKRQKLMP peptide, which derived from the transcription factor NF-κB and can internalize NF-κB into the nuclei. Yi et al. linked a ratiometric and highly sensitive H2O2 fluorescence probe to the NLS peptide. The combined probe was allowed visualization of changes in localized nuclear H2O2 pools in ratiometric manner (Fig. 5).

|
Download:
|
| Fig. 5. CLSM ratio (RY/B) images of 50 μmol/L probe 20-loaded HeLa cells stimulated with 200 μmol/L H2O2 for (a) 0, (b) 15, (c) 30, (d) 60, and (e) 75 min at 37 ℃. (f) The overlay image of (e) and the brightfield image. λex = 405 nm; scale bar = 20 μm. Copied with permission [66]. Copyright 2014, American Chemical Society. | |
4. Lysosomes-targetable H2O2 fluorescent probes
Lysosomes, as the major digestive compartments, are membrane-bound acidic vesicles (pH 4.5–5.0) and used for the degradation of cell constituents [67]. The functions of lysosomes are reportedly associated with fluctuations intracellular levels of H2O2. Once cellular H2O2 diffuse into lysosome, it may react with labile iron(II) to form hydroxyl radicals and iron(Ⅲ), accelerate the formation of oxidative stress, and finally result in depressed autophagy and subsequently cellular dysfunction [68].
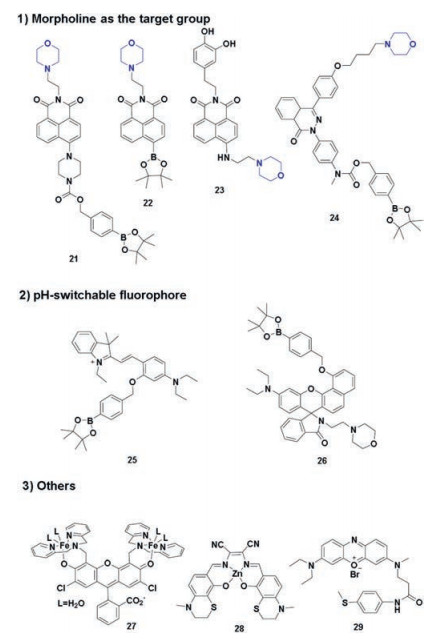
Traditionally, morpholine can significantly induce the probe distribution in lysosomes. Using pH-switchable probes is also novel lysosomes-targetable strategy. These lysosomes-targetable H2O2 fluorescence probes were shown in Scheme 4.

|
Download:
|
| Scheme 4. The structural formula of probes 21–29. | |
4.1. Morpholine as the target group
In 2015, Yoon et al. developed a lysosome-targetable fluorescent probe 21 [69] (Scheme 4) by introducing naphthalimide as fluophore, morpholine as targeting group and p-dihydroxyphenyl benzyloxycarbonyl as a transponder. After reaction with H2O2, fluorescence emission (λem = 528 nm) of probe 21 increased. Owing to its chemospecific boronate switch, the probe showed highly selective response for H2O2, over other ROS. In co-staining experiments, probe 21 and a LysoTracker Blue DND-22 showed well overlap in RAW 264.7, HeLa and NIH-3T3 cells. In addition, probe 21 was used to monitor the lysosomal endogenous H2O2 in the RAW 264.7 cells.
Based on naphthalimide fluophore, in 2016, Lin group developed another fast-responsive and lysosome-targeted two-photon H2O2 fluorescent probe 22 [70] (Scheme 4). Upon excitation at 450 nm, the free probe presented a weak fluorescent emission. By contrast, addition of H2O2 induced the fluorescence intensity a drastic increase in the emission of 550 nm. In confocal fluorescence images, probe 22 showed the capacity to accumulate into lysosomes and imaging of H2O2 in living RAW264.7 cells. The probe also performed a two-photon fluorescence image in a brand new rat section with a tissue penetration depth of 0–150 μm.
In 2017, Kumar et al. designed and synthesized a lysosometargetable naphthalimide-based H2O2 fluorescent probe 23 [39] (Scheme 4) with catechol and morpholine moieties. Upon addition of H2O2 to the aqueous solution of probe 23, an emission band at 537 nm is observed. Endogenous imaging of H2O2 was performed using C6 and BV-2 cells, upon LPS stimulation. Co-localization experiments by co-staining C6 glial cells with a commercial LysoTracker or MitoTracker showed its excellent lysosome-targetable capacity. Importantly, the probe was also capable of detecting H2O2 in brain tissues and living nematodes.
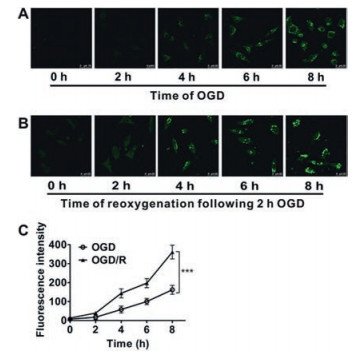
In 2017, Xu et al. reported a H2O2-responsive and lysosometargetable two-photon fluorescent probe 24 [71] (Scheme 4) based on pyridazinone scaffold conjugation of electronic-donating aromatic ring and precise terminal modification of the alkyl linker. In co-staining experiments, probe 24 presented high colocalization coefficient with LysoTracker Red in SH-SY5Y cells. Probe 24 was applied for detecting the endogenous generation of H2O2 in SH-SY5Y cells induced by oxygen and glucose deprivation (OGD) or OGD/reoxygenation (OGD/R) injury (Fig. 6). It was found that both OGD and OGD/R-induced cell injury caused a timedependent increase of H2O2 production within lysosomes.

|
Download:
|
| Fig. 6. Time-dependent fluorescence intensity of endogenous H2O2 in SH-SY5Y cells. (A, B) Representative histograms showed the fluorescence of SH-SY5Y cells which was preincubated with 2 μmol/L probe 24 for 30 min and then subjected to different time of OGD and OGD/R, respectively. (C) Statistical quantification of the mean fluorescence intensity of probe 24 showed the enhanced generation of endogenous H2O2 in cells with reoxygenation following hypoxia. All data presented as means ± SD. ***P < 0.001 by two-way ANOVA (n = 5). Copied with permission [71]. Copyright 2017, Elsevier Ltd. | |
4.2. pH-Switchable fluorophore
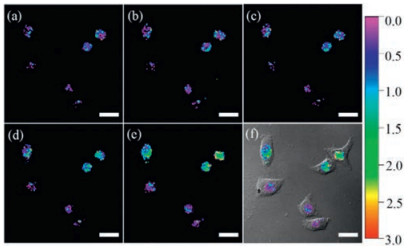
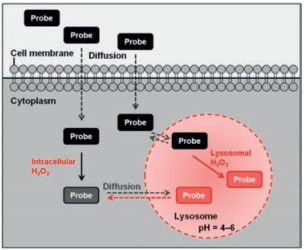
Lysosomes are more acidic (pH 4–6) environment than other places within cells. The feature can be used as an endogenous stimulus for the activation the fluorescence signals. As this principle, Zhao group developed a pH-switchable H2O2 probe 25 [72] (Scheme 4) for visualization of lysosomal H2O2, which is composed of a boronate moiety as H2O2 responsive moiety and a pH-switchable spirobenzopyran as fluorophore. Reaction of probe 25 with H2O2 induced an enhanced fluorescence emission (λem = 584 nm) in acetate buffer at pH 5. Co-localization experiments were conducted using the probe 25 and commercial LysoTracker Green, which showed their excellent overlap. Only signals from lysosomes can be obviously detected, and that of other regions are invisible, which are due to the pH-switchable property of the probe (Fig. 7).

|
Download:
|
| Fig. 7. Only fluorescence within lysosomes is visible; that is, the probes reacted with H2O2 became visible until they have diffused into lysosomal compartments. Copied with permission [72]. Copyright 2016, American Chemical Society. | |
In 2017, Zhao et al. developed another acidic-pH-activatable fluorescent probe 26 [73] (Scheme 4) for the detection and visualization of H2O2 in lysosomes. The probe was constructed by a H2O2-responsive boronate unit, a lysosome-targetable morpholine group, and a pH-activatable benzorhodol fluorophore. Upon treatment with H2O2, the fluorescence intensities (λem = 606 nm) of probe 26 at acidic lysosomal pH (4.5–5.0) are significantly higher than that at neutral pH. Cell imaging experiments further demonstrated that 26 can efficiently accumulate in lysosomes and be used for sensing and visualizing endogenous H2O2 in the lysosomes of living cells without external stimulations.
4.3. OthersIn 2012, Nam et al. developed a metal complexation-based method (probe 27 [74]) for the detection of intracellular H2O2 through fluorescence response. The PIPES buffer containing probe 27 (Scheme 4) displayed a weak fluorescent emission. After the reaction with H2O2, the solution provoked fluorescence turn-on with a 22-fold increase in the fluorescence quantum yield. The probe showed specifically response for H2O2, over ROS like O2-, OCl-, t-BuOOH, NO, and 1O2. Other chemical oxidants, such as (NH4)2CeⅣ(NO3)6 (CAN) and 2, 3-dichloro-5, 6-dicyano-p-benzoquinone (DDQ), also failed to trigger fluorescence enhancement. Living HeLa cells were used for co-localization staining, and the fluorescence signal of probe 27 and a LysoTracker overlapped perfectly.
In 2013, Zhang et al. combined myeloperoxidase (MPO) and compound 28 [75] (Scheme 4) to construct an "MPO-28" probe. MPO can selectivity to convert "H2O2+Cl-" into HOCl. Compound 28 showed good selectivity and fast response rate toward HOCl over other ROS, with 236-fold fluorescence enhancement at emission peak 610 nm. Thus, "MPO-28" probe was capable of detection of H2O2 in the presence of MPO in the PBS buffer (pH 4.5 - 6). The signal from the "MPO-28" system displayed good colocalization with that of LysoTracker Green, with a Pearson's correlation coefficient of 0.92 and an overlap coefficient of 0.94. To more precisely characterize "MPO-28" localization, the lysosomalassociated membrane protein 2, biomarker LAMP2-EGFP, was employed to localization of the probe within the lumen of lysosomes (Fig. 8).

|
Download:
|
| Fig. 8. Compound 28 colocalization assay in HeLa cells. Cells treated with "MPO-28" for 12 h and then H2O2 for half an hour were stained with LysoTracker Green DND- 26 for half an hour: (ⅰ) fluorescence image of "MPO-28"; (ⅱ) fluorescence image of LysoTracker Green DND-26; (ⅲ) merged image of (ⅰ) and (ⅱ); ICA scatter plots of "MPO-28" (ⅳ) and LysoTracker Green DND-26 (ⅴ); (ⅵ) PDM image. The PDM scale bar is inserted. Cells expressing LAMP2-EGFP were treated with "MPO-28 S" for 12 h and then H2O2 for half an hour. (ⅶ) Fluorescence image of "MPO-28"; (ⅷ) image of LAMP2-EGFP; (ⅸ) merged image of "MPO-28" and LAMP2-EGFP. Scale bar: 10 μm in original pictures, 1 μm in amplified pictures. Copied with permission [75]. Copyright 2013, Royal Society of Chemistry. | |
In 2018, Ge et al. constructed a near-infrared and lysosomedirected H2O2 fluorescent probe 29 [76] (Scheme 4) with phenoxazinium as the fluorophore receptor and methyl (phenyl) sulfone as the recognition group. After reaction with H2O2, a fluorescence emission (λem = 676 nm) and turn-on response was shown. In co-staining experiments, probe 29 showed good overlap with a commercially LysoTracker Green merged well and can be used to detect H2O2 in HeLa cells.
5. Summary and outlookIn summary, we summarized mitochondria, nuclei lysosomestargetable H2O2 fluorescent probes and discussed their target strategies, fluorescence behavior and application in bio-imaging. Undoubtedly, the probes for H2O2 local detection have witnessed a great progress.
However, much progress may be made with organelletargetable fluorescent H2O2 probes: 1) The emission wavelengths of the most reported organelle-targetable fluorescent H2O2 probes are generally distributed in the visible light region. The targetable fluorescent H2O2 probe with NIR emission or NIR-II emission can expand its application in biological research. 2) These probes may escape from the organelle, due to the physiological state changing of the specific organelle caused by probes entering. Thus, the development of the fluorescence probes that are capable of binding to a specific cellular structure (including, but not limited to, proteins, liposomes, and DNA) will provide accurate localization and more refined research.
We firmly believe, these fluorescent probes will act as powerful molecular tools for diseases diagnosis, physiological and pathological mechanism research of chemists, biologists and medical scientists.
AcknowledgmentsWe thank the National Natural Science Foundation of China (Nos. 21705102, 21775096), the Shanxi Province Science Foundation for Youths (No. 201701D221061), Shanxi Province Foundation for Returnees (No. 2017-026), and Scientific Instrument Center of Shanxi University (No. 201512).
| [1] |
S.G. Rhee, S.W. Kang, W. Jeong, et al., Curr. Opin. Cell Biol. 17 (2005) 183-189. DOI:10.1016/j.ceb.2005.02.004 |
| [2] |
J.R. Stone, S.P. Yang, Antioxid. Redox Signal. (2006) 243-270. |
| [3] |
M. Geiszt, T.L. Leto, J. Biol. Chem. 279 (2004) 51715-51718. DOI:10.1074/jbc.R400024200 |
| [4] |
J. Li, M. Stouffs, L. Serrander, et al., Mol. Biol. Cell 17 (2006) 3978-3988. DOI:10.1091/mbc.e05-06-0532 |
| [5] |
M. Ushio-Fukai, Cardiovasc. Res. 71 (2006) 226-235. DOI:10.1016/j.cardiores.2006.04.015 |
| [6] |
E.R. Stadtman, Science 257 (1992) 1220-1224. DOI:10.1126/science.1355616 |
| [7] |
E.R. Stadtman, Free Radic. Res. 40 (2006) 1250-1258. |
| [8] |
I. Levitan, S. Volkov, P.V. Subbaiah, Antioxid. Redox Signal. 13 (2010) 39-75. DOI:10.1089/ars.2009.2733 |
| [9] |
S. Kanvah, J. Joseph, G.B. Schuster, et al., Acc. Chem. Res. 43 (2010) 280-287. DOI:10.1021/ar900175a |
| [10] |
S. Shibutani, M. Takeshita, A.P. Grollman, Nature 349 (1991) 431-434. DOI:10.1038/349431a0 |
| [11] |
D.B. Clayson, R. Mehta, F. Iverson, Mutat. Res. 317 (1994) 25-42. DOI:10.1016/0165-1110(94)90010-8 |
| [12] |
S. Loft, H.E. Poulsen, J. Mol. Med. 74 (1996) 297-312. DOI:10.1007/BF00207507 |
| [13] |
C. Behl, J.B. Davis, R. Lesley, D. Schubert, Cell 77 (1994) 817-827. DOI:10.1016/0092-8674(94)90131-7 |
| [14] |
C. Wersinger, A. Sidhu, Neurosci. Lett. 342 (2003) 124-128. DOI:10.1016/S0304-3940(03)00212-X |
| [15] |
P. Liu, Y.J. Li, W. Yang, et al., Oxid. Med. Cell. Longev. 2019 (2019) 4032428. |
| [16] |
A.B. Chinen, C.M. Guan, J.R. Ferrer, et al., Chem. Rev. 115 (2015) 10530-10574. DOI:10.1021/acs.chemrev.5b00321 |
| [17] |
J.J. Cui, Y.H. Yao, C. Chen, et al., Chin. Chem. Lett. 30 (2019) 1071-1074. DOI:10.1016/j.cclet.2018.12.031 |
| [18] |
R.J. Gui, H. Jin, X.N. Bu, et al., Coord. Chem. Rev. 383 (2019) 82-103. DOI:10.1016/j.ccr.2019.01.004 |
| [19] |
C.B. Huang, S.Y. Chen, Prog. Chem. 29 (2017) 1215-1227. |
| [20] |
M.H. Lee, J.S. Kim, J.L. Sessler, Chem. Soc. Rev. 44 (2015) 4185-4191. DOI:10.1039/C4CS00280F |
| [21] |
J. Li, D. Yim, W.D. Jang, J. Yoon, Chem. Soc. Rev. 46 (2017) 2437-2458. DOI:10.1039/C6CS00619A |
| [22] |
W. Qin, C. Xu, Y. Zhao, et al., Chin. Chem. Lett. 29 (2018) 1451-1455. DOI:10.1016/j.cclet.2018.04.007 |
| [23] |
M.G. Ren, K. Zhou, L.W. He, W.Y. Lin, J. Mater. Chem. B 6 (2018) 1716-1733. DOI:10.1039/C7TB03337K |
| [24] |
D. Wu, L. Chen, W. Lee, et al., Coord. Chem. Rev. 354 (2018) 74-97. DOI:10.1016/j.ccr.2017.06.011 |
| [25] |
F.Y. Yan, Z.J. Bai, F. Liu, et al., Curr. Org. Chem. 22 (2018) 57-66. DOI:10.2174/1385272821666171005152058 |
| [26] |
J. Yan, S. Lee, A. Zhang, J. Yoon, Chem. Soc. Rev. 47 (2018) 6900-6916. DOI:10.1039/C7CS00841D |
| [27] |
L. Yuan, W. Lin, K. Zheng, L. He, W. Huang, Chem. Soc. Rev. 42 (2013) 622-661. DOI:10.1039/C2CS35313J |
| [28] |
S. Zhang, G. Chen, Y. Wang, et al., Anal. Chem. 90 (2018) 2946-2953. DOI:10.1021/acs.analchem.7b05429 |
| [29] |
S. Zhang, Q. Wang, X. Liu, et al., Anal. Chem. 90 (2018) 4119-4125. DOI:10.1021/acs.analchem.8b00066 |
| [30] |
Y. Zhang, Y.Y. Fu, D.F. Zhu, et al., Chin. Chem. Lett. 27 (2016) 1429-1436. DOI:10.1016/j.cclet.2016.05.019 |
| [31] |
X. Jiao, Y. Li, J. Niu, et al., Anal. Chem. 90 (2018) 533-555. DOI:10.1021/acs.analchem.7b04234 |
| [32] |
J.X. Huang, T.T. Li, R.N. Liu, et al., Sens. Actuators B:Chem. 248 (2017) 257-264. DOI:10.1016/j.snb.2017.04.001 |
| [33] |
K. Liu, H. Shang, X. Kong, et al., Biomaterials 100 (2016) 162-171. DOI:10.1016/j.biomaterials.2016.05.029 |
| [34] |
N. Narayanaswamy, S. Narra, R.R. Nair, et al., Chem. Sci. 7 (2016) 2832-2841. DOI:10.1039/C5SC03488D |
| [35] |
Z. Song, R.T. Kwok, D. Ding, et al., Chem. Commun. 52 (2016) 10076-10079. DOI:10.1039/C6CC05049B |
| [36] |
Y. Wen, F. Xue, H. Lan, et al., Biosens. Bioelectron. 91 (2017) 115-121. DOI:10.1016/j.bios.2016.12.027 |
| [37] |
Y. Chen, X. Shi, Z. Lu, X. Wang, Z. Wang, Anal. Chem. 89 (2017) 5278-5284. DOI:10.1021/acs.analchem.6b04810 |
| [38] |
B. Dong, X. Song, X. Kong, et al., Adv. Mater. 28 (2016) 8755-8759. DOI:10.1002/adma.201602939 |
| [39] |
S.I. Reja, M. Gupta, N. Gupta, et al., Chem. Commun. 53 (2017) 3701-3704. DOI:10.1039/C6CC09127J |
| [40] |
N. Li, J. Huang, Q. Wang, Y. Gu, P. Wang, Sens. Actuators B:Chem. 254 (2018) 411-416. DOI:10.1016/j.snb.2017.07.133 |
| [41] |
S. Ye, J.J. Hu, D. Yang, Angew. Chem. Int. Ed. 57 (2018) 10173-10177. DOI:10.1002/anie.201805162 |
| [42] |
B.C. Dickinson, D. Srikun, C.J. Chang, Curr. Opin. Chem. Biol. 14 (2010) 50-56. DOI:10.1016/j.cbpa.2009.10.014 |
| [43] |
L. Bao, M.V. Avshalumov, J.C. Patel, et al., J. Neurosci. 29 (2009) 9002-9010. DOI:10.1523/JNEUROSCI.1706-09.2009 |
| [44] |
J.S. Modica-Napolitano, J.R. Aprille, Adv. Drug Deliv. Rev. 49 (2001) 63-70. DOI:10.1016/S0169-409X(01)00125-9 |
| [45] |
B.C. Dickinson, C.J. Chang, J. Am. Chem. Soc. 130 (2008) 9638-9639. DOI:10.1021/ja802355u |
| [46] |
G. Masanta, C.H. Heo, C.S. Lim, et al., Chem. Commun. 48 (2012) 3518-3520. DOI:10.1039/c2cc00034b |
| [47] |
K. Zhang, W. Wu, Y.H. Li, et al., RSC Adv. 6 (2016) 115298-115302. DOI:10.1039/C6RA21260C |
| [48] |
X. Liang, L. Zhang, X.Y. Xu, et al., ChemistrySelect 4 (2019) 1330-1336. DOI:10.1002/slct.201803185 |
| [49] |
F. Xu, H.D. Li, Q.C. Yao, et al., J. Mater. Chem. B 4 (2016) 7363-7367. DOI:10.1039/C6TB02463G |
| [50] |
X. Xie, X. Yang, T. Wu, et al., Anal. Chem. 88 (2016) 8019-8025. DOI:10.1021/acs.analchem.6b01256 |
| [51] |
H. Xiao, P. Li, S. Zhang, et al., Chem. Commun. 52 (2016) 12741-12744. DOI:10.1039/C6CC07182A |
| [52] |
H. Xiao, P. Li, X. Hu, et al., Chem. Sci. 7 (2016) 6153-6159. DOI:10.1039/C6SC01793B |
| [53] |
Y. Liu, J. Niu, J. Nie, F. Meng, W. Lin, New J. Chem. 41 (2017) 3320-3325. DOI:10.1039/C7NJ00107J |
| [54] |
L.J. Tang, M.Y. Tian, H.B. Chen, et al., Dyes Pigments 158 (2018) 482-489. DOI:10.1016/j.dyepig.2017.12.028 |
| [55] |
Y.M. Shen, X.Y. Zhang, Y.Y. Zhang, et al., Sens. Actuators B:Chem. 255 (2018) 42-48. DOI:10.1016/j.snb.2017.08.020 |
| [56] |
M. Ren, B. Deng, K. Zhou, et al., Anal. Chem. 89 (2017) 552-555. DOI:10.1021/acs.analchem.6b04385 |
| [57] |
L. Yang, J.Y. Niu, R. Sun, Y.J. Xu, J.F. Ge, Analyst 143 (2018) 1813-1819. DOI:10.1039/C7AN02041D |
| [58] |
Y. Wen, K. Liu, H. Yang, et al., Anal. Chem. 87 (2015) 10579-10584. DOI:10.1021/acs.analchem.5b03326 |
| [59] |
J. Xu, Y. Zhang, H. Yu, X. Gao, S. Shao, Anal. Chem. 88 (2016) 1455-1461. DOI:10.1021/acs.analchem.5b04424 |
| [60] |
L. He, X.J. Liu, Y. Zhang, et al., Sens. Actuators B:Chem. 276 (2018) 247-253. DOI:10.1016/j.snb.2018.08.119 |
| [61] |
L. Zhou, H. Ding, W. Zhao, S. Hu, Spectrochim. Acta A:Mol. Biomol. Spectrosc. 206 (2019) 529-534. DOI:10.1016/j.saa.2018.08.042 |
| [62] |
B.C. Dickinson, Y. Tang, Z. Chang, C.J. Chang, Chem. Biol. 18 (2011) 943-948. DOI:10.1016/j.chembiol.2011.07.005 |
| [63] |
D. Srikun, A.E. Albers, C.I. Nam, A.T. Iavarone, C.J. Chang, J. Am. Chem. Soc. 132 (2010) 4455-4465. DOI:10.1021/ja100117u |
| [64] |
U. Kutay, F.R. Bischoff, S. Kostka, R. Kraft, D. Gorlich, Cell 90 (1997) 1061-1071. DOI:10.1016/S0092-8674(00)80372-4 |
| [65] |
A. Lange, R.E. Mills, C.J. Lange, et al., J. Biol. Chem. 282 (2007) 5101-5105. DOI:10.1074/jbc.R600026200 |
| [66] |
Y. Wen, K. Liu, H. Yang, et al., Anal. Chem. 86 (2014) 9970-9976. DOI:10.1021/ac502909c |
| [67] |
E.C. Dell'Angelica, C. Mullins, S. Caplan, J.S. Bonifacino, FASEB J. 14 (2000) 1265-1278. DOI:10.1096/fasebj.14.10.1265 |
| [68] |
J. Zdolsek, H. Zhang, K. Roberg, U. Brunk, Free Radic. Res. Commun. 18 (1993) 71-85. DOI:10.3109/10715769309147344 |
| [69] |
D. Kim, G. Kim, S.J. Nam, J. Yin, J. Yoon, Sci. Rep. 5 (2015) 8488. DOI:10.1038/srep08488 |
| [70] |
M. Ren, B. Deng, J.Y. Wang, et al., Biosens. Bioelectron. 79 (2016) 237-243. DOI:10.1016/j.bios.2015.12.046 |
| [71] |
Y. Zhu, T. Zhou, L. Yang, et al., Biochem. Biophys. Res. Commun. 486 (2017) 904-908. DOI:10.1016/j.bbrc.2017.03.121 |
| [72] |
J. Liu, J. Ren, X. Bao, et al., Anal. Chem. 88 (2016) 5865-5870. DOI:10.1021/acs.analchem.6b00654 |
| [73] |
J. Liu, S. Zhou, J. Ren, C. Wu, Y. Zhao, Analyst 142 (2017) 4522-4528. DOI:10.1039/C7AN01280B |
| [74] |
D. Song, J.M. Lim, S. Cho, et al., Chem. Commun. 48 (2012) 5449-5451. DOI:10.1039/c2cc31632c |
| [75] |
J. Jing, J.L. Zhang, Chem. Sci. 4 (2013) 2947-2952. DOI:10.1039/c3sc50807b |
| [76] |
Y. Chen, W.J. Zhu, X.R. Wei, et al., Anal. Methods 10 (2018) 3754-3758. DOI:10.1039/C8AY01403E |