 2019, Vol. 30


Noble metal (gold, silver, copper, etc.) nanoparticles(NPs) have attracted attention in the fields from materials science to analytical chemistry to biomedicine [1-9]. Among them, gold nanorods (GNRs), one of the most striking quasi one-dimensional gold NPs, have been well studied from controllable fabrication to their special optical properties to versatile application potentials [10-12]. Particularly, the localized surface plasmon resonance (LSPR) of GNRs can be regularly modulated from visible to nearinfrared region with the increase of their length-to-diameter ratio. Furthermore, for bottom-up synthesized GNRs, their side face is chemically inert due to dense capping by a double layer of CTAB (cetyltrimethylammonium bromide) molecules, while the two ends are rather highly reactive [11, 12]. Such anisotropic property provides a simple but general colorimetric sensing strategy, namely etching of GNRs by target analytes and/or chemical processes. For example, hydroxyl radicals, often produced by Fenton reaction (or Fenton-like reaction), can well etch GNRs and cause a substantial decrease of their length-diameter ratio. Based on this reaction, H2O2, the catalysts, the substrates, as well as the inhibitors of the corresponding enzymes can be well detected [13-17]. Furthermore, such GNRs' etching can act as one of effective signal outputs for enzyme linked immunosorbent assay [18, 19]. Despite of these achievements, towards the present sensing system, a few issues should still be concerned. We note that, for the previous literature, most of the employed GNRs possess ~18 nm in diameter, which are obtained by the "standard" fabrication system proposed by El-Sayed group [20]. As a result, the analytical performances, especially the sensitivity has been largely intrinsically destined.
In this study, for the first time, we systematacially study the effects of GNRs' diameters on the analytical performances of GNRsetching sensing platform, using H2O2 etching reaction based system (H2O2 molecules themselves and H2O2-Fe2+ Fenton reagents) as an example. Four kinds of GNRs, with diameters of 8, 10, 12, and 18 nm, respectively, are fabricated by the seedmediated strategy. In the experiments, it is found that the etching dynamics are profoundly affected by the diameter parameters, namely, the smaller diameters of the GNRs are employed, the faster of the etching rates are obtained, and higher sensitivity is correspondingly achieved. While for the larger diameter GNRs, the etching reactions can cause more abundant color presentation, which is especially helpful for naked eye sensing.
As shown in Fig. S1 (Supporting information), four kinds of GNRs with diameters of 8, 10, 12, 18 nm, are fabricated based on previous reports [11, 20, 21]. Overall, they are well dispersed based on TEM observation. In addition, the two LSPR bands at 440–600 and 600–1000 nm are observed, which result from transverse and longitudinal surface plasmon resonance, respectively. In the present contribution, the four GNRs are denoted as GNR-8, GNR-10, GNR-12 and GNR-18, respectively, based on their diameter values.
As we know, H2O2 can oxidize and etch GNRs [22]. As shown in Figs. 1A–H, for the four kinds of GNRs, during the etching, their length becomes shorter and shorter, while the diameters are almost keep invariable; with the etching reactions further proceeds on (Figs. 1I–L), all the GNRs close to spherical and finally disappear completely (Figs. 1M–P). In terms of colloidal synthesized GNRs, their side is densely capped by a double layer of CTAB molecules, which causes a rather inert chemical property. In contrast, their two tips are less capped and possess higher reactivity. Due to such anisotropic property, the etching reaction proceeds along the long axis of the GNRs. Because the length-todiameter ratios are more and more small, their longitudinal SPR bands shift to blue region with a decrease in their intensities on the whole. Herein, two points should be noted for the GNRs etching process. First of all, in terms of the blue shift dynamics, the GNRs with smaller diameters have faster etching speed. As shown in Fig. 1, for complete etching (using the disappearance of the transverse plasmonic bands as the indication), the needed time for GNR-8, GNR-10, GNR-12, and GNR-18, is 152, 166, 180, 212 min, respectively. As a result, the smaller ones probably correspond to higher sensitivity (see below). Second, for the three thinner ones, a noticeable red shift (about 10–15 nm) of their longitudinal plasmon bands is observed at the early stage of the etching reaction. In contrast, for the GNR-18, the blue shift of the longitudinal is consistent and continuous, no any red shift occurs.

|
Download:
|
| Fig. 1. The evolution of TEM (A-L), LSPR spectra (M-P) and LSPR wavelength (Q-T) in the presence of H2O2 for GNR-8 (A, E, I, M, Q), GNR-10 (B, F, J, N, R), GNR-12 (C, G, K, O, S) and GNR-18 (D, H, L, P, T), respectively. The TEM images of E-L are the corresponding GNRs etching for 104, 108, 109, 108, 140, 156, 168, and 180 min, respectively. The concentrations of the used H2O2 are 192 mmol/L. All scale bars are 100 nm. | |
In terms of H2O2 only etching system, the etching rate is rather slow, and the used H2O2 concentrations are considerably high. So, Fenton reaction was then introduced for the following etching study, which would be more suitable for sensing applications because of higher sensitivity.
First, the effects of H2O2 concentrations on the etching reactions were investigated. As described in Fig. 2, in terms of GNR-8, for 100 nm blue-shift, the needed H2O2 is only 0.012 mmol/L; in contrast, for GNR-18, the same blue shift need about 0.024 mmol/L of H2O2. In the present system, we tentatively employed the lowest H2O2 concentrations for causing the perceptible blue shift of the longitudinal plasmon bands of various GNRs as the detection limit. Based on this definition, the detection limits for GNR-8, GNR-10, GNR-12 and GNR-18 are 0.025, 0.025, 0.060, and 0.075 mmol/L, respectively. Obviously, the thinner GNRs are employed, the higher sensitivity is obtained. These results are rather expected.

|
Download:
|
| Fig. 2. The blue shift of the plasmonic wavelengths (Δλ) for etched GNRs by Fenton reagents with different concentrations of H2O2. For all the etched systems, the concentrations of Fe2+ ions were fixed at 1 mmol/L. In terms of the etching, the orders of the reagents addition are: into the GNRs containing solutions, H2O2 was first added and then HCl and FeSO4 were sequentially added. | |
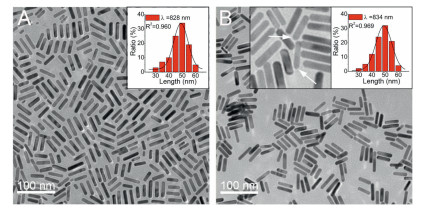
In terms of the red shift behaviors, we initially speculate that the above red shift of the GNRs' longitudinal plasmon bands result from reducing effects of H2O2 molecules [23]. To test this point, the order of reagents addition was then studied. As shown in Fig. S2 (Supporting information), as Fe2+ ions instead of H2O2 molecules were first added into the GNRs' solution, similar red shift of the plasmonic bands was also observed. These control experiments indicate that the red shift did not result from the slight lengthdiameter ratioincrease by H2O2 reduction. We then employed TEM technique to explore the red shifted products. As shown in Fig. 3, for the red-shifted GNRs, their length keeps almost invariable as compared with that of the unetched ones.

|
Download:
|
| Fig. 3. TEM images of GNR-12 before (A) and after (B) etching for 3 min by Fenton reaction system (0.002 μmol/L H2O2+1 mmol/L Fe2+). The inset of Fig. A is the length distribution of the unetched GNR-12. The right inset in Fig. B is the length distribution of the etched GNR-12. The left inset in Fig. B is the amplified TEM image of the etched products. A few sharped tips are pointed out by the arrows. | |
However, the tips of a few GNRs become rather sharp by the etching reactions. As GNRs' tips change from round to sharp, the length-to-diameter ratios of these parts should be increased, which therefore cause redshift of the plasmonic bands [24]. On the other hand, it is found that the three thinner GNRs exhibit some plasmonicredshift atearlystageof the etching, while GNR-18 does not show any red shift all the time. In terms of GNR with different diameters, their tips are different in several aspects, for example, ligands modification states, curvature, chemical reactivity, etc. These factors would affect the etching processes/behaviors. However, the exact mechanisms for the plasmonic red shift of the three thinner GNRs at the beginning of etching are not clear at present, which obviously needs further study.
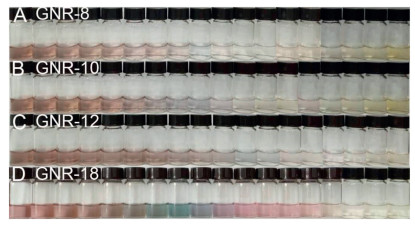
Because the above blue shifts can reach more than 200 nm, which provides the potentials for naked eye detection. Fig. 4 shows that the photos of the fourkinds of GNRs areetched in the presence of different concentrations of H2O2. In terms of GNR-8, GNR-10 and GNR-12, the colors of the GNRs only change from brown to light brown, which then becomes more and more lighter with further etching. Finally, the yellow solutions were obtained because the formation of Au3+ by etching reaction. For GNR-10 and GNR-12, some light cyan/lavender solutions were occasionally observed. In contrast, for GNR-18, the distinguishable colors contain luminous brown, celadon, green, blue, lavender, pink, light pink as well as yellow, during the etching processes. So, GNR-18, because of their more abundant color presentation, are especially appropriate to employ for naked eye detection.

|
Download:
|
| Fig. 4. Photos of the four kinds of GNRs etched by (H2O2-Fe2+) system. From left to right, the concentrations of the added H2O2 are 0, 0.003, 0.03, 0.3, 6, 30, 60, 90, 120, 150, 180, 210, 240, 270, 300, 330, 360, 390 μmol/L, respectively. The used Fe2+ is 1 mmol/L. The reaction time is 15 min. | |
In summary, we studied the effects of GNRs' diameters on the analytical performances of Fenton reaction based systems.The present results indicate that the diameters of the used GNRs can well affect the analytical performances, such as sensitivity and color presentation.In addition to Fenton reaction, such diameter dependent behaviors can probably work for other GNRs-etching reactions.
AcknowledgmentsThis work isfinancially supported by the National Natural Science Foundation of China (No. 21775004) and Wanjiang Scholar Program.
Appendix A. Supplementary dataSupplementary material related to this article canbe found, in the online version, at doi:https://doi.org/10.1016/j.cclet.2019.06.038.
| [1] |
K. Saha, S.S. Agasti, C. Kim, et al., Chem. Rev. 112 (2012) 2739-2779. DOI:10.1021/cr2001178 |
| [2] |
Y. Xia, Anal. Bioanal. Chem. 408 (2016) 2813-2825. DOI:10.1007/s00216-015-9203-3 |
| [3] |
A.M. Mohammed, Chin. Chem. Lett. 27 (2016) 801-806. DOI:10.1016/j.cclet.2016.01.013 |
| [4] |
Y.P. Jia, B.Y. Ma, X.W. Wei, et al., Chin. Chem. Lett. 28 (2017) 691-702. DOI:10.1016/j.cclet.2017.01.021 |
| [5] |
J. Fu, Z. Zhang, G. Li, Chin. Chem. Lett. 30 (2019) 285-291. DOI:10.1016/j.cclet.2018.10.031 |
| [6] |
M. Li, J. Chen, J. Pan, et al., Chin. Chem. Lett. 30 (2019) 541-544. DOI:10.1016/j.cclet.2018.11.017 |
| [7] |
Y. Li, Q. Luo, R. Hu, et al., Chin. Chem. Lett. 29 (2018) 1845-1848. DOI:10.1016/j.cclet.2018.11.016 |
| [8] |
H. Lei, Y. Hu, G. Li, Chin. Chem. Lett. 29 (2018) 509-512. DOI:10.1016/j.cclet.2017.08.012 |
| [9] |
M.H. Mashhadizadeh, R.P. Talemi, Chin. Chem. Lett. 26 (2015) 160-166. DOI:10.1016/j.cclet.2014.09.004 |
| [10] |
L. Vigderman, B.P. Khanal, E.R. Zubarev, Adv. Mater. 24 (2012) 4811-4841. DOI:10.1002/adma.201201690 |
| [11] |
L. Lu, Y. Xia, Anal. Chem. 87 (2015) 8584-8591. DOI:10.1021/acs.analchem.5b02516 |
| [12] |
P.K. Sudeep, S.T.S. Joseph, K.G. Thomas, J. Am. Chem. Soc. 127 (2005) 6516-6517. DOI:10.1021/ja051145e |
| [13] |
X. Liu, S. Zhang, P. Tan, et al., Chem. Commun. 49 (2013) 1856-1858. DOI:10.1039/c3cc38476d |
| [14] |
Z. Chen, C. Chen, H. Huang, et al., Anal. Chem. 90 (2018) 6222-6228. DOI:10.1021/acs.analchem.8b00752 |
| [15] |
Z. Zhang, Z. Chen, L. Chen, Langmuir 31 (2015) 9253-9259. DOI:10.1021/acs.langmuir.5b02113 |
| [16] |
Z. Zhang, Z. Chen, C. Qu, et al., Langmuir 30 (2014) 3625-3630. DOI:10.1021/la500106a |
| [17] |
Z. Zhang, Z. Chen, D. Pan, et al., Langmuir 31 (2015) 643-650. DOI:10.1021/la504256c |
| [18] |
X. Ma, Z. Chen, P. Kannan, et al., Anal. Chem. 88 (2016) 3227-3234. DOI:10.1021/acs.analchem.5b04621 |
| [19] |
Z. Zhang, Z. Chen, S. Wang, et al., ACS Appl. Mater. Interfaces 7 (2015) 27639-27645. DOI:10.1021/acsami.5b07344 |
| [20] |
B. Nikoobakht, M.A. El-Sayed, Chem. Mater. 15 (2003) 1957-1962. DOI:10.1021/cm020732l |
| [21] |
H. Jia, C. Fang, X.M. Zhu, et al., Langmuir 31 (2015) 7418-7426. DOI:10.1021/acs.langmuir.5b01444 |
| [22] |
C.K. Tsung, X. Kou, Q. Shi, et al., J. Am. Chem. Soc. 128 (2006) 5352-5353. DOI:10.1021/ja060447t |
| [23] |
X. Liu, H. Xu, H. Xia, et al., Langmuir 28 (2012) 13720-13726. DOI:10.1021/la3027804 |
| [24] |
A. Sánchez-Iglesias, N. Winckelmans, T. Altantzis, et al., J. Am. Chem. Soc. 139 (2017) 107-110. DOI:10.1021/jacs.6b12143 |