 2019, Vol. 30


b School of Mechanical and Materials Engineering, Washington State University, Pullman, WA 99164, United States
As an important parameter, intracellular pH plays a significant role in various biological processes [1, 2], including cell proliferation, metabolism, apoptosis, enzyme activity and homeostasis [3-5]. Intracellular pH fluctuation is directly linked with many diseases such as Alzheimer's disease [6], ischemic/reperfusion injury [7], and cancer [2]. For example, the level of Aβ1–42 aggregation in Alzheimer's disease is pH dependent [8, 9]. The intracellular pH alsomodulates theischemic/reperfusioninjuryeffectsin thekidney and other organs. Therefore, monitoring of intracellular pH fluctuation is of great importance.
Carbon dots (CDs), as a new nanomaterial in biosensing and bioimaging, possess good photostability, unique physicochemical and photochemical properties, as well as good biocompatibility [10, 11]. All these advantages with their facile preparation make CDs good potential candidates for fluorescent pH nanosensors [12-17]. Yu et al. reported the pH sensitive CDs (R-CPDs) through oxidative polymerization of para-phenylenediamine (p-PD) in the presence of FeCl3. The R-CPDs show fluorescence response in the pH range of 4–6 and have been employed in the imaging of pH fluctuation in HeLa cells [13]. Wang's group developed the blue emission CDs modified with laurylamine for intracellular pH imaging [14]. Ma and coworkers prepared CDs for ratiometric fluorescent pH sensing which was post-modified by pH sensitive fluorescein isothiocyanate and rhodamine B isothiocyanate [15]. To be a robust candidate for intracellular pH sensing, CDs are required to combine all the following properties as well: (Ⅰ) As the intracellular pH is in the range of 4.5–8.0, a pKa of CDs around 5.5–7.5 is required for accurate imaging [1]. However, the pKa values of most reported CDs are not in the desired range, which limited their further applications. (Ⅱ) For non-injury imaging of intracellular pH, CDs with emission at visible to near-infrared range are highly desired, which also has the advantage to eliminate the influence from severe absorption and high autofluorescence of biomolecules, leading to high signal-to-noise ratio and low phototoxicity [18, 19]. (Ⅲ) To overcome the interference from analyteindependent factors, such as photobleaching, local concentration of the CDs, changes of the microenvironment, instrumental factors (excitation and emission efficiency), ratiometric fluorescent pH probes are highly desired [20, 21]. Although good progresses have been made in CDs-based pH sensing, there are still existing some hindrances such as non-appropriate pKa value, shorter emission wavelength, or complicated post-modification treatment. Therefore, development of CDs-based fluorescent probes for intracellular pH sensing is still highly demanded.
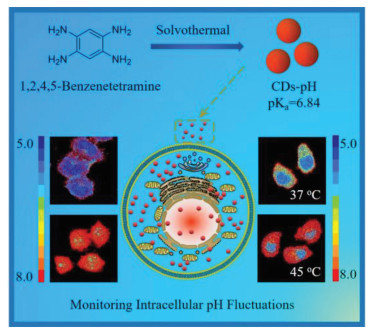
In this work, a novel SciFinder-guided design strategy was proposed to prepare fluorescent pH sensing carbon dots (CDs-pH) with programable pKa value. Employing SciFinder database, the pKa values of the rationally designed CDs-pH can be easily and exactly predicted. Much more importantly, the one-step synthesized CDs-pH show ratiometric fluorescence response toward pH with a near physiological pKa of 6.84, which well qualified all the above mentioned requirements and have been applied in pH fluctuation monitoring of living HeLa cells under heat shock with satisfactory results. This method is simple, flexible and versatile, which has a great potential to be used for the development of other types of CDs for various applications.
Recently researches reveals that, in the formation of CDs, precursors form fluorescent molecules in the very beginning; then the fluorescent molecules condense with the remaining precursors or other fluorophores to form the polymer clusters; through carbonization of the precursors, fluorescent molecules and polymer clusters intermediates, CDs can be prepared eventually. Fluorescent molecules, polymer clusters and carbon cores are all contributed to the photoluminescence center of CDs. Therefore, the as-prepared CDs preserve the chemical and photophysical properties of the fluorophore and polymer cluster intermediates [22, 23].
Ortho-, meta- and para-substituted phenylenediamines (o/m/p-PDs) are widely employed as precursors to prepare phenazine fluorophore and CDs under different synthetic conditions (Scheme S1 in Supporting information) [24-27]. Correspondingly, the as-prepared CDs could preserve some chemical and photophysical properties of phenazine fluorophore. As is well known, phenazine is a widely used type of fluorophore in dyes and probes [28, 29]. Through carefully introducing different amino group at different position, the pKa of phenzaine can be finely tuned. Does there exist a correlation between the pKa value of phenzaine fluorophore and that of CDs which are synthesized from the identical precursors? If there does exist a good correlation, when we need CDs for sensing intracellular pH, we can search the pKa values of different phenazine fluorophores in SciFinder and find precursors of those fluorophores. Then the CDs with desired pKa values can be prepared by routine synthesis methods.
Because the intracellular pH is in the range of 4.5–8.0 [2], to image the intracellular pH, the pKa around 5.5–7.0 is highly demanded. We searched the pKa values of distinct phenzaine derivatices from the SciFinder database, and found that the phenazine derivatives synthesized from o/m/p-OPA have pKa values at the range of 4.24–5.51 (Scheme S2 in Supporting information), which are obviously not suitable for the intracellular imaging. Whereas four amino group substituted phenazine (TA-Phenazine) has a pKa at 6.87, which is approaching to the desired value. Moreover, the absorption and emission of the four amino group substituted phenazine are located at the visible range. Based on the SciFinder result, the TA-Phenazine can be synthesized from 1, 2, 4, 5-benzenetetramine. So the 1, 2, 4, 5-benzenetetramine was selected as the precursor for the fabrication of desired CDs (Scheme 1).

|
Download:
|
| Scheme 1. Schematic illustration of CDs-pH for the synthesis route and the application in ratiometric intracellular pH sensing. | |
As shown in Scheme 1, the CDs-pH were prepared by heating 1, 2, 4, 5-benzenetetramine tetrahydrochloride (TAB) in alcohol at 135 ℃ for 15 min, followed by purification by dialysis (1 kDa cutoff) against alcohol. The solution of as-prepared CDs-pH in alcohol shows a clear red emission color under a hand-held UV lamp as shown in Fig. S1 (Supporting information).
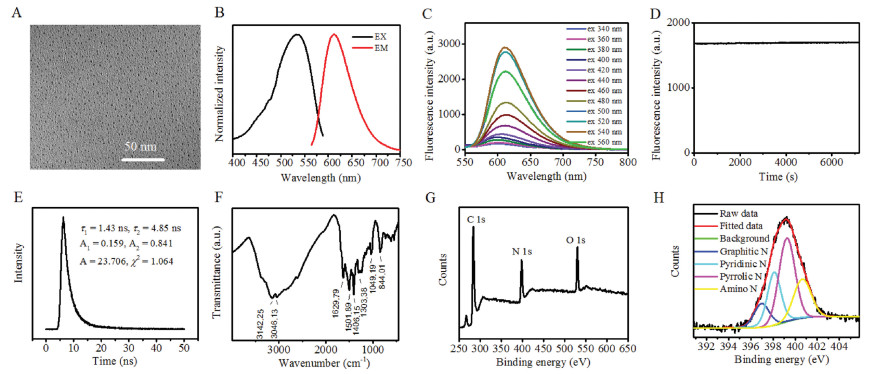
The morphologies of CDs-pH were characterized by transmission electron microscopy (TEM). The TEM images show that the diameters of CDs-pH mainly distribute from 2.4 nm to 6 nm with an average size of 4.0 ± 0.2 nm (Fig. 1A and Fig. S2 in Supporting information). CDs-pH exhibits main absorption and emission at 510 nm and 625 nm in alcohol with a high quantum yield of 12.7%, respectively (Fig. 1B). The emission wavelength of CDs-pH shows independent with excitation wavelength (Fig. 1C). As shown in Fig. 1D, the fluorescence of CDs-pH still retain approximately 99.5% of the initial intensity after 120 min continuous irradiation by a 150 W xenon lamp at 532 nm, indicating their superior photostability. From the PL decay curves of the CDs-pH shown in Fig. 1E, it is observed that the fluorescence lifetime of the CDs-pH is 4.31 ns. The surface composition and chemical state of the prepared CDs-pH were investigated via FTIR and XPS. As shown in Fig. 1F, the broad absorption peak at 3142 cm-1 and 3046 cm-1 in FTIR spectrum is attributed to aliphatic N-H. The peaks at 1629, 1406 and 1303 cm-1 can be attributed to C=O, C-N= and C-O stretching vibrations. Three peaks observed at 284.2, 398.1 and 531.1 eV in the XPS broad spectrum of CDs-pH, were attributed to C 1s, N 1s and O 1s (Fig. 1G). Fig. 1H shows the high-resolution XPS spectra of N 1s. N 1s spectrum was divided into four peaks at 397.0, 398.1, 399.3 and 400.6 eV corresponding to graphitic N, pyridinic N, pyrrolic N and amino N. This result shows that the N atoms were doped in the CDs-pH. Fig. S3 (Supporting information) shows the high-resolution XPS spectra of C 1s and O 1s. C 1s spectrum was divided into four peaks at 282.9, 283.8, 284.7 and 285.8 eV corresponding to C=O, C-N, C-C and C-O. The O 1s spectrum was divided into two peaks at 530.7 and 531.9 eV corresponding to C=O and C-O. The results fit well with the FTIR data, and the presence of -NH2 on the surface of CDs-pH indicate that the CDspH were successfully functionalized with -NH2. The -NH2 group can enhance the conjugation degree of conjugated systems of CDspH, which are expected to increase the electron transition probability and finally contribute to high QY of the CDs-pH.

|
Download:
|
| Fig. 1. (A) TEM graph of the CDs-pH. (B) Fluorescence excitation (black line) and emission (red line) spectra of the CDs-pH. (C) Emission spectra of CDs-pH (20 μg/mL) in alcohol at different excitation wavelength (start from 340 nm to 560 nm with a 20 nm increment). (D) Photostability of CDs-pH under continuous irradiation by a 150 W xenon lamp (Ex = 488 nm, Em = 625 nm). (E) Fluorescence decay curve of CDs-pH. (F) FTIR spectrum of the CDs-pH. (G) XPS spectrum of the CDs-pH. (H) High-resolution N 1s peaks of the CDs-pH. | |
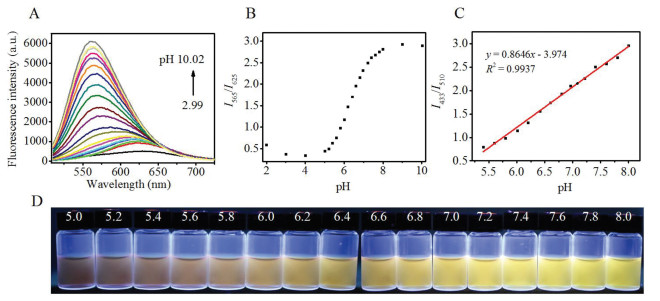
The absorption and fluorescence responses of the CDs-pH toward pH were subsequently examined (Fig. 2 and Figs. S4-S6 in Supporting information). Under acidic media (pH 2.99), the CDspH showed absorption maxima at 510 nm and fluorescence emission maxima at 625 nm. When the pH value was increased from 2.99 to 10.02, the absorption of CDs-pH was blue shifted to 433 nm. As shown in Fig. S4, the absorption ratio (I433/I510) of CDspH shows good linearity with the pH in the range of 5.4–8.0, and the pKa value is 6.89. At the same time, color change from red to orange with an appearance of a new emission band at 565 nm, which could be easily distinguished by bare eyes (Fig. S4). The shift of spectra can be attributed to the protonation/deprotonation of the pyridinic groups, then altering the ICT process of CDs-pH. Owing to such changes occurring at two different emission wavelengths, CDs-pH possesses support for performing ratiometric detection of pH. As shown in Fig. 2B, the fluorescence intensity ratio (I565/I625) of CDs-pH increases with an increase in pH, and shows good linearity with the pH in the range of 5.4–7.4, and the pKa value is 6.84 covering most of the physiological pH ranges which matches well with the data from UV–vis spectrophotometry. Moreover, the CDs-pH displays a good reversibility between pH 5.0 and pH 8.0 (Fig. S7 in Supporting information). Under irradiation with an ultraviolet hand-held lamp, the fluorescence images of CDs-pH at various pH values from acid to basic displayed obviously photoluminescence color changes from dark orange to bright yellow (Fig. 2D).

|
Download:
|
| Fig. 2. (A) Fluorescence emission spectra of CDs-pH in Britton-Robinson (BR) buffer solutions at various pH values (2.99, 4.00, 5.00, 5.20, 5.40, 5.60, 5.80, 6.01, 6.20, 6.41, 6.60, 6.80, 6.96, 7.21, 7.40, 7.60, 7.80, 8.00, 9.00 and 10.02) (λex = 488 nm, 10 mmol/L BR buffer). (B) The fluorescence ratio of CDs-pH at 565 nm and 625 nm in the same pH range. (C) The linear relationship between fluorescence ratio of CDs-pH and pH values in the pH range of 5.4 - 7.4, λex = 488 nm. (D) Photos of CDs-pH in BR buffer solutions at various pH values (5.0 - 8.0) under 365 nm UV lamp (from left to right: pH 5.0, 5.2, 5.4, 5.6, 5.8, 6.0, 6.2, 6.4, 6.6, 6.8, 7.0, 7.2, 7.4, 7.6, 7.8, 8.0). | |
To determine the potential interferences of biological matrix, the fluorescence spectra of CDs-pH were recorded in the presence of potential interferences, including various amino acids, essential metal ions (Na+, K+, Ca2+, Mg2+, Zn2+, Fe2+ and Fe3+), reactive sulfur species (GSH, Cys, Hcy), H2O2, and HClO. Figs. S8 and S9 (Supporting information) show that there are no visible changes in the ratio signals in presence of biological matrix, which show that CDs-pH hold great possibilities for investigating pH-related biological processes with little interference from the complex biological systems.
The cytotoxicity of CDs-pH on HeLa cells was assessed through a standard MTT assay. HeLa cells were treated with CDs-pH for 24 h at a series of concentrations (Fig. S10 in Supporting information). The results showed that CDs-pH did not cause clear toxicity to living human HeLa cells even at a rather higher concentration of 250 μg/mL (cell viability is 91.02%).
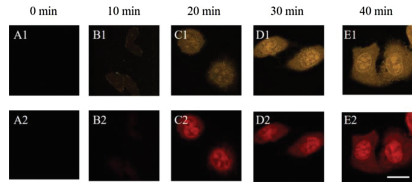
To demonstrate the applicability of CDs-pH to quantify the intracellular pH, fluorescent imaging experiments were conducted on live HeLa cells. As shown in Fig. 3 and Fig. S11 (Supporting information), after incubating HeLa cells with CDs-pH (20 μg/mL, which is much lower than the working concentrations of other reported CDs) for 30 min, bright emissions can be observed both in yellow and red channels. The result indicates that CDs-pH can enter into the cells rapidly, which might be attributed to the small size of the CDs-pH [30, 31]. The result is quite different from polymers or semiconductor quantum dots while those nanoparticles commonly require a few hours to enter into the cells [32, 33]. The good biocompatibility and fast response property endow CDs-pH with good potential in real-time fluorescence imaging of intracellular pH.

|
Download:
|
| Fig. 3. Fluorescence images of HeLa cells incubated with the CDs-pH (20 mg/mL) at 37 ℃ for different incubated time, 0 min (A1, A2), 10 min (B1, B2), 20 min (C1, C2), 30 min (D1, D2), and 40 min (E1, E2). The images of the first and second row were recorded in a range of 500 - 570 nm and 600 - 670 nm with λex = 488 nm. Scale bar: 20 μm. | |
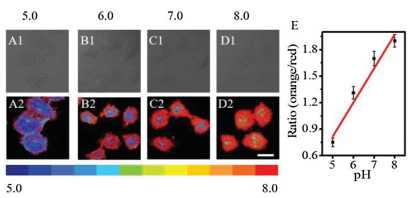
The calibration experiment of CDs-pH with intracellular medium at biological pH range from 5.0 to 8.0 was carried out (using H+/K+ ionophore nigericin, a standard approach for homogenizing the pH of cells and culture medium). The results obtained from confocal fluorescence imaging are shown in Fig. 4 and Fig. S12 (Supporting information). Remarkable pseudo-color changes were also observed in the physiological range between pH 5.0 and 8.0 with a good linear calibration curve (Fig. 4E), showing its good performance for intracellular pH imaging.

|
Download:
|
| Fig. 4. Bright field (A1-D1) and ratiometric fluorescence (A2-D2) images of HeLa cells incubated with the CDs-pH (20 μg/mL) for 30 min at 37 ℃ with different pH values (5.0, 6.0, 7.0 and 8.0). Ratiometric images of HeLa cells were analyzed by Image J. The fluorescent images were collected in 500 - 570 nm and 600 - 670 nm with λex = 488 nm. The color band on the bottom represents the variation of the fluorescence ratio change with pH. Scale bar: 20 μm. (E) Intracellular pH calibration curve of CDs-pH. | |
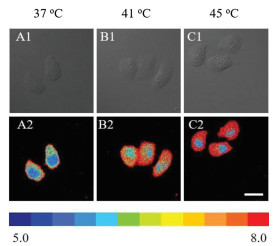
CDs-pH was also employed to study the influence of temperature on intracellular pH of living cells during heat shock. As shown in Fig. 5 and Figs. S13 and S14 (Supporting information), the intracellular pH values increase with temperature compared with the control group (37 ℃). The pH values in living cells were quantitatively determined based the well-defined pH calibration curves in Fig. 4E. The cytoplasm pH values of HeLa cells was determined to be 6.4 ± 0.1 at 37 ℃, which is corresponding with the reported value [34]. Meanwhile, the intracellular pH values increased to 7.4 under heat shock at 41 ℃ (Fig. 5). Moreover, after treatment at higher temperature (45 ℃), the cytoplasm pH value raised up to 7.8. These results clearly show that heat shock can lead to a pH increase in cytoplasm but slight increase in nucleus, from 6.0 to 6.2, which is consistent with the literature report that heat shock can induce permeabilization of cellular membrane leading to the increase of intracellular pH [35, 36].

|
Download:
|
| Fig. 5. Bright field (A1-C1) and fluorescence (A2-C2) images of HeLa cells incubated with the CDs-pH (20 μg/mL) under heat stroke at different temperature (37, 41 and 45 ℃) for 30 min. Ratiometric fluorescence images of HeLa cells were acquired by Image J. The color band on the bottom represents the variation of the fluorescence ratio change with pH. Scale bar: 20 μm. | |
In summary, a fluorescent ratiometric pH sensitive CDs for intracellular imaging was developed. The reported CDs-pH show high fluorescence quantum yield both in acid and basic solutions with a near physical pKa at 6.84. The CDs-pH shows high selectivity and good photostability. The ratiometric imaging of intracellular pH was achieved successfully by using the as-prepared CDs-pH. Moreover, these CDs-pH can monitor the change of intracellular pH under heat shock. This design strategy is simple and flexible and the pKa value of the CDs can be predicated from the SciFinder database. It is the hope of the researchers that this design principle will inspire the designing of other CDs for various applications.
AcknowledgmentsThe authors acknowledge financial support from the National Natural Science Foundation of China (No. 21205108), the Foundation for University Key Teacher by Henan Province (No. 2017GGJS007), China Postdoctoral Science Foundation (Nos. 2017M620302, 2018T110736), and the Key Scientific Research Project in Universities of Henan Province (No. 19A150048).
Appendix A. Supplementary dataSupplementarymaterial related to this article can befound, in the online version, at doi:https://doi.org/10.1016/j.cclet.2019.06.012.
| [1] |
J.T. Hou, W.X. Ren, K. Li, et al., Chem. Soc. Rev. 46 (2017) 2076-2090. DOI:10.1039/C6CS00719H |
| [2] |
K.A. White, B.K. Grillo-Hill, D.L. Barber, J. Cell. Sci. 130 (2017) 663-669. DOI:10.1242/jcs.195297 |
| [3] |
C. Stock, S.F. Pedersen, Semin. Cancer Biol. 43 (2017) 5-16. DOI:10.1016/j.semcancer.2016.12.001 |
| [4] |
T.M. Wang, L.C. Holzhausen, R.H. Kramer, Nat. Neurosci. 17 (2014) 262-270. DOI:10.1038/nn.3627 |
| [5] |
B.A. Webb, M. Chimenti, M.P. Jacobson, D.L. Barber, Nat. Rev. Cancer 11 (2011) 671-677. DOI:10.1038/nrc3110 |
| [6] |
S. Chen, Y. Hong, Y. Liu, et al., J. Am. Chem. Soc. 135 (2013) 4926-4929. DOI:10.1021/ja400337p |
| [7] |
Y.T. Tsai, J. Zhou, H. Weng, et al., Adv. Healthcare Mater. 3 (2014) 221-229. DOI:10.1002/adhm.201200365 |
| [8] |
S.K.A. Opare, A. Petoyan, B. Mehrazma, A. Rauk, Can. J. Chem. 94 (2016) 273-281. |
| [9] |
S. Kobayashi, Y. Tanaka, M. Kiyono, et al., J. Mol. Struct. 1094 (2015) 109-117. DOI:10.1016/j.molstruc.2015.03.023 |
| [10] |
T. Yang, Y.K. Li, M.L. C, J.H. Wang, Chin. Chem. Lett. 26 (2015) 1496-1501. DOI:10.1016/j.cclet.2015.10.018 |
| [11] |
J. Zhang, S. Wu, X. Lu, P. Wu, J. Liu, Nano Lett. 19 (2019) 3214-3220. DOI:10.1021/acs.nanolett.9b00725 |
| [12] |
Q.Y. Cai, J. Li, J. Ge, et al., Biosens. Bioelectron. 72 (2015) 31-36. DOI:10.1016/j.bios.2015.04.077 |
| [13] |
J. Xia, S. Chen, G.Y. Zou, Y.L. Yu, J.H. Wang, Nanoscale 10 (2018) 22484-22492. DOI:10.1039/C8NR08208A |
| [14] |
S. E, Q.X. Mao, X.L. Yuan, et al., Nanoscale 10 (2018) 12788-12796. DOI:10.1039/C8NR03453B |
| [15] |
W. Shi, X. Li, H. Ma, Angew. Chem. Int. Ed. 124 (2012) 6538-6541. DOI:10.1002/ange.201202533 |
| [16] |
H. Zhang, B. Zhang, C. Di, et al., Nanoscale 10 (2018) 5342-5349. DOI:10.1039/C7NR08987B |
| [17] |
Z. Li, Y. Wang, J. Wang, et al., Anal. Chem. 82 (2010) 7008-7014. DOI:10.1021/ac101405a |
| [18] |
L. Yuan, W. Lin, K. Zheng, L. He, W. Huang, Chem. Soc. Rev. 42 (2013) 622-661. DOI:10.1039/C2CS35313J |
| [19] |
R. Strack, Nat. Methods 12 (2015) 1111. DOI:10.1038/nmeth.3676 |
| [20] |
N. Boens, V. Leen, W. Dehaen, Chem. Soc. Rev. 41 (2012) 1130-1172. DOI:10.1039/C1CS15132K |
| [21] |
M. Vendrell, D. Zhai, J.C. Er, Y.T. Chang, Chem. Rev. 112 (2012) 4391-4420. DOI:10.1021/cr200355j |
| [22] |
S. Sun, Q. Guan, Y. Liu, et al., Chin. Chem. Lett. 30 (2019) 1051-1054. DOI:10.1016/j.cclet.2019.01.014 |
| [23] |
H. Liu, Y. Sun, J. Yang, et al., Sens. Actuators B-Chem. 280 (2019) 62-68. DOI:10.1016/j.snb.2018.10.029 |
| [24] |
K. Jiang, S. Sun, L. Zhang, et al., Angew. Chem. Int. Ed. 54 (2015) 5360-5363. DOI:10.1002/anie.201501193 |
| [25] |
H. Liu, Y. Sun, Z. Li, et al., Nanoscale 11 (2019) 8458-8463. DOI:10.1039/C9NR01678C |
| [26] |
S. Lu, L. Sui, J. Liu, et al., Adv. Mater. 29 (2017) 1603443-1603448. DOI:10.1002/adma.201603443 |
| [27] |
D. Rodríguez-Padrón, A.D. Jodlowski, G. de Miguel, et al., Green Chem. 20 (2018) 225-229. DOI:10.1039/C7GC03295A |
| [28] |
D. Heine, S. Sundaram, M. Beudert, K. Martin, C. Hertweck, Chem. Sci. 7 (2016) 4848-4855. DOI:10.1039/C6SC00503A |
| [29] |
X. Li, X. Gao, W. Shi, H. Ma, Chem. Rev. 114 (2014) 590-659. DOI:10.1021/cr300508p |
| [30] |
Y.F. Kang, Y.W. Fang, Y.H. Li, W. Li, X.B. Yin, Chem. Commun. 51 (2015) 16956-16959. DOI:10.1039/C5CC06304C |
| [31] |
S. Ruan, J. Qian, S. Shen, et al., Nanoscale 6 (2014) 10040-10047. DOI:10.1039/C4NR02657H |
| [32] |
R.S. Li, P.F. Gao, H.Z. Zhang, et al., Chem. Sci. 8 (2017) 6829-6835. DOI:10.1039/C7SC01316G |
| [33] |
H. Liu, Z. Li, Y. Sun, et al., Sci. Rep. 8 (2018) 1086. DOI:10.1038/s41598-018-19373-3 |
| [34] |
L. Lin, J. Zhao, L. Zhang, et al., Chem. Commun. 54 (2018) 9071-9074. DOI:10.1039/C8CC05385E |
| [35] |
Q. Wan, S. Chen, W. Shi, L. Li, H. Ma, Angew. Chem. Int. Ed. 126 (2014) 11096-11100. DOI:10.1002/ange.201405742 |
| [36] |
W. Xu, Z. Zeng, J.H. Jiang, Y.T. Chang, L. Yuan, Angew. Chem. Int. Ed. 55 (2016) 13658-13699. DOI:10.1002/anie.201510721 |