 2019, Vol. 30

Nowadays, fluorescent quantum dots (QDs) have received considerable attention [1] and widely investigated as a candidate biomarker [2] due to the excellent optical performance, special size effect and fluorescence quantum yield [3]. The development of novel QDs with high quantum yield and facile approach has become an urgent research focus, while the most studied are semiconductor QDs [4]. Two-dimensional layered graphite nanomaterials including metal-free graphene QDs and carbon QDs have been reported [5]. Their luminescent properties are greatly affected by surface states and modifications. Graphitic carbon nitride (g-C3N4) QDs not only has the characteristics of carbon nitride material itself, but also has excellent fluorescence, biocompatibility and low toxicity [6, 7]. Notably, it avoids the deficiency of traditional QDs, which has important value in the fields of analysis, biochemistry and imaging.
The facile preparation of g-C3N4 QDs with high fluorescent performance has become an important direction and two mainly approaches have been reported [8]. In a top-down approach, the carbon nitride of the bulk material is crushed and decomposed through ultrasound treatment, chemical stripping or hydrothermal etching of the bulk g-C3N4 [9]. Typically, when acid treatment and ultrasonically stripped bulk g-C3N4 are used, a production cycle of about 16–18 h is needed [10]. By contrast, bottom-up methods are used to form g-C3N4 QDs from nitrogen-rich precursors via microwave-assisting, hydrothermal polymerization or reactions [8]. Solid phase pyrolysis of a mixture of melamine and ethylenediaminetetraacetic acid [11], especially under microwaveassisted heating [12], can produce g-C3N4 QDs via intricate processes and solvent consumption. Therefore, it is still crucial to construct rapid, facile routes to produce strong fluorescent g-C3N4 QDs for practical application.
The recrystallization process can change the crystal form of compounds, which is benefit to adjust their properties [13]. In this work, the recrystallization process was adopted to change the crystal structure of the raw dicyandiamide, which was used to prepare the loose and porous layered bulk thin g-C3N4 (tg-C3N4). Hereby, we demonstrate a facile method for the preparation of highly fluorescent g-C3N4 QDs via ultrasonic exfoliation (Fig. 1), neither strong acid nor complex synthesis process is needed. It is worthwhile to expect that the bulk tg-C3N4 will be effectively stripped into g-C3N4 QDs within 90 min of sonication, giving excellent fluorescence performance. In addition, the size of g-C3N4, from 5 nm to 200 nm, is gradually reduced by controlling different ultrasonic time.

|
Download:
|
| Fig. 1. Schematic illustration of the preparation of g-C3N4 QDs. | |
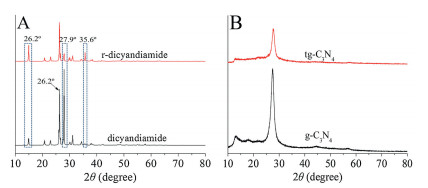
The XRD pattern of the recrystallized dicyandiamide (r-dicyandiamide) and raw dicyandiamide (Fig. 2) show three characteristic peaks including 14.9°, 26.2° and 27.9°. The strong peaks at 26.2° and 27.9° were attributed to the (002) phase and corresponded to the typical inter-planar stacking of the conjugated systems [14]. Compared with raw dicyandiamide, the peak strength of r-dicyandiamide decreased dramatically at 27.9°, which led to significant changes in the crystal of dicyandiamide and indicated the increase of stacking distance [15]. The second peak was attributed to the (100) phase at 14.9°. The peak strength of r-dicyandiamide increased, indicated that the r-dicyandiamide crystal had more crystal planes perpendicular to the crystal orientation. Thus, the results demonstrated that the crystal structure of dicyandiamide changes, which may be explained the reason for different performance of the tg-C3N4. Meanwhile, the XRD pattern of tg-C3N4 and g-C3N4 showed considerably similar, indicating the crystal structure of tg-C3N4 was not changed.

|
Download:
|
| Fig. 2. The XRD results for (A) r-dicyandiamide and dicyandiamide and (B) the tg-C3N4 and the bulk g-C3N4. | |
The FT-IR of the bulk tg-C3N4 and g-C3N4 were very similar (Fig. S1 in Supporting information). The strong peak in the region from 1200 cm–1 to 1680 cm–1 were assigned to the stretching vibration modes of C=N and C-N heterocycles. The peaks at 811 cm–1 was attributed to the triazine ring and 3600-3100 cm–1 were assigned to the N-H stretching band.
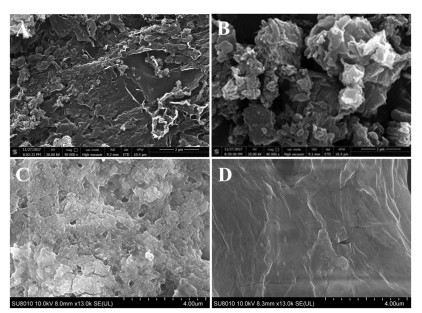
The difference of morphologies and structures were investigated with SEM, where a graphite-like layered and plate-like surface morphology were exhibited. The bulk g-C3N4 were solid agglomerates approximately several micrometers in size. An overlapped layer structure could be observed in the bulk tg-C3N4, which was clearly different from that in bulk g-C3N4 (Figs. 3A and B). The tg-C3N4 material had many holes and was relatively loose on the surface (Figs. 3C and D), leading to be more easily stripped into quantum dots. Overall, the different nanostructures were formed by a different sonicated degree of the tg-C3N4. It also could be explained the differences between tg-C3N4 and g-C3N4 of the FL intensity by the porous and loose structures [16].

|
Download:
|
| Fig. 3. SEM spectra of thetg-C3N4(A), theg-C3N4(B), tg-C3N4(C) by ultrasound 80 min and g-C3N4 (D) by ultrasound 10 h. Scale bar: 2 μm (A and B), 4 μm (C and D). | |
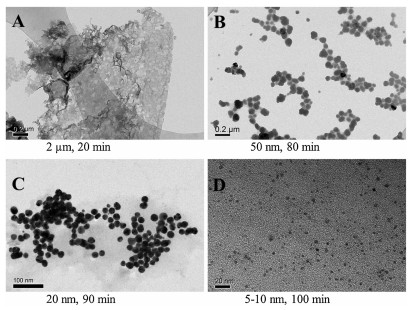
To further explore the formation and size of the as-prepared g-C3N4 QDs, we conducted the TEM measurements. With increasing ultrasonic time from 10 min to 100 min, the lateral size of the tg-C3N4 was decreased accordingly (Fig. 4). Meanwhile, after sonicating at 10 min, pores started to appear on the surface of the lateral. And the surface of the tg-C3N4 was relatively loose, which indicated this large layer structure was more easily exfoliated. The large pores began to distinct to form the quantum dots until they finally form nanomites and nanospindles. The mean size of g-C3N4 QDs could be adjusted within 5–200 nm according to the ultrasonic time. What is more, the corresponding AFM image revealed a thickness of the tg-C3N4 to g-C3N4 QDs in the range of 5.1-523 nm (Fig. S2 in Supporting information) [17]. All these results indicated that the formation of g-C3N4 QDs could be controlled by means of ultrasound, and it was important that, the preparation process of g-C3N4 QDs were simple, rapid and repeatable.

|
Download:
|
| Fig. 4. The TEM images of tg-C3N4 QDs with different ultrasonic time: 20 min (A), 80 min (B), 90 min (C), 100 min (D). | |
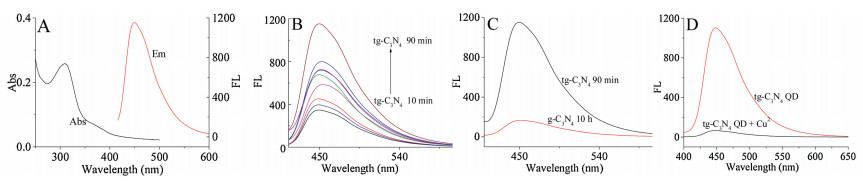
The remarkable optical properties of tg-C3N4 QDs were characterized by UV–vis absorption and fluorescence (FL) spectra. As shown in Fig. 5A, they presented a shoulder absorption peak at 320 and 360 nm. The peak at 320 nm was contributed by π-π* electronic transitions for carbon nitrides containing s-triazine rings and the peak at 360 nm indicated the n-π* electronic transitions of C = N and C = O in the tg-C3N4 QDs. Under an excitation of 360 nm (Fig. 5B), the tg-C3N4 QDs exhibited a strong blue fluorescence at 450 nm and its FL intensity was found to be ultrasound dependent as well as relevant to the particle size. The intensity were increased when the ultrasonic time changed from 10 min to 90 min, which corresponded to the gradual decrease in the particle size of the nanoparticles. It was worth noting that, the enhancement of FL intensity was estimated to be 1153 on the basis of tg-C3N4 QDs from ultrasound 90 min, which was much better than the traditional g-C3N4 QDs from ultrasound 10 h (Fig. 5C).

|
Download:
|
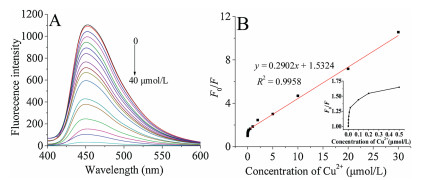
| Fig. 5. (A) UV–vis absorption and fluorescence spectra (FL) of the tg-C3N4 QDs; (B) FL spectra of tg-C3N4 with different ultrasound time; (C) FL spectra of tg-C3N4 with ultrasound 90 min and g-C3N4 with ultrasound 10 h. (D) FL spectra of tg-C3N4 QDs dispersion in the presence of Cu2+. | |
The analytical application of the g-C3N4 QDs was investigated via detecting of Cu2+. The material was used by sonicating the tg-C3N4 for 90 min and the size was 20 nm. We found that the introduction of Cu2+ into tg-C3N4 QDs dispersion led to a decrease of FL intensity, suggesting that it can quench the fluorescence effectively. Fig. 5D demonstrates the fluorescence responses of the tg-C3N4 QDs at 450 nm in the absence and presence of Cu2+ (30 μmol/L), indicated that the tg-C3N4 QDs could be an effective material for Cu2+ detection and had the value of practical application. Fig. 6 show the FL intensity of tg-C3N4 QDs decreases with the increase of Cu2+ concentration, and a good linearity from 1 μmol/L to 30 μmol/L can be obtained with a detection limit of 0.3 nmol/L (S/N = 3). The linear equation was F0/F = 0.2902 [Cu2+] +1.5324, with a correlation coefficient R2 of 0.9958. The performance of the method was compared with that of other methods [16, 18-22] for the analysis of Cu2+ (Table S1 in Supporting information), the linear response range has a good improvement as well as a better detection limit, indicating that the material had excellent fluorescence properties.

|
Download:
|
| Fig. 6. (A) Fluorescence responses of the tg-C3N4 QDs in the presence of increasing concentrations of Cu2+ (0, 0.0005, 0.001, 0.002, 0.005, 0.01, 0.02, 0.1, 0.2, 0.5, 1, 2, 5, 10, 20, 30, 40 μmol/L) in 5 μmol/L PBS (pH 7.0). (B) The linear responses between F0/F and the concentration of Cu2+. The inset figure presents the responses to Cu2+ ranging from 0 to 30 μmol/L. F0 and F represent the fluorescence intensities of the tg-C3N4 QDs at 450 nm in the absence and presence of Cu2+. | |
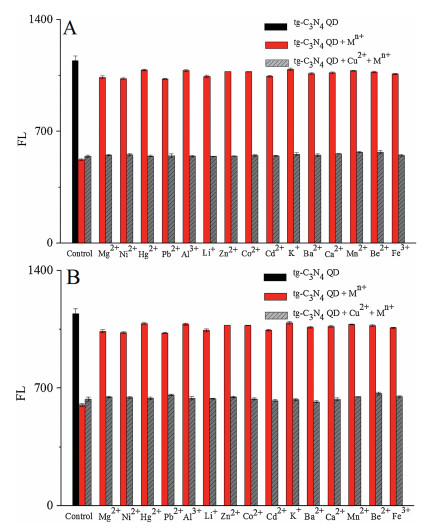
Heavy metal ion contamination was often extremely complex. The selective detection of heavy metal Cu2+ ions by tg-C3N4 QD fluorescent material provided a possibility for the specific detection of a certain metal ion. Fluorescence values were used to measure the degree of interference of other metal ions and mixed metal ions in detecting Cu2+. Fig. 7 shows the 1:1 and 1:5 (mole ratio) mixed equivalent metal ion interference experiments, respectively, examining Fe3+, Ba2+, Be2+, Li+, Hg2+, K+, Mn2+, Zn2+, Pb2+, Mg2+, Ni2+, Co2+, Ca2+, Cd2+ and Al3+, respectively. These metal ions did not have much effect on the tg-C3N4 QD. The fluorescence value caused by the mixed metal ions and the fluorescence value of the copper ions were almost identical, indicating that the material had a specific detection effect and good anti-interference ability.

|
Download:
|
| Fig. 7. Selective FL response of tg-C3N4 QD after treatment of 1.0 μmol/L Cu2+ solutions, and interference of 1.0 μmol/L of other metal ions with 1.0 μmol/L (A) and 0.2 μmol/L (B) Cu2+. | |
Different environmental water samples were collected from Zhujiang river, campus lake named Yanhu lake, tap water and the South China Normal University swimming pool. These water samples were filtered through a 0.22 μm membrane and then examined by FL to determine the content of metal ions. The Cu2+ content in the pool was measured to be 2.21 μmol/L and no found in the other water samples. The spiked recovery tests, 0.01, 0.1 and 1 μmol/L Cu2+ were added to these water samples, were further performed and the measured recoveries were 97.6%–104.9% with RSD of 1.8%–3.7%, indicated that tg-C3N4 QD was very effective and accurate to determine the Cu2+ content in actual water samples (Table 1).
|
|
Table 1 Analytical performance for Cu(Ⅱ) in real samples analysis with tg-C3N4 QDs. |

In summary, a facile, rapid approach to synthesize highly fluorescent tg-C3N4 QDs is obtained from the precursor of recrystallized dicyandiamide. The size of tg-C3N4 QDs can be simply adjusted by the ultrasonic time, and its FL intensity is great superior to the traditional g-C3N4 QDs. The obtained tg-C3N4 QDs can be successfully applied to the determination of trace Cu(Ⅱ) in different environmental water samples, showing good potential application on the analysis of environmental samples.
AcknowledgmentsWe gratefully acknowledge the support from the National Natural Science Foundation of China (No. 21605052), the Special Support Program of Guangdong Province (No. 2016TQ03R749), the Special Project of Science and Technology Development of Guangdong Province (No. 2017B020207011) and the Guangdong Natural Science Foundation (No. 2016A020221030).
Appendix A. Supplementary dataSupplementary material related to this article can be found, in the online version, at doi:https://doi.org/10.1016/j.cclet.2019.05.058.
| [1] |
S. Liu, L. Wang, J. Tian, et al., RSC Adv. 1 (2011) 951-953. DOI:10.1039/c1ra00249j |
| [2] |
X. Deng, C. Wang, Y. Gao, et al., Biosens. Bioelectron. 1 (2018) 211-217. |
| [3] |
M. Afiujjaman, H. Joon, K.S. Wak, Y. Lee, J. Nanosci. Nanotechnol. 18 (2018) 3793-3799. DOI:10.1166/jnn.2018.15242 |
| [4] |
Y. Zhao, L. Tan, X. Gao, G. Jie, T. Huang, Biosens. Bioelectron. 110 (2018) 239-245. DOI:10.1016/j.bios.2018.03.069 |
| [5] |
A. Ensafi, P. Nasr-Esfahani, B. Rezaei, Sens. Actuators B:Chem. 270 (2018) 192-199. DOI:10.1016/j.snb.2018.05.024 |
| [6] |
H. Xu, S. Liang, X. Zhu, et al., Biosens. Bioelectron. 92 (2017) 695-701. |
| [7] |
X. Pang, C. Cui, M. Su, et al., Nano Energy 46 (2018) 101-109. DOI:10.1016/j.nanoen.2018.01.018 |
| [8] |
D. Xiao, D. Yuan, H. He, J. Lu, Luminescence 28 (2013) 612-615. DOI:10.1002/bio.2486 |
| [9] |
X. Zhang, H. Wang, H. Wang, et al., Adv. Mater. 26 (2014) 4438-4443. DOI:10.1002/adma.201400111 |
| [10] |
W. Wang, C. Jimmy, Z. Shen, D. Chan, T. Gu, Chem. Commun. 50 (2014) 10148-10150. DOI:10.1039/C4CC02543A |
| [11] |
Y. Su, B. Sun, S. Chen, H. Yu, J. Liu, RSC Adv. 7 (2017) 14832-14836. DOI:10.1039/C7RA00671C |
| [12] |
Y. Tang, Y. Su, N. Yang, L. Zhang, Y. Lv, Anal. Chem. 86 (2014) 4528-4535. DOI:10.1021/ac5005162 |
| [13] |
X. Wei, HMX Re-crystallization and Characterization, Master Dissertation, Sichuang University, 2007.
|
| [14] |
J. Tian, Q. Liu, A. Asiri, A. Al-Youbi, X. Sun, Anal. Chem. 85 (2013) 5595-5599. DOI:10.1021/ac400924j |
| [15] |
Y. Yu, W. Yan, X. Wang, et al., Adv. Mater. 30 (2018) 1705060.
|
| [16] |
C. Zhang, J. Luo, L. Ou, et al., Chem.-Eur. J. 24 (2018) 3030-3037. DOI:10.1002/chem.201705560 |
| [17] |
P. Yang, J. Zhao, J. Wang, et al., J. Mater. Chem. A 3 (2015) 136-138. DOI:10.1039/C4TA05155F |
| [18] |
S. Chen, N. Hao, D. Jiang, et al., J. Electroanal. Chem. 787 (2017) 66-71. DOI:10.1016/j.jelechem.2017.01.042 |
| [19] |
M. Rong, X. Song, T. Zhao, et al., J. Mater. Chem. C 3 (2015) 10916-10924. DOI:10.1039/C5TC02584B |
| [20] |
H. Wang, Q. Lu, M. Li, et al., Anal. Chim. Acta 1027 (2018) 121-129. DOI:10.1016/j.aca.2018.03.063 |
| [21] |
Z. Gong, C. Hao, Y. Chen, P. Wan, X. Meng, Chin. Chem. Lett. 28 (2017) 1901-1904. DOI:10.1016/j.cclet.2017.05.005 |
| [22] |
M.C. Rong, K.X. Zhang, Y.R. Wang, X. Chen, Chin. Chem. Lett. 28 (2017) 1119-1124. DOI:10.1016/j.cclet.2016.12.009 |