 2019, Vol. 30


Nanopore analysis technology had gradually flourished since the 1990s [1, 2]. It benefited from the continuous development in apparatus of nanotechnology, such as atomic force microscopy (AFM), high-resolution transmission electron microscopy (HRTEM), scanning electron microscope (SEM), which facilitated the fabrication processes and characterization methods. At present, in the field of nanopores, there are mainly two categories, biological nanopores and solid-state nanopores. As the first biological nanopore, Staphylococcus aureus α-hemolysin was mounted in a phospholipid membrane by Kasianowicz in 1996 for the detection of single-stranded DNA (ssDNA) [3]. In 2003, another biological nanopore MspA porin was extracted from mycobacteria and was later used in DNA sequencing and single molecule analysis [4, 5]. However, researchers have found that biological nanopores, especially when embedded in lipid bilayers, have many insurmountable shortcomings, such as fixed pore size and limited stability. In the experimental processes, if the external environment (pH, salt concentration, temperature, and mechanical force) changed, lipid bilayers and biological pores might become unstable.
Different from biological nanopores, the development of solidstate nanopores was driven dramatically by the physicists after 2001. They created the ways of focused ion beam (FIB), e-beam and other methods, which provided practical fabrication techniques for artificial solid-state nanopores [6, 7]. In recent years, as the family of solid-state nanopores expanded, a large number of materials and devices have been used to fabricate the solid-state nanopores, such as silicon materials, graphene, MoS2, and nanopipettes [8, 9]. The porous structure of anodic aluminum oxide (AAO) membrane and other porous systems were beyond the scope of this review because our focus was on single solid-state nanopore, in which the specified single nanopore could be precisely investigated by the current-voltage curve. Meanwhile, the current in AAO was generated from the ions or small molecules transportation through large numbers of nanopores, which could not be ascribed to one single pore. As a result, only single pore silicon materials, nanopipettes, graphene, MoS2, and polymer films were discussed in this review. These solid-state nanopores had obvious advantages over biological nanopores as they had high stability, controllable diameter and channel length, adjustable surface properties, and potential for the integration into devices [2, 10]. The relationship between solid-state nanopores and biological nanopores was complementary. They promoted the development of nanopores together in the field of biology and chemistry and deserved our research efforts [11].
This review focuses on the development of solid-state nanopores in recent years, mainly about the fabrication of nanopores, the study of the transport mechanism and the analysis of ions and small molecules. DNA sequencing and detection of macromolecules such as proteins and DNA are not involved in this review. With the specific structures and sizes, the analysis of macromolecules in nanopore normally includes the molecular translocation, sequencing and data interpretation. The blocked current indicates DNA or protein passed through the nanopore, and the structural information could be obtained through the decrease of current in the current-time curves when the constant voltage is applied. The nanopore analysis of macromolecules is not our focus in this review. The ion transport in nanopore is discussed in detail because the mimic of biological nanopores with solid-state nanopore analogs could contribute the investigation of unsolved mechanism based on interesting phenomenon that ions could specifically pass through the biological pore [12]. The ion transport mechanism is summarized into two aspects: the nonlinear ion transport phenomena and ion selectivity between different ions. ICR (ionic current rectification) is a special nonlinear ion transport phenomenon, which is discussed from the experimental construction of solid-state nanopore, such as glass pipettes and polymer film nanopores as well as the simulation of ICR. As for the small molecule analysis, based on the ICR mechanism, the in vitro and in vivo detection of small molecules could be established with the nanopore technique [13]. The field of solid-state nanopores not only has great significance in fundamental research in ion channels and pathological studies but also has a promising future in energy applications [14, 15].
2. FabricationWith modern nanotechnology, the techniques for nanopore fabrication processes can be precisely controlled [16]. Currently, there are mainly five ways to fabricate a single solid-state nanopore. The general nanopore fabrication process can be divided into the opening and the tuning steps. We summarized these nanopore opening methods in Table 1 [10, 12, 17-35] and elaborated in next paragraphs.
|
|
Table 1 Five methods to fabricate single solid-state nanopore. |

2.1. Ion-beam
In 2001, Golovchenko's group used argon ion-beam sputtering to make a single nanopore in a Si3N4 membrane [17]. The first step in ion beam sculpting was to make a pore through FIB [36]. The sample with a large bowl-shaped cavity in a free-standing Si3N4 membrane was sculpted by argon ion-beam, meanwhile the ions transmitted through the opening pore could be counted in a feedback-controlled ion sputtering system, which could extinguish the erosion process at the appropriate time. The pores were commonly ~100 nm, but could be made much smaller through tuning methods. They observed that pores could be enlarged and shrunk with the modulation of ion rate and temperature, allowing the fine-tuning of pores in the nanometer ranges. Subsequently, the researchers could expand the way of ion-beam to fabricate nanopore materials other than Si3N4, such as SiC, SiO2 and graphene [18-21].
2.2. E-beamIn 2003, H.W. Zandbergen and C. Dekker fabricated solid-state nanopores with single-nanometer precision by using electronbeam lithography and anisotropic etching [22]. The principle was similar to the way of ion-beam. The technique of e-beam could fabricate nanopores in the range of 2–200 nm by manipulating the beam parameters, such as current, intensity and dwell time. They could prepare nanopores with high precision through introducing the auxiliary gases, such as XeF2 [23]. Similar to ion-beam, extra tuning steps, such as deposition and thermal treatment, were normally required to obtain the desired size of nanopores [24].
2.3. Track-etching techniqueTrack-etching technique was one of the oldest techniques of fabrication nanopores in the membranes. It was simple and costeffective, and precisely offered determined structure. The nanopores could be produced by energetic heavy ions and subsequent chemical etching. This technique has been mostly applied to prepare nanopores in polymer films such as poly(ethyleneterephthalate) (PET), polycarbonate (PC) and polyimide (PI) [25]. First, a dielectric film was irradiated with energetic heavy ions and the latent tracks were created during the irradiation. Then, the film was chemically etched to obtain pores with desired nanoscale or microscale dimensions [26]. In contrast to the cylindrical inner structures of nanopores drilled by ion-beam or e-beam, the geometries of nanopores obtained by this technique was conical, pyramidal, funnel-like, or cigar-like at will.
2.4. Controlled dielectric breakdown (CBD)In 2014, Cossa's group developed a fast and simple approach to fabricate a single nanopore directly in solution down to 2-nm with sub-nm precision, by controlling dielectric breakdown at the nanoscale. The method relied on applying a voltage across an insulating membrane while monitoring the induced leakage current [27, 28, 37-39]. The CBD method (Fig. 1) provided an inexpensive way to fabricate a nanopore rapidly in the membrane.

|
Download:
|
| Fig. 1. Nanopore formation by CBD. (a–d) Schematic representations of nanopore formation progresses by CBD. (e) Leakage current density for SiNx membranes. (f) Leakage current at 5 V, on a 10-nm-thick SiNx membrane, in 1 mol/L KCl at pH 13.5. Pore created was ~5 nm. (g) Leakage current at 15 V, on a 30-nm-thick SiNx membrane, in 1 mol/L KCl at pH 10. Pore created was ~3 nm. (h) Ⅰ-Ⅴ curves for 3 nanopores fabricated on different membranes, in 1 mol/L KCl at pH 8. The legend showed the (pore diameter)/ (membrane thickness) in nm. Copied with permission [27]. Copyright 2014, Public Library of Science. | |
Inspired by CBD, many physicists and chemists applied this method on fabricating nanopores in two-dimension (2D) membranes, such as graphene and MoS2. In 2015, Golovchenko's group created an in situ method by applying ultra-short, high-voltage pulses across the graphene membrane in electrolyte solution, which could control the size of the nanopores [29]. Then, Radenovic's group prepared the nanopore in MoS2 by electrochemical reaction [30]. The electrochemical reaction on the surface of single-layer was initiated at the location of defects or single atom vacancy, followed by the successive removals of individual atoms from single-layer MoS2 lattice, and a nanopore finally formed.
The method of electrochemical reaction made the preparation of nanopores more accessible, furthermore, the requirements of the instrument were not high and the technique did not need professional operations like FBI and e-beam.
2.5. NanopipettesThe nanopipettes were usually fabricated from glass or quartz capillaries through mechanical pullers, for example, Sutter P-2000 laser puller. The tips of capillary were formed by applying laser heat to soften the capillary and then physically pulling the capillary to separate into two identical parts. The control over pulling parameters allowed the pipet geometry to be tuned with different taper lengths and opening diameters, while the tip geometry could be further tuned with microforges [31].
3. Study of ion transport in nanoporesBiological ion channel was virtually expressed by all living cells that created a pathway for charged ions, including K+, Na+, Ca2+, and Cl-. Precisely controlled movements of ions across the nanopores in the cell membrane were essential for all life activities. Mimicking biological ion channels with artificial nanopores to study transport mechanism was the most challenging task [40, 41]. In the nanometer or subnanometer pores, the movement of ions behaved differently depending on the moving directions. Thus, abnormal nonlinear current-voltage (Ⅰ-Ⅴ) curves were obtained. In this review, we focused on the phenomena of ICR, other nonlinear ion transport phenomena and ion selectivity.
3.1. ICRICR was a phenomenon of nonlinear ion transport that has been extensively studied in recent years. It was first observed in a quartz nanopipette electrode in 1997 [42]. Since then, ICR has been observed in silicon-based nanochannels, glass pipettes, and tracketched polymer membranes. ICR was strongly affected by the relative dimensions between diffuse electrical double layer (EDL) thickness and pore size. ICR was only observed when the diameter of nanopore was comparable to the thickness of the EDL. In this situation, the EDL on the surface of nanopore was overlapped and the current (ion flux) must pass through the diffuse layer. Thus, the electrostatic interaction between ionic species and surface charges would affect ion transport properties [43]. Normally, ICR was also related to the electrolyte concentration that it would disappear when the concentration was higher than 0.1 mol/L due to the attenuation of the EDL.
A lot of substrates with a single nanopore could be used to investigate the mechanism of ICR, such as glass pipettes, polymer film, Si3N4, graphene or silicon materials. Amongst them, glass pipettes and polymer film nanopores or modified of these nanopores were the most commonly used in the study of ICR owing to the convenient fabrication processes [44-48]. Thus, our focus was the ICR on conical nanopores of glass pipettes and polymer film.
3.1.1. NanopipettesIn 1997, Bard's group discovered ICR at nanopipette electrodes when the concentrations of KCl electrolyte was less than 0.1 mol/L [42]. They considered it was attributed to the formation of EDL within the tip orifice. The inner surface of pore wall was negative charged in the KCl solution. When positive voltage applied on the tip electrode, K+ moved out of the tip but it was limited by a largely linear process and constrained by the tip diameter. For a negative tip electrode, K+ moved in from a hemispherical field outside the tip and was less hindered, producing a larger current. The pH also influenced the nonlinear Ⅰ-Ⅴ behavior as it changed the charges of inner pore walls. When the concentration of HCl electrolyte increased without the changes of KCl concentration, the Ⅰ-Ⅴ curves gradually became linear and then the direction of ICR was opposite.
ICR has been observed mostly at nanometer scales in the early time, while it was difficult to achieve when the pore diameter was 10 times larger than the thickness of the EDL. However, in 2010, Mayer's group demonstrated that ICR was generated at micropippets with diameters up to 2.2 μm by introducing more asymmetric factors, such as asymmetric electrolyte solution [49]. In 2017, Mao's group observed ICR in polyimidazolium brush (PimB)-modified micropippets in symmetric electrolyte solution. The diameter of the PimB-modified micropippet was up to 5 μm [50]. They proposed a three-layer model on the surface of micrometer-scale pipettes to explain the phenomenon, including a charged layer, an electrical double layer, and a bulk layer. When charges on the charged layer were comparable with those in the bulk layer, ICR would occur regardless of whether the electrical double layers were overlapped.
The charge on the surface of nanopore influenced the direction of ICR. Karhanek's group confirmed the direction of current rectification was inversed when quartz nanopipettes were coated by poly-L-lysine (PLL), and this reverse was contributed by the inverted surface charge of the PLL coating comparing to the uncoated pipettes [51]. The direction of rectification in nanopipettes was also reversed by the modification of the surface with poly(ethylene imine) (PEI) which was positively charged [35]. ICR could be observed with pore size of 4 nm for unmodified pipet, while the direction of rectification reversed after the surface modification with PEI. Meanwhile, the modification from uncoated nanopipettes to PEI coating was also investigated with the pore size of several hundred nanometers. The Ⅰ-Ⅴ curves were linear for pipettes with larger diameter while they behaved nonlinear when the surfaces were coated with PEI. The degree of ICR was investigated with the influence of pH and concentration of solution as these factors affected the charge and the thickness of EDL.
Then in 2018, the phenomenon of rectification inversion was also reported at the PimB modified nanopipettes, which was induced by chaotropic monovalent anions (for example ClO4-, PF6-, Tf2N-) with the pore size of 300 nm [52]. For chaotropic anions, the rectification inversion was significantly dependent on the electrolyte concentration, while there was no rectification inversion with kosmotropic anions. For example, the phenomenon of rectification inversion was easily observed with the chaotropic monovalent anion of ClO4- even at a low concentration (5 mmol/L), while there is no rectification inversion observed for the kosmotropic monovalent anion of Cl- even at a high concentration (1 mol/L). They considered the rectification inversion originated from a concentration dependent adsorption for which the charge inversion was induced by adsorption of monovalent anion. In other words, the more chaotropic anions would strengthen the adsorption at the interface and resulted in the decrease of positive charge density, consequently leading to the decrease of the rectification ratio. They ruled out the effect of ion mobility on the rectification inversion, while six kinds of monovalent anions (Cl-, NO3-, BF4-, ClO4-, PF6-, Tf2N-) had been found to have a good correlation with the original Hofmeister series [53].
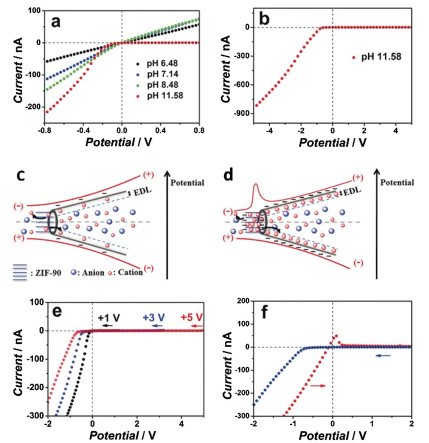
Later, Wang's group reported the rectification ratio could reach several hundred when the capillary tip was modified by porous MOF material (ZIF-90) in situ [54, 55]. Even if the concentration of KCl electrolyte was up to 1 mol/L, the clear nonlinear Ⅰ-Ⅴ curve was obtained. They also reported ion transfer in this sub-nanometer channels strongly depended on the pH of solution. As pH increased from 6.48 to 11.58, the charge of ZIF-90 turned from neutral to negative. At the same time, the linear Ⅰ-Ⅴ curves changed to slightly bent shape obviously, then to the nonlinear curve with the maximum rectification ratio (Figs. 2a and b). The detailed theoretical researches were carried out on the processes of ion transport (Figs. 2c and d). They discussed the reasons for the different results from measurements in diverse voltage ranges and directions. When the scanning direction was from positive to negative, the different voltage ranges affected the degree of the rectification ratio and the turning point which the current switched from off to on. When the scanning direction was inverted, from negative to positive, the Ⅰ-Ⅴ curve showed a small peak and then suddenly dropped to almost zero. The phenomenon was due to the K+ accumulation in the channel of ZIF-90 (Figs. 2e and f).

|
Download:
|
| Fig. 2. (a) Ⅰ-Ⅴ curves of glass nanopipette supported ZIF-90 (GNS-ZIF-90) in 1 mol/L KCl solutions with different pH values. (b) Ⅰ-Ⅴ curve of GNS-ZIF-90 scanned at potentials from +5 V to -5 V in 1 mol/L KCl (pH 11.58). Schematic representation of the rectification mechanism in neutral (c) and alkaline (d) solutions; (e) Relationship of the current turning point with starting potential. (f) Relationship of the current turning point with scanning direction. Copied with permission [54]. Copyright 2017, WILEY-VCH Verlag GmbH & Co. KGaA, Weinheim. | |
The phenomenon of ICR mentioned above was attributed to the strong electrostatic interactions between the ions and pores, which resulted in the accumulation and block of ions in the nanopore.
3.1.2. Polymer film nanoporesSiwy's group has focused on conically shaped nanopores in polymer films for several years [26, 33, 34, 56-59]. The formation of PET nanopore was prepared through the track-etching technique. Similar to glass pipettes, they found the nanopores with surface charges serve as conical-nanotube ion-current rectifiers in 2004 [32]. They deposited a conical Au nanotube along the walls of PET, in which the small diameter opening was ~20 nm and the larger opening at the opposite face was ~600 nm. The electrolyte solutions were 0.1 mol/L KCl in both half cells or 0.1 mol/L KF in both half cells, but the Ⅰ-Ⅴ curves showed different shapes with different electrolytes. The Ⅰ-Ⅴ curve was ordinary linear and ohmic in KF, but the rectification was obtained in KCl. The reason was the Au surface was negatively charged after absorption of Cl-, while F- was not adsorbed to Au surface. Moreover, further chemical modification of Au surface in different pH resulted in the regulation of rectification in KF. The conical Au nanotube with chemisorbed thiol mercaptopropionic acid showed rectification in 0.1 mol/L KF electrolyte when pH was 6.6. However, the ICR of the above nanotube disappeared at pH 3.5. The reason was that the carboxyl groups modified on the pore surface were deprotonated as pH increased, yielding negative surface charge and resulting in the ICR. The carboxyl groups were neutral at lower pH, resulting in no rectification. Also, the modification of the mercaptoethylammonium cation gave the positive charge on Au nanotube surface, and the direction of ICR was inverted. The above results showed that regulation of surface charge on the Au nanotube wall was essential for tuning ICR.
The important role of charges was also proved by modifying conical PI nanopore with zwitterionic polymer, 4, 4'-azobis (4-cyanopentanoic acid), which could combine or dissociate proton. The Ⅰ-Ⅴ curves were measured in 1 mol/L KCl electrolyte with pH changed from 2 to 10 [60]. Under acidic conditions, the positive charge on -NH3+ species gradually decreased as pH changed from 2 to 4, resulting in the decrease of rectification ratio (R) from 22 to 9. The net charges were zero when pH was 5 which was close to the isoelectric point of the zwitterionic brush (pI~4.7). In this situation, there was nearly no rectification at pH 5. When the pH increased above 5, the surface was negatively charged as -COOH dissociated proton to form -COO-. Changing the pH from 6 to 10, the direction of rectification behaved opposite to the acidic conditions, meanwhile the value of R increased from 5 to 17. The conical nanopores decorated with zwitterionic polymer was found asymmetric pH responsive. The direction and degree of ICR were all influenced by pH, which made polymer film nanopores artificially controllable.
The modified nanopores not only responded to pH but also were responsive to temperature and voltage. The asymmetric modification of PET single nanopore with poly(N-isopropylacrylamide) (PNIPA)/poly(acrylic acid) (PAA) displayed the advanced features, which provided control over asymmetric ionic transport properties by tuning pH and temperature [61, 62]. Moreover, the current flux of PET inner nanopore modified with DNA strands could be controlled by pH and voltage [63]. In the nanopore of 8 nm, when a negative voltage was applied at the larger pore opening at pH 8, the ion current flux reduced because the negatively charged DNA strands moved towards a small pore and the modification blocked the nanopore partially. As the direction of applied voltage reversed, the charged DNA strands moved towards a larger pore which induced the increasement of the ion current flux. Therefore, the direction of applied voltage would influence the value of rectification ratio. At the same time, pH had a significant effect on rectification in this device. When pH lowered to 5.5 and a negative voltage was applied at the larger opening, an electrostatic mesh was formed as DNA chains were partially protonated to produce partially positively charged DNA strands. As the result, the pores were closed and no ions passed. When a negative voltage was applied at the smaller pore opening, the electrostatic mesh was partially destroyed and there was less current passing through the nanopore. It showed that the rectification ratio was nearly one in sixteenth to that of pH 8. The modification strategy that affected rectification with pH and voltage simultaneously could be used for many aspects such as biosensing, drug delivery, and ion circuit construction.
Similar to glass pipettes, all of these ICR phenomena on polymer film nanopores were almost in nanoscale. ICR could also occur on nearly micron scale in highly charged conical PET pores whose tip diameters were as large as 400 nm which was over 100-fold larger than the EDL thickness [64]. The pore at 10 mmol/L pH 3 or 6 KCl electrolyte showed linear Ⅰ-Ⅴ curves, while it started to rectify once the pH of the solution was increased to 11 with the R value up to 10. The results indicated that the pore's transport properties remained unaffected by the changing pore wall characteristics at lower pH values. When the pH was higher, ICR occurred owing to high surface charge density which was created at basic conditions. This unexpected phenomenon was modelled by employing the surface equilibrium reaction of carboxyl and the effect of electroosmotic flow. The results showed that the rectification was caused by the presence of high-density surface charges owing to carboxyl and high-migration hydroxide ions, the concentration of which was enhanced in one voltage polarity.
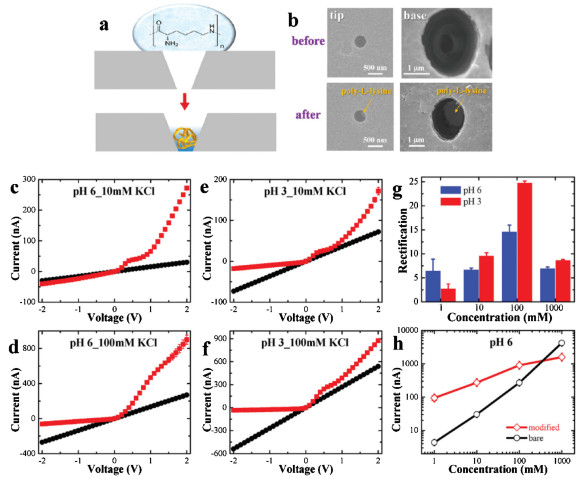
Moreover, Siwy's group found rectification was caused by concentration polarization in mesoscale PET pores (Figs. 3a and b) [65]. The results showed the nanopore modified with PLL rectified the current even in 1 mol/L KCl electrolyte. The rectification degree reached around 25 in 100 mmol/LKCl electrolyte and8 in1 mol/LKCl electrolyte at pH 3. The link between the ICR and pH was similar to the previous reports, the rectification degrees at pH 3 were found higher than pH 6 due to a higher charge density of PLL in the more acidic condition.The currentwas rectifiedintheoppositedirectionat pH 12 as they predicted (Figs. 3c–f). Interestingly, there was plateau present at intermediate voltages which was known to be caused by concentration polarization (CP) [66, 67]. The model was set in COMSOLmultiphysics software inwhich they concluded ICR and the presence of plateau was a result of interplay between CP and the charge in the conical pore geometry. The mechanism of ICR in this pore was the competition between the applied electric field and the electric field induced by CP.

|
Download:
|
| Fig. 3. Anomalous ion transport in a mesopore partly filled with PLL. (a) Schematic of the system. (b) SEM images of the tip and base sides of a pore before (top) and after (bottom) PLL modification. (c-f) Experimental Ⅰ-Ⅴ curves of a single PET conical pore with a tip opening diameter of 400 nm in various KCl solutions before (cirf; ) and after (red squf; ) PLL modification. (g) Rectification degree at 2 V for various KCl concentrations. (h) Dependence of the measured current on KCl bulk concentration at pH 6 and +2 V for the bare and modified PET pore. Copied with permission [65]. Copyright 2019, American Chemical Society. | |
The ICR in nanopores were broadly investigated on both glass pipettes and polymer film. It was believed that the nature of the ICR might be related to the different ion transport mechanisms between cation and anion in the nanopores. Unlike the linear transport process in larger pores, the ions in confined nanoscale pore behaved unusually, inwhich the nonlinear Ⅰ-Ⅴ curves were observed owing to the asymmetry movement of ions. The study of ICR in solid-state nanopore is significant as it will further our understanding of the mechanism in confined nanoscale. It is beneficial to mimicking biological ion channels and creating new functional nanodevices.
3.1.3. Simulation of ICRThe main factors that cause phenomenon of ICR are geometric shape of nanopores, ion concentration in electrolyte, and surface charge density of nanochannels [43]. In order to describe ICR in qualitative and quantitative ways, theoretical calculation is performed by solving Poisson-Nernst-Planck (PNP) equation [68]. The variation of the electric potential denoted as V satisfies the Poisson equation (Eq. (1)):

|
(1) |
where ε0, εr, F, zi, ci, are the permittivity of vacuum, the relative permittivity of the electrolyte, the Faraday constant, the valance number of ion species i and the concentration of ion species i, respectively.
Ions driven by the potential and transported in nanopore are described by Nernst-Planck equation (Eq. (2)):

|
(2) |
where Di, ui, are diffusivity and electrophoretic mobility, respectively.
The system is assumed to be in steady-state condition, so the flux should satisfy time-independent equation (Eq. (3)):

|
(3) |
Combining these equations through simulation helps us understand the phenomenon of ICR. The research interest focuses on COMSOL software as it provides convenient method to simulate ion transport in nanopores.
COMSOL Multiphysics implements simulation of real physical phenomena by solving the partial differential equations using the finite element method. The "Electrostatics" interface was selected to solve Poisson equation, and "Transport of Diluted Species" interface was chosen to solveNernst-Planckequation.These twophysicsfields are coupled by the common physical quantities in a constructed geometric configuration. In order to ensure the model is correct, it needs to accurately defineboundaryanddomain conditions by using its built-in physical equations, and split the mesh strictly to ensure that the obtained result is convergent. Parameter scanning can be used to compare different pore sizes and thickness, surface charge density, ion concentration and applied voltage. It also provides analytic methods for multi-ion and mult Ⅰ-Ⅴ alence.
In the process of simulation, the current through the nanopore can be calculated by Eq. (4):

|
(4) |
where S, n are the cross-sectional area of the calculation domain and the unit outward normal vector, respectively [69].
The Ⅰ-Ⅴ curve or the profiles of ion concentration and electrical potential are obtained by COMSOL's post-processing function. It is convincing to combine the experimental data with the simulation results and verify the rectification mechanism, which provides an effective explanation for the hypothesis.
For example, Siwy's group investigated ion transport through a PET mesopore with the modification of PLL, which was simulated by COMSOL software with above-mentioned PNP equation and Stokes-Brinkman equation. The influence of the length of the zone filled with PLL (Fig. 4a) and the pore length (Fig. 4b) were changed in the numerical simulation to get the Ⅰ-Ⅴ curves. Meanwhile, the total ionic concentration in the pore could also be obtained under different voltage (Figs. 4c and d).

|
Download:
|
| Fig. 4. Simulated Ⅰ-Ⅴ curves of a single conical pore modified with PLL. (a) Pore length is kept constant at 2 μm, and the length of the region filled with PLL was varied between 100 nm and 600 nm; (b) The region of the PLL layer was 200 nm, and the pore length was varied between 1 μm and 5 μm. (c, d) The polyelectrolyte zone was 200 nm long and placed at the narrow opening of the pore. The tip diameter of the pore was 400 nm. The concentration of reservoir was 10 mmol/L. The region highlighted in blue corresponds to the zone that contains PLL. Copied with permission [65]. Copyright 2019, American Chemical Society. | |
All in all, the phenomenon of ICR, especially the depletion or accumulation of ions in nanopores, has been numerically simulated using commercial simulation software [46, 64, 65, 69-71]. Researchers can easily add and combine equations according to the needs of the real situation due to its simple operative interface and flexible multiphysics coupling. We are optimistic that simulation will developinto aneffectivetoolfor studying theunderlyingmechanism of ion transport in nanopores.
3.2. Other nonlinear ion transport phenomenaOther than ICR, there still were other types of asymmetric Ⅰ-Ⅴ curves phenomenon in nanopores. The hydrophobic interaction in nanopores was one of common reasons [72-76], which was not reviewed in detail. Here, we discussed other causes for the asymmetric ion transport phenomena that presented in the nanopores of graphene, graphene oxide, CNT, and MoS2 (Table 2) [32, 35, 42, 49-52, 54, 55, 60, 63, 64, 72, 77-79].
|
|
Table 2 Summary of the nonlinear ion transport phenomena. |

In 2015, Karnik's group measured Ⅰ-Ⅴ curves in graphene nanopore around 1 nm and revealed that the conductance spanned three orders of magnitude. They not only displayed distinct linear, voltage-activated or rectified current-voltage characteristics but also showed different cation-selectivity profiles [78]. They proposed rectification and voltage-activated conductance were linked to the shape of the underlying potential within the channel, which arose from ionic hydration and electrostatic interactions [80]. They set up a model which could quantitatively describe the conductance range and nonlinear responses, the electrostatic and hydration interactions between a single ion and graphene pore was incorporated into the Nernst–Planck equation in the model. The explanation of the nonlinear Ⅰ-Ⅴ curves combined the experiment and modelling results. In general, the symmetrical charge in the nanopore resulted in mild saturation-type nonlinearity because of the depletion of ions in the nanopore, while moving the charge offcentre along the pore axis induced the asymmetry in the transport that resulted in rectified curves. Finally, electrostatic and hydration interactions could account for the observed complicated Ⅰ-Ⅴ curves quantitatively for realistic nanopore diameters and charges.
For ultrashort single-walled carbon nanotubes (SWCNTs), there were also three typical current-voltage curves and their corresponding conductance values were classified into three groups. The nonlinear Ⅰ-Ⅴ curves was owing to the diameter of nanotubes with less than 1 nm and none of the SWCNTs in this group could pass ssDNA [79]. This may be explained in a simulation study by Peter and Humme, who showed that when ions transported through a nanopore with diameter less than 1 nm, the hydration layers around the ions need to be stripped off due to the spatial constrains, and then the Ⅰ-Ⅴ curves behaved in nonlinear manner [81].
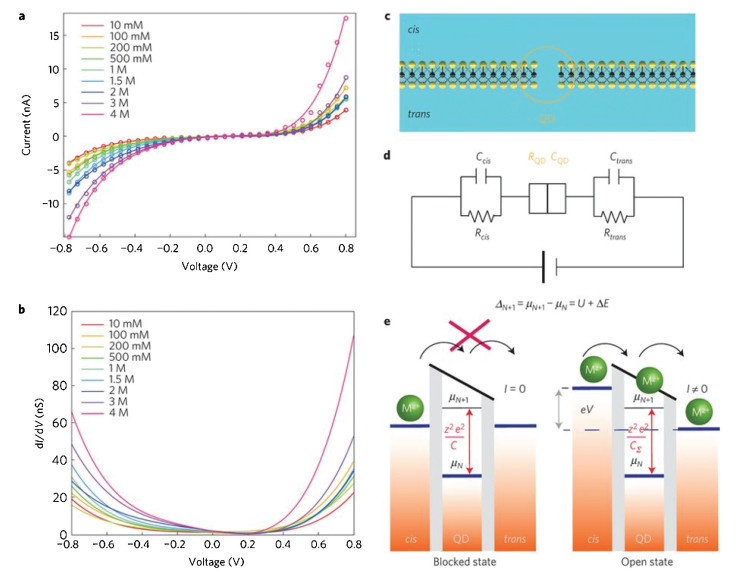
Radenovic's group has been working on nanopores of MoS2 and they could accurately fabricate pores smaller than 1 nm on its surface. In 2016, the idea of ion coulomb blockage in nanopores were proposed owing to the measured nonlinear current-voltage (Figs. 5a and b) [77]. This Ⅰ-Ⅴ curve was similar to the nonlinearity from hydrophobic effects, in which the current was almost entirely suppressed at low voltages but rose abruptly when the voltage exceeded a threshold value. It was proved that was not the result of hydrophobic effects because the Ⅰ-Ⅴ curves were ohmic for the MoS2 nanopores with diameters above 1 nm. It was a new phenomenon of coulomb blockade as it was existing in th conduction of not only electrons but also ions [82]. The coulomb blockade was a well-known electrostatic phenomenon that related to charge discreteness and energy quantization. The experimental support was provided that ionic coulomb blockade effects were not only observable but also could become dominant in subnanometer-wide water-filled nanopores. The nonlinear Ⅰ-Ⅴ curve in MoS2 nanopores resulted from the quantization of charge and occupancy (Figs. 5c–e). On the basis of selective single-ion conduction through subnanometer-sized pores, novel technology as well as drugs targeting biological ion channels could be anticipated.

|
Download:
|
| Fig. 5. Ⅰ-Ⅴ characteristics of a 0.6 nm MoS2 nanopore in KCl aqueous solution. (a) Ⅰ-Ⅴ curves acquired under different ion concentrations. (b) Differential conductance (dI/dV) of a 0.6 nm MoS2 in KCl solutions of different concentrations. (c) Illustration of a single-ion junction in the form of small-diameter nanopores in the two-dimensional material MoS2. (d) Corresponding equivalent circuit for the system shown in Fig. 5c. C, capacitance; R, resistance. (e) Equivalent energy-level diagram for ionic coulomb blockade due to single-ion charging in nanopores. Copied with permission [77]. Copyright 2016, Springer Nature. | |
3.3. Ion selectivity
In the confined nanopores, different ions behaved different ion transport states which provided the possibility for application and mechanism study of ion selectivity, such as seawater desalination, reverse osmosis (RO) membranes for water purification, or researches on ion transport in the channel of biological cell membrane [83].
By far, there are several mechanisms of ion selectivity in nanopore, such as size exclusion for bare ion, dehydration, ion coordination effect and charge repulsion [84]. The simple rule of charge repulsion in the ion selectivity is that a positive charged nanopore the anions preferentially transport while a nanopore with negative walls can transport cations [85, 86].
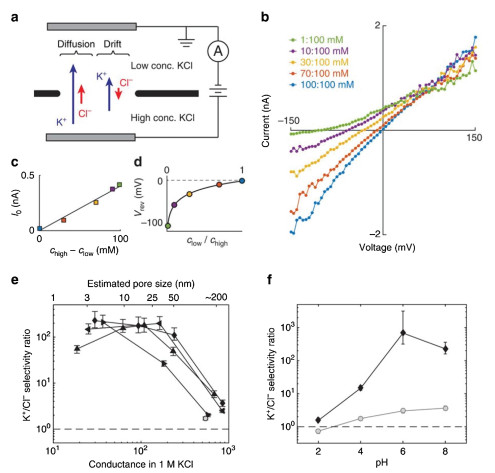
Recently, materials for studying ion selectivity in nanopores mainly included graphene, boron nitride, and modified silicon materials (Table 3) [87-89]. Normally, the pore size requirement of commercial RO membranes with desalination was very high, so that all the pores were nearly on the sub-nanometer level. A few large pores in a membrane could impair salt rejection owing to the contribution of large unselective water fluxes [90-92]. Recently, physicists have predicted graphene nanopores with larger diameters would selectively transport different ions due to the effect of charge in nanopores. In 2015, Golovchenko's group first confirmed this prediction in the experiment that graphene nanopores up to 20 nm in diameter showed K+/Cl- selectivity ratios over 100 (Figs. 6a–d) and monovalent/divalent cation selectivity was up to 5 (Figs. 6e and f) [87]. Normally, the selectivity between anion and cation was identified from reversal potential (Vrev) which was generated from a variety of salt concentration gradients, followed by bringing Vrev into GHK equation to obtain the selectivity [93]. The simulation in COMSOL Multiphysics software also proved the selectivity was significantly influenced by the charge in nanopore. Without the surface charge on the graphene membrane, the Vrev and selectivity dropped rapidly for pores larger than 1 nm. The selectivity among different cations (K+, Na+, Cs+, Li+, Ca2+, Mg2++) were measured to draw Ⅰ-Ⅴ curves in different cation-chloride solutions without concentration gradient. The conductance of salt solutions differed from each other, so they normalized the conductance of each cation owing to the significantly different electrophoretic mobilities. The selectivity of inter-cation was calculated by the division of ion standard conductance. Thus the trend of cations selectivity in graphene nanopores (K+>Na+>Cs+>Li+>>Ca2+>Mg2+) was presented.
|
|
Table 3 Experiments of ion selectivity in nanopores. |


|
Download:
|
| Fig. 6. K+/Cl- selectivity. (a) Schematic of experimental setup. (b) Measured Ⅰ-Ⅴ curves for several concentration ratios. Each colored curve indicated a different concentration ratio as indicated in the legend. (c) Zero-bias current indicated that K+ ions pass more easily than Cl-. (d) Reversal voltage as a function of concentration ratio, along with fit to the GHK voltage equation. (e) K+/Cl- selectivity ratio as a function of pore size for several nanopores; different markers indicated different samples. (f) K+/Cl- selectivity ratio as a function of pH for a 3 nm pore (black diamonds), showing that the selectivity increases with pH. Copied with permission [87]. Copyright 2015, Springer Nature. | |
Then in 2017, Keyser's group also verified the critical role of charge in ion selectivity through graphene and hexagonal boron nitride (h-BN) 2D membranes. Graphene and h-BN membranes showed similar characteristics that negative surface charge gave rise to cation selectivity [88]. They also repeated experiments with NaCl, LiCl, and MgCl2 to confirm if the type of ions affected the selectivity. It was beyond the expectation to find all three salts showed significant cation selectivity over anion. The selectivity of Li+ over Cl- was the strongest, whereas the selectivity of Mg2+ was much lower. Thus, they excluded the ion radii as the primary cause of selectivity and speculated the dominating cause was the charge effect. The Mg2+ was a divalent ion and it would screen the charge of the pore more effectively, leading to a shorter Debye screening length, which reduced the charge selective effect as observed.
Siwy's group found a biomimetic potassium-selective nanopores through modifying the silicon nitride films with 40-aminobenzo-18-crown-6 ether or single-stranded DNA (ssDNA) molecules at one of the pore entrances [89]. Then she found the decorated nanopores preferentially conducted potassium ions over sodium ions and the selectivity could be up to 80. Four different modifications were compared, asymmetric modification of nanopore entrances with the crown ether and ssDNA, symmetric attachment of 40-aminobenzo-18-crown-6 ether, modified with crown ether from one side, and modified with ssDNA from one side. They believed ionic selectivity stemmed from facilitated transport of potassium ions in the region of crown ether, as crown ether was known to selectively bind and release potassium ions quickly. ssDNA did not contribute to the selectivity of the pore, but it played the role of a cation filter owing to its high negative surface charges as it could increase the cation concentrations at the pore entrance, thus causing the process of binding/releasing of ions from the crown ether to be the limiting step in the ion transport process [94, 95]. The nature of this nanopore in ion transport was similar to the potassium channels in vivo, helping researchers continue to simulate and study intracellular ion channels.
Many scientists found that the structure of nanotubes in the membrane have excellent desalination effect in the simulation results [90, 96-98], such as carbon nanotubes, boron nitride nanotubes, or the modified nanotubes. Some physicists even predicted the salt rejection rate was expected to reach 100% [85, 99, 100]. As the freshwater resources continued to decrease and the population increased rapidly, seawater desalination has great fundamental research significance and practical value.
4. Analysis of small moleculesSingle solid-state nanopore technology has been successfully applied to the biological small molecular detection recently. Compared with the traditional ways, single solid nanopore could realize analyzing biological small molecules at the single cell level. The nanopipette was first applied in detecting biological small molecules owing to the high selectivity and sensitivity, which could be used to further the study of pathological mechanism of organism [101].
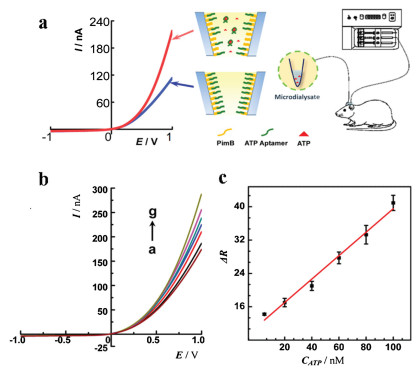
In 2017, Mao obtained brain ATP signals through ATP sensors which were nanopipettes modified by PimB and ATP aptamer sequentially [102]. The principle was that the combination of ATP and ATP aptamer partially destroyed the electrostatic interaction between ATP aptamer and PimB (Fig. 7a), which resulted in the changes of ATP sensor surface charge and the larger rectification ratio [103]. The ATP could be quantitatively measured by the linear relationship between the rectification ratio and the ATP concentration (Figs. 7b and c). This sensor could not be interfered by other biomolecules and could be used as a signal transduction output for complex brain ATP assays [104]. Furthermore, the technology opened up a new avenue to micrometer-scale pipettes ionic current rectification (MICR)-based bio-sensors and provided a new way for in vivo analysis.

|
Download:
|
| Fig. 7. (a) Schematic illustration of aptamer/PimB-modified micropipettes for the ATP quantitation. (b) Typical Ⅰ-Ⅴ curves obtained at the aptamer/PimB-modified micropipettes treated with different ATP concentrations: 0, 5, 20, 40, 60, 80, and 100 nmol/L. Electrolyte: 10 mmol/L KCl solution. (c) Plot of the change of rectification ratio (△R = R–R0) against the ATP concentration. Error bars show the standard deviation of the measurements taken from three independent experiments. Copied with permission [102]. Copyright 2017, American Chemical Society. | |
Combined with aptamers or enzymes, the advantages of single solid-state nanopore for the detection of small biomolecules with high specificity have gradually shown up. Pourmand's group generated glucose oxidase (GOx)-functionalized nanopipettes as glucose nanosensors to measure intracellular free glucose at the single cell level for the first time [105, 106]. The GOx catalyzes β-D-glucose into D-gluconic, this leaded to the pH of the medium at the nanopipette tip dropped and the impedance changed significantly [105, 107]. Thus, the concentrations of intracellular glucose were analyzed by a direct relationship between the impedance at the tip and glucose in the solution. This detection technique pioneered the measurement of intracellular free glucose at the single cell level not only for cancer diagnosis and pathological studies but also for other studies of metabolic heterogeneity in cell populations [108]. Reactive oxygen species (ROS) are short-lived, diverse, and have complex dynamics [109]. Monitoring the amount of ROS was a big challenge that the traditional detection methods were difficult to accurately detect ROS, especially at the single cell level [106, 110]. Last year, Pourmand's group also fabricated a functionalized nanopipettes sensor by a series of chemical modifications on the inner surface of the nanopipettes. When O2*- approached the surface of the sensor, they underwent a redox reaction and then it gave rise to changes in current rectification. The one-to-one correspondence between rectification degree and the O2*- concentration not only obtained its concentration but also monitored the concentration changes at the cellular level dynamically. This technique could be further applied to the study of psychological pathology caused by ROS.
5. OutlookIn summary, the rapid development of solid-state nanopores not only expands human cognition of the confined nanometer scale but also has specific applicable benefits in both energy and biomimetic systems. It still exists shortcomings to be solved, such as the low signal-to-noise ratio and cumbersome fabrication progress. At the same time, it was not easy to integrate with other single-molecule detection system, resulting in the limited applications. However, solid-state nanopore technique still has broad application prospects and great potential. Many researchers are looking forward to applying nanopore technology in the fields of DNA sequencing, molecular translocation analysis, and protein/peptide detections etc. This field needs more interdisciplinary researchers in the future to expand our understanding of nanoscale and explore the mysterious biological ion conduction system.
AcknowledgmentsThis work is financially supported by the National Natural Science Foundation of China (No. 21505076), the Young Elite Scholar Support (YESS) Program from China Association for Science and Technology (No. YESS20150009), the Program of Jiangsu Specially-Appointed Professor, the Natural Science Foundation of Jiangsu Province of China (No. BK20150967), the Innovation Team Program of Jiangsu Province of China, and the Priority Academic Program Development of Jiangsu Higher Education Institutions.
| [1] |
M. Akeson, D. Branton, J.J. Kasianowicz, E. Brandin, D.W. Deamer, Biophys. J. 77 (1999) 3227-3233. DOI:10.1016/S0006-3495(99)77153-5 |
| [2] |
C. Dekker, Nat. Nanotechnol. 2 (2007) 209-215. DOI:10.1038/nnano.2007.27 |
| [3] |
J.J. Kasianowicz, E. Brandin, D. Branton, D.W. Deamer, Proc. Natl. Acad. Sci. U. S. A. 93 (1996) 13770-13773. DOI:10.1073/pnas.93.24.13770 |
| [4] |
M. Faller, M. Niederweis, G.E. Schulz, Science 303 (2004) 1189-1192. DOI:10.1126/science.1094114 |
| [5] |
S. Huang, M. Romero-Ruiz, O.K. Castell, H. Bayley, M.I. Wallace, Nat. Nanotechnol. 10 (2015) 986-991. DOI:10.1038/nnano.2015.189 |
| [6] |
Z. Long, S. Zhan, P. Gao, et al., Anal. Chem. 90 (2018) 577-588. DOI:10.1021/acs.analchem.7b04737 |
| [7] |
I. Vlassiouk, P.Y. Apel, S.N. Dmitriev, K. Healy, Z.S. Siwy, Proc. Natl. Acad. Sci. U. S. A. 106 (2009) 21039-21044. DOI:10.1073/pnas.0911450106 |
| [8] |
L.X. Zhang, Y.B. Zheng, S.L. Cai, X.H. Cao, Y.Q. Li, Chin. Chem. Lett. 26 (2015) 43-46. DOI:10.1016/j.cclet.2014.08.001 |
| [9] |
G.X. Li, X.Q. Lin, Chin. Chem. Lett. 21 (2010) 1115-1118. DOI:10.1016/j.cclet.2010.04.026 |
| [10] |
K. Briggs, H. Kwok, V. Tabard-Cossa, Small 10 (2014) 2077-2086. DOI:10.1002/smll.201303602 |
| [11] |
S. Howorka, Z. Siwy, Chem. Soc. Rev. 38 (2009) 2360-2384. DOI:10.1039/b813796j |
| [12] |
D.G. Haywood, A. Saha-Shah, L.A. Baker, S.C. Jacobson, Anal. Chem. 87 (2015) 172-187. DOI:10.1021/ac504180h |
| [13] |
K. Fu, P.W. Bohn, ACS Cent. Sci. 4 (2018) 20-29. DOI:10.1021/acscentsci.7b00576 |
| [14] |
L. Cao, Q. Wen, Y. Feng, et al., Adv. Funct. Mater. 28 (2018) 1804189. DOI:10.1002/adfm.201804189 |
| [15] |
A. Siria, P. Poncharal, A.L. Biance, et al., Nature 494 (2013) 455-458. DOI:10.1038/nature11876 |
| [16] |
T. Deng, M. Li, Y. Wang, Z. Liu, Sci. Bull. 60 (2015) 304-319. DOI:10.1007/s11434-014-0705-8 |
| [17] |
J. Li, D. Stein, C. McMullan, et al., Nature 412 (2001) 166-169. DOI:10.1038/35084037 |
| [18] |
A. Morin, D. Lucot, A. Ouerghi, et al., Microelectron. Eng. 97 (2012) 311-316. DOI:10.1016/j.mee.2012.02.029 |
| [19] |
Y. Deng, Q. Huang, Y. Zhao, et al., Nanotechnology 28 (2016) 045302. DOI:10.1088/1361-6528/28/4/045302 |
| [20] |
A.T. Kuan, J.A. Golovchenko, Appl. Phys. Lett. 100 (2012) 213104. DOI:10.1063/1.4719679 |
| [21] |
F. Sawafta, B. Clancy, A.T. Carlsen, M. Huber, A.R. Hall, Nanoscale 6 (2014) 6991-6996. DOI:10.1039/C4NR00305E |
| [22] |
A.J. Storm, J.H. Chen, X.S. Ling, H.W. Zandbergen, C. Dekker, Nat. Mater. 2 (2003) 537-540. DOI:10.1038/nmat941 |
| [23] |
M. Yemini, B. Hadad, Y. Liebes, A. Goldner, N. Ashkenasy, Nanotechnology 20 (2009) 245302. DOI:10.1088/0957-4484/20/24/245302 |
| [24] |
Z. Tang, D. Zhang, W. Cui, et al., Nanomater. Nanotechnol. 6 (2016) 35. DOI:10.5772/64015 |
| [25] |
P. Apel, Radiat. Meas. 34 (2001) 559-566. DOI:10.1016/S1350-4487(01)00228-1 |
| [26] |
Z. Siwy, P. Apel, D. Dobrev, et al., Nucl. Instrum. Methods Phys. Res. B 208 (2003) 143-148. DOI:10.1016/S0168-583X(03)00884-X |
| [27] |
H. Kwok, K. Briggs, V. Tabard-Cossa, PLoS One 9 (2014) e92880.
|
| [28] |
K. Briggs, M. Charron, H. Kwok, et al., Nanotechnology 26 (2015) 084004. DOI:10.1088/0957-4484/26/8/084004 |
| [29] |
A.T. Kuan, B. Lu, P. Xie, T. Szalay, J.A. Golovchenko, Appl. Phys. Lett. 106 (2015) 203109. DOI:10.1063/1.4921620 |
| [30] |
J. Feng, K. Liu, M. Graf, et al., Nano Lett. 15 (2015) 3431-3438. DOI:10.1021/acs.nanolett.5b00768 |
| [31] |
P. Elsamadisi, Y. Wang, J. Velmurugan, M.V. Mirkin, Anal. Chem. 83 (2011) 671-673. DOI:10.1021/ac102704z |
| [32] |
Z. Siwy, E. Heins, C.C. Harrell, P. Kohli, C.R. Martin, J. Am. Chem. Soc. 126 (2004) 10850-10851. DOI:10.1021/ja047675c |
| [33] |
Y. He, D. Gillespie, D. Boda, et al., J. Am. Chem. Soc. 131 (2009) 5194-5202. DOI:10.1021/ja808717u |
| [34] |
Z. Siwy, A. Fulinski, Phys. Rev. Lett. 89 (2002) 198103. DOI:10.1103/PhysRevLett.89.198103 |
| [35] |
S. Liu, Y. Dong, W. Zhao, et al., Anal. Chem. 84 (2012) 5565-5573. DOI:10.1021/ac3004852 |
| [36] |
H.D. Tong, H.V. Jansen, V.J. Gadgil, et al., Nano Lett. 4 (2004) 283-287. DOI:10.1021/nl0350175 |
| [37] |
I. Yanagi, T. Ishida, K. Fujisaki, K. Takeda, Sci. Rep. 5 (2015) 14656. DOI:10.1038/srep14656 |
| [38] |
I. Yanagi, K. Fujisaki, H. Hamamura, K. Takeda, J. Appl. Phys. 121 (2017) 045301. DOI:10.1063/1.4974286 |
| [39] |
Y. Wang, C. Ying, W. Zhou, et al., Sci. Rep. 8 (2018) 1234. DOI:10.1038/s41598-018-19450-7 |
| [40] |
X. Hou, W. Guo, L. Jiang, Chem. Soc. Rev. 40 (2011) 2385-2401. DOI:10.1039/c0cs00053a |
| [41] |
D.A. Doyle, J.M. Cabral, R.A. Pfuetzner, et al., Science 280 (1998) 69-77. DOI:10.1126/science.280.5360.69 |
| [42] |
C. Wei, A.J. Bard, S.W. Feldberg, Anal. Chem. 69 (1997) 4627-4633. DOI:10.1021/ac970551g |
| [43] |
L.J. Cheng, L.J. Guo, Chem. Soc. Rev. 39 (2010) 923-938. DOI:10.1039/B822554K |
| [44] |
M. Ali, B. Yameen, J. Cervera, et al., J. Am. Chem. Soc. 132 (2010) 8338-8348. DOI:10.1021/ja101014y |
| [45] |
C. Ho, R. Qiao, J.B. Heng, et al., Proc. Natl. Acad. Sci. U. S. A. 102 (2005) 10445-10450. DOI:10.1073/pnas.0500796102 |
| [46] |
N. Sa, W.J. Lan, W. Shi, L.A. Baker, ACS Nano 7 (2013) 11272-11282. DOI:10.1021/nn4050485 |
| [47] |
R. Karnik, C. Duan, K. Castelino, H. Daiguji, A. Majumdar, Nano Lett. 7 (2007) 547-551. DOI:10.1021/nl062806o |
| [48] |
C.C. Harrell, P. Kohli, Z. Siwy, C.R. Martin, J.Am.Chem.Soc. 126 (2004) 15646-15647. DOI:10.1021/ja044948v |
| [49] |
E.C. Yusko, R. An, M. Mayer, ACS Nano 4 (2010) 477-487. DOI:10.1021/nn9013438 |
| [50] |
X. He, K. Zhang, T. Li, et al., J. Am. Chem. Soc. 139 (2017) 1396-1399. DOI:10.1021/jacs.6b11696 |
| [51] |
S. Umehara, N. Pourmand, C.D. Webb, et al., Nano Lett. 6 (2006) 2486-2492. DOI:10.1021/nl061681k |
| [52] |
X. He, K. Zhang, Y. Liu, et al., Angew. Chem. Int. Ed. 57 (2018) 4590-4593. DOI:10.1002/anie.201800335 |
| [53] |
P.A. Gurnev, T.C. Roark, H.I. Petrache, A.J. Sodt, S.M. Bezrukov, Angew. Chem. Int. Ed. 56 (2017) 3506-3509. DOI:10.1002/anie.201611335 |
| [54] |
Z.Y. Jiang, H.L. Liu, S.A. Ahmed, et al., Angew. Chem.Int.Ed. 129 (2017) 4845-4849. DOI:10.1002/ange.201701279 |
| [55] |
R. Banerjee, A. Phan, B. Wang, et al., Science 319 (2008) 939-943. DOI:10.1126/science.1152516 |
| [56] |
E.R. Cruz-Chu, T. Ritz, Z.S. Siwy, K. Schulten, Faraday Discuss. 143 (2009) 47-93. DOI:10.1039/b906279n |
| [57] |
Z.S. Siwy, M.R. Powell, A. Petrov, C. Trautmann, R.S. Eisenberg, et al., Nano Lett. 6 (2006) 1729-1734. DOI:10.1021/nl061114x |
| [58] |
Z. Siwy, L. Trofin, P. Kohli, et al., J. Am. Chem. Soc. 127 (2005) 5000-5001. DOI:10.1021/ja043910f |
| [59] |
Z.S. Siwy, Adv. Funct. Mater. 16 (2006) 735-746. DOI:10.1002/adfm.200500471 |
| [60] |
B. Yameen, M. Ali, R. Neumann, et al., J. Am. Chem. Soc. 131 (2009) 2070-2071. DOI:10.1021/ja8086104 |
| [61] |
X. Hou, F. Yang, L. Li, et al., J. Am. Chem. Soc. 132 (2010) 11736-11742. DOI:10.1021/ja1045082 |
| [62] |
W. Guo, H. Xia, F. Xia, et al., ChemPhysChem 11 (2010) 859-864. DOI:10.1002/cphc.200900989 |
| [63] |
S.F. Buchsbaum, G. Nguyen, S. Howorka, Z.S. Siwy, J. Am. Chem. Soc. 136 (2014) 9902-9905. DOI:10.1021/ja505302q |
| [64] |
C.Y. Lin, L.H. Yeh, Z.S. Siwy, J. Phys. Chem. Lett. 9 (2018) 393-398. DOI:10.1021/acs.jpclett.7b03099 |
| [65] |
C.Y. Lin, C. Combs, Y.S. Su, L.H. Yeh, Z.S. Siwy, J. Am. Chem. Soc. 141 (2019) 3691-3698. DOI:10.1021/jacs.8b13497 |
| [66] |
S.J. Kim, Y.C. Wang, J.H. Lee, H. Jang, J. Han, Phys. Rev. Lett. 99 (2007) 044501. DOI:10.1103/PhysRevLett.99.044501 |
| [67] |
E.T. Acar, P. Hinkle, Z.S. Siwy, J. Phys. Chem. C 122 (2018) 3648-3654. DOI:10.1021/acs.jpcc.7b12265 |
| [68] |
J. Wang, M. Zhang, J. Zhai, L. Jiang, Phys. Chem. Chem. Phys. 16 (2014) 23-32. DOI:10.1039/C3CP51712H |
| [69] |
J.P. Hsu, S.T. Yang, C.Y. Lin, S. Tseng, J. Phys. Chem. C 121 (2017) 4576-4582. DOI:10.1021/acs.jpcc.6b09907 |
| [70] |
Y. Qiu, Z.S. Siwy, M. Wanunu, Anal. Chem. 91 (2019) 996-1004. DOI:10.1021/acs.analchem.8b04225 |
| [71] |
L.H. Yeh, M. Zhang, S. Qian, J.P. Hsu, S. Tseng, J. Phys. Chem. C 116 (2012) 8672-8677. DOI:10.1021/jp301957j |
| [72] |
S.N. Smirnov, I.V. Vlassiouk, N.V. Lavrik, ACS Nano 5 (2011) 7453-7461. DOI:10.1021/nn202392d |
| [73] |
M.R. Powell, L. Cleary, M. Davenport, K.J. Shea, Z.S. Siwy, Nat. Nanotechnol. 6 (2011) 798-802. DOI:10.1038/nnano.2011.189 |
| [74] |
L. Innes, D. Gutierrez, W. Mann, S.F. Buchsbaum, Z.S. Siwy, Analyst 140 (2015) 4804-4812. DOI:10.1039/C4AN02244K |
| [75] |
I. Vlassiouk, C.D. Park, S.A. Vail, D. Gust, S. Smirnov, Nano Lett. 6 (2006) 1013-1017. DOI:10.1021/nl060313d |
| [76] |
J. Trick, P. Aryal, S. Tucker, M. Sansom, Biochem. Soc. Trans. 43 (2015) 146-150. DOI:10.1042/BST20140256 |
| [77] |
J. Feng, K. Liu, M. Graf, et al., Nat. Mater. 15 (2016) 850-855. DOI:10.1038/nmat4607 |
| [78] |
T. Jain, B.C. Rasera, R.J.S. Guerrero, et al., Nat. Nanotechnol. 10 (2015) 1053-1057. DOI:10.1038/nnano.2015.222 |
| [79] |
L. Liu, C. Yang, K. Zhao, J. Li, H.C. Wu, Nat. Commun. 4 (2013) 2989. DOI:10.1038/ncomms3989 |
| [80] |
I.D. Kosinska, J. Chem. Phys. 124 (2006) 244707. DOI:10.1063/1.2212394 |
| [81] |
C. Peter, G. Hummer, Biophys. J. 89 (2005) 2222-2234. DOI:10.1529/biophysj.105.065946 |
| [82] |
K. Matt, M. Ventra, J. Phys. Condens. Matter 25 (2013) 065101. DOI:10.1088/0953-8984/25/6/065101 |
| [83] |
M. Heiranian, A.B. Farimani, N.R. Aluru, Nat. Commun. 6 (2015) 8616. DOI:10.1038/ncomms9616 |
| [84] |
S. Sahu, M. Di Ventra, M. Zwolak, Nano Lett. 17 (2017) 4719-4724. DOI:10.1021/acs.nanolett.7b01399 |
| [85] |
I. Vlassiouk, S. Smirnov, Z. Siwy, Nano Lett. 8 (2008) 1978-1985. DOI:10.1021/nl800949k |
| [86] |
L.H. Yeh, M. Zhang, S. Qian, Anal. Chem. 85 (2013) 7527-7534. DOI:10.1021/ac401536g |
| [87] |
R.C. Rollings, A.T. Kuan, J.A. Golovchenko, Nat. Commun. 7 (2016) 11408. DOI:10.1038/ncomms11408 |
| [88] |
M.I. Walker, K. Ubych, V. Saraswat, et al., ACS Nano 11 (2017) 1340-1346. DOI:10.1021/acsnano.6b06034 |
| [89] |
E.T. Acar, S.F. Buchsbaum, C. Combs, F. Fornasiero, Z.S. Siwy, Sci. Adv. 5 (2019) eaav2568. DOI:10.1126/sciadv.aav2568 |
| [90] |
D. Cohen-Tanugi, J.C. Grossman, Desalination 366 (2015) 59-70. DOI:10.1016/j.desal.2014.12.046 |
| [91] |
S.C. O'Hern, M.S.H. Boutilier, J.C. Idrobo, et al., NanoLett. 14 (2014) 1234-1241. DOI:10.1021/nl404118f |
| [92] |
S.P. Surwade, S.N. Smirnov, I.V. Vlassiouk, et al., Nat. Nanotechnol. 10 (2015) 459-464. DOI:10.1038/nnano.2015.37 |
| [93] |
B. Hille, Ionic Channels of Excitable Membranes, 2nd ed., Cell Press, Massachusetts, 1992.
|
| [94] |
G. Pérez-Mitta, A.G. Albesa, W. Knoll, et al., Nanoscale 7 (2015) 15594-15598. DOI:10.1039/C5NR04645A |
| [95] |
Z. Sun, M. Barboiu, Y.M. Legrand, E. Petit, A. Rotaru, Angew. Chem. Int. Ed. 127 (2015) 14681-14685. DOI:10.1002/ange.201506430 |
| [96] |
X. Wang, G. Shi, S. Liang, et al., Phys. Rev. Lett. 121 (2018) 226102. DOI:10.1103/PhysRevLett.121.226102 |
| [97] |
Y. Kang, Z. Zhang, H. Shi, et al., Nanoscale 6 (2014) 10666-10672. DOI:10.1039/C4NR01383B |
| [98] |
Z. He, J. Zhou, X. Lu, B. Corry, ACS Nano 7 (2013) 10148-10157. DOI:10.1021/nn4043628 |
| [99] |
X. Gong, J. Li, K. Xu, J. Wang, H. Yang, J. Am. Chem. Soc. 132 (2010) 1873-1877. DOI:10.1021/ja905753p |
| [100] |
C.Y. Won, N.R. Aluru, J. Am. Chem. Soc. 129 (2007) 2748-2749. DOI:10.1021/ja0687318 |
| [101] |
P. Actis, A.C. Mak, N. Pourmand, Bioanal. Rev. 1 (2010) 177-185. DOI:10.1007/s12566-010-0013-y |
| [102] |
K. Zhang, X. He, Y. Liu, et al., Anal. Chem. 89 (2017) 6794-6799. DOI:10.1021/acs.analchem.7b01218 |
| [103] |
B.F. Liu, M. Ozaki, H. Hisamoto, et al., Anal. Chem. 77 (2005) 573-578. DOI:10.1021/ac0490447 |
| [104] |
P. Yu, X. He, L. Zhang, L. Mao, Anal. Chem. 87 (2015) 1373-1380. DOI:10.1021/ac504249k |
| [105] |
R.A.S. Nascimento, R.E. Özel, W.H. Mak, et al., Nano Lett. 16 (2016) 1194-1200. DOI:10.1021/acs.nanolett.5b04495 |
| [106] |
R.E. Ozel, G. Bulbul, J. Perez, N. Pourmand, ACS Sens. 3 (2018) 1316-1321. DOI:10.1021/acssensors.8b00185 |
| [107] |
R.E. Özel, A. Lohith, W.H. Mak, N. Pourmand, RSC Adv. 5 (2015) 52436-52443. DOI:10.1039/C5RA06721A |
| [108] |
G. Chaves, R.E. Özel, N.V. Rao, et al., Heliyon 3 (2017) e00381. DOI:10.1016/j.heliyon.2017.e00381 |
| [109] |
T. Finkel, N.J. Holbrook, Nature 408 (2000) 239-247. DOI:10.1038/35041687 |
| [110] |
C.C. Winterbourn, Biochim. Biophys. Acta 1840 (2014) 730-738. DOI:10.1016/j.bbagen.2013.05.004 |