 2019, Vol. 30


Electrochemiluminescence or electrogenerated chemiluminescence (ECL) refers to luminescence that is produced by exergonic electron transfer reactions triggered by externally electrochemical excitation [1]. There are two dominant pathways through which ECL can be produced, namely the annihilation and coreactant pathways. According to the luminophores, ECL systems can be generally classified into three types including organic systems, inorganic systems and nanomaterials [2].
Polycyclic aromatic hydrocarbons (PAHs) such as rubrene and 9, 10-diphenylanthracene (DPA) are the typical organic ECL luminophores. The ECL generation from PAHs involves highly reactive intermediates and generally requires aprotic solvents with large potential windows, which is traditionally generated via annihilation approach. The reaction pathways involve homogeneous chemical reactions between electrogenerated radical cations and anions, both produced in the vicinity of the electrode surface by alternately pulsing of the potential, or at microelectrode arrays. Taking DPA as an example, the general mechanism could be depicted as follows (Eqs. 1–4):

|
(1) |

|
(2) |

|
(3) |

|
(4) |
The luminophore DPA is electrochemically reduced and oxidized at the cathodic and anodic potentials, respectively (Eqs. 1 and 2). The electrogenerated radical cation (DPA+•) and anion (DPA-•) are annihilated in the vicinity of electrode surface to form the excited states species (DPA*) (Eq. 3) that emits light (Eq. 4). Due to the high fluorescence quantum yields and stable radical cations and anions in aprotic media, ECL generation from PAHs has been studied in details, particularly in the investigation of ECL generation mechanisms. However, the poor aqueous solubility greatly restricts its applications in biochemical analysis.
Inorganic systems mainly involve organometallic complexes. Among them, the finding of tris(2, 2'-bipyridyl)ruthenium(Ⅱ) (Ru(bpy)32+) and its derivatives can be recognized as a milestone, which are easily soluble in aqueous solution with high emission efficiency, have stable intensity and could be electrochemical regenerated during ECL generation. Therefore, they are the most widely used complexes in the commercial instruments for clinical diagnosis. In the 1980s, Bard and coworkers presented a new approach for generating ECL for the first time, namely the coreactant pathway [3]. Unlike the aforementioned annihilation mode, in this case the excited state is formed through the reactions between two different precursors, a luminophore and a coreactant such as oxalate (C2O42-) and tri-n-propylamine (TPrA). The introduction of coreactant into the ECL systems can greatly enhance the luminescence generated by sweeping the potential in one direction, even in the presence of oxygen. It indeed opens the way for practical applications of ECL in aqueous solutions. Moreover, various amine-containing species could function as coreactants of Ru(bpy)32+-based ECL systems, making it a useful tool in the detection of important amine-containing molecules, especially the bio-related ones. ECL mechanisms of the coreactant pathway are more complicated than the annihilation one. There are at least four possible mechanisms proposed so far for Ru(bpy)32+/TPrA system. Detailed descriptions of ECL mechanisms have been previously reviewed elsewhere [1, 2, 4-6]. A so-called low oxidation potential ECL (LOP ECL) mechanism involved in Ru(bpy)32+/TPrA was proposed by Bard et al. and verified through combining scanning electrochemical microscopy (SECM) with ECL technique [7]. It could be briefly described as follows (Eqs. 5–9):

|
(5) |
|
(6) |

|
(7) |

|
(8) |

|
(9) |
LOP ECL is commonly considered meaningful to ECL immunoassay based on microbeads and has aroused much attention. Using 3D ECL imaging technique, Sojic et al. found LOP ECL based on Ru(bpy)32+-microbeads was highly dependent on the diffusion distance and stability of coreactant radicals [8]. The satisfying imaging results further proved and revealed the mechanism of LOP ECL and had important reference sense for the design of the ECL immunoassay, indicating ECL imaging could be a promising way to get insight into reaction mechanism and kinetics.
Recently, ECL luminophores based on iridium(Ⅲ) complexes which could emit ECL in short wavelength (such as green- [9] and blue-emitting [10] ECL) has aroused much attention. They could be ideal luminophores to be applied in multicolor ECL. Commonly, distinguishable multicolor ECL was realized by adjusting applied potential or ECL emission wavelength. Combining color charged coupled device (CCD), Francis et al. realized color changing (from red to green with tuning applied potential) in ECL images based on a binary mixture of Ru-complex and Ir-complex [11]. In a mixture of two Ir-based ECL emitters, an attractive "switch on/off" effect caused by Ir(ppy)3 occurred in multicolor ECL imaging [12]. With more and more colorful ECL molecules showing up, ECL images converted among three colors (red, green and blue) were successfully exhibited via a similar way [13]. Recently, the Su group developed the ECL-based multiplex immunoassays based on potential-resolved abilities of multicolor ECL system, which greatly expanded the applications of multicolor ECL [14].
The ECL generation by nanomaterials was first reported by Ding and Bard et al. in 2002 with silicon quantum dots (Si QDs) in both annihilation and coreactant modes [15]. Hereafter, a large number of nanomaterials including CdSe [16], CdTe [17], and PbS QDs [18], have proved to be capable of producing ECL. The ECL mechanism of QDs follows the general annihilation and coreactant ECL reaction pathways. Taking peroxydisulfate (S2O82-) as a coreactant, the ECL generation from CdSe/S2O82- system could be simply described as follows (Eqs. 10–13):

|
(10) |
|
(11) |

|
(12) |
|
(13) |
In a common sense, ECL generation from QDs presents a considerable red-shift of maximum wavelength compared with their photoluminescence (PL), suggesting that the emitting states are different [4]. It is believed that PL spectrum mainly reflects the interior of QDs and provides information about the electronic transition (band gap) of materials, while electrochemistry and ECL investigations mainly probe the surface states of QDs, because ECL emission generally is not sensitive to QDs size. In other words, QDs-based ECL does not exhibit the size-dependent emissions. A challenging task is to achieve ECL generation from the intrinsic states of QDs. Passivating the surface traps of QDs via appropriate functional capping ligands and/or inorganic shell layers might be an efficient strategy to achieve this goal. A pioneering work reported by Bard et al. verifies this hypothesis. They studied the ECL emission from CdSe/ZnSe core/shell QDs (in this case the core CdSe were well-passivated with a shell of ZnSe), which maintained the ECL emission wavelength same as PL [19]. Apart from semiconductor QDs, many nanomaterials such as carbon-based nanoparticles and metal clusters have also been investigated intensively for ECL generation [2].
Since the first detailed ECL investigations described by Hercules and Bard et al. in the early 1960s, ECL has now become a versatile and powerful analytical technique widely used in different fields, ranging from fundamental research to commercial clinical and biochemical analysis. Compared with other optical methods (such as fluorescence (FL)), the most outstanding feature of ECL is that no photo-excitation is needed, thus it is able to avoid background from scattered light or sample autofluorescence, which could significantly improve the signal to noise ratio (SNR) and reduce the limit of detection (LOD). Taking detection of heavy metal ions as an example, Yan et al. developed a signal-off ECL sensor towards Pb2+ based on DNA and CdS QDs, and the LOD is as low as 0.96 pmol/L with the wide detection range from 5.0 pmol/L to 4.0 μmol/L was realized [20], compared with the LOD of 20 nmol/L achieved by the FL sensor [21].
As a transduction or reporting signal used in bioassays, ECL offers remarkable advantages including high sensitivity, extremely wide dynamic range, good temporal and spatial control and so on, thanks to the close location of electrochemical and light emission reactions in the diffusion layer of electrode surface [22]. Additionally, comparing with classical enzyme linked immunosorbent assay (ELISA), ECL could be easily triggered by an electrochemical signal and hardly disturbed by external factors like temperature, which makes ECL a promising tool in immunoassay. Recently, the accurate detection towards prostate specific antigen (PSA) with a low LOD (0.3 pg/mL) was reported based on a novel ECL immunosensor, which further supported the potential of ECL immunoassay [23]. It is popularly accepted that the electrode materials play an essential role in ECL responses. Therefore, it brings about the possibility to enhance ECL intensities by the modification of electrode surface especially with nanomaterials. More researchers have endeavored their efforts on fabricating more sensitive ECL sensing interfaces with Pt, Au nanoparticles [24, 25] and SiO2 mesoporous films [26, 27], promoting the SNR of ECL-based chemo-/bio-sensors.
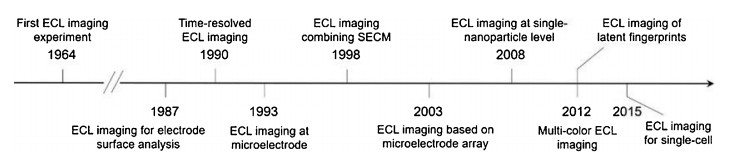
As an analytical technique, the readout of ECL reporting signals including intensity, spectrum and image can be achieved by photodiode (PD), photomultiplier tube (PMT), and CCD. The first ECL imaging experiment was conducted by Hercules in 1964 with rubrene as the luminophore [28]. In 1980s, Engstrom et al. captured the ECL image of luminol on the glassy carbon electrode and further analyzed the amount of the active sites and the distribution of the active region on the electrode surface according to the ECL images [29]. Moreover, the "edge effect" exhibited in the ECL images was investigated [30], which could be regarded as the first applications of ECL imaging in analysis. After about 50-year research, ECL imaging has been widely used and Fig. 1 [11, 28-37] illustrates a time line of various events in the development of ECL imaging.

|
Download:
|
| Fig. 1. Time line of ECL imaging: 1964, first ECL imaging experiment [28]; 1987, ECL imaging for electrode surface analysis [29, 30]; 1990, time-resolved ECL imaging [31]; 1993, ECL imaging at microelectrode [32]; 1998, ECL imaging combining SECM [33]; 2003, ECL imaging based on microelectrode array [34]; 2008, ECL imaging at singlenanoparticle level [35]; 2012, multi-color ECL imaging [11] and ECL imaging of latent fingerprints [36]; 2015, ECL imaging for single-cell [37]. | |
Imaging analysis based on ECL is not only a powerful tool to visualize the electrode heterogeneity and to characterize electrochemical reaction kinetics at a microscopic level, but also a fastdeveloping technology in bioanalysis with high spatiotemporal resolutions, high throughput and visualization features [38, 39]. This review will focus on the recent advances in ECL imaging analysis based on nanomaterials and micro-nanostructures.
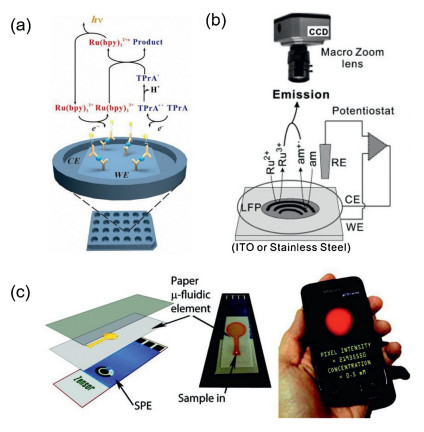
2. Apparatus for electrochemiluminescence imagingECL imaging techniques have been successfully commercialized and widely used in clinical diagnosis. For example, Meso Scale Discovery (MSD) has devised a microplate graphite electrode array for high-throughput and high-sensitivity detection [40]. As shown in Fig. 2a, each microplate contains a graphite working electrode and a counter electrode. When the ECL luminophores are specifically bonded to the graphite electrode surface, the ECL signals can be captured by CCD to form ECL images. In order to achieve simultaneous detection of multiple analytes, each microplate pore could be further divided into several regions that specifically labelled various biorecognition units. The detection efficiency can be greatly improved with reducing consumption of samples and increasing throughput of analysis.

|
Download:
|
| Fig. 2. (a) ECL imaging analysis based on the microplate graphite electrode developed by MSD Inc., with reference from Meso Scale Discovery [40]; (b) ECL imaging setup used for latent fingerprints (LFP) imaging, Ru2+ and am represent the ECL luminophore ruthenium complex and amine coreactant. Reproduced with permission [36]. Copyright 2012, Wiley-VCH. (c) ECL imaging analysis based on paper-based microfluidic and mobile phone camera, SPE means screen-printed electrode. Copied with permission [44]. Copyright 2010, American Chemical Society. | |
As light excitation is not needed, the ECL imaging system at the micro- or nanoscale is relatively simple and can be flexibly built. In general, the ECL imaging system consists of three parts including an electrochemical workstation for triggering the electrochemical reactions at an electrode surface, an electrochemical cell and an optical detector for acquisition of ECL signals, among which the detector is often considered the critical factor on the quality of ECL images. In 1990s, micro-/nanoscaled ECL imaging was captured by PMT tactfully combing SECM equipped with ultramicroelectrode [33, 41, 42]. However, this imaging strategy was commonly required high-cost and precise instruments and complex previous preparation, which were difficult to be popularized and used widely. Meanwhile the long-time imaging process was a disturbing problem. The demerits were overcome with the appearance of CCD camera, which offers the advantages of instant image construction and compatibility for high-throughput analysis. CCD can capture optical image featured with high-resolution, thus it is quite suitable to observe the details of single entities. The Su group has reported a rather original application of ECL imaging to visualize latent fingerprints (as seen in Fig. 2b), which kept high resolution at micrometer level [36, 43]. Whereas, with the decrease of required analysis scale, poor sensitivity of CCD is the main barrier in getting high-quality ECL images. This demerit can be overcome with the appearance of electronic multiplying charge coupled device (EMCCD) whose sensitivity can reach singlephoton level owing to the exist of multiplier register. Lately, EMCCD gradually becomes one of the most popular detectors for micro- or nanoscale ECL imaging.
Recently, researchers constructed a paper-based microfluidic ECL sensor for 2-dibutylaminoethanol (DBAE) and nicotinamide adenine dinucleotide (NADH) detection. Interestingly, the detection results were visually displayed on the mobile phone camera (as shown in Fig. 2c) [44]. The portable device as the readout tool made it low-cost and suitable for developing the point-of-care testing (POCT) devices in remote and underdeveloped areas, which may predict the development trend of ECL analysis instrument in the future.
3. ECL imaging based on nanomaterials and micro-/nanostructures 3.1. ECL imaging for single nanoemittersSi QDs were reported firstly as an effective ECL nanoemitters in acetonitrile by Bard et al. in 2002 [15]. Soon after, CdSe QDs [45], CdS QDs [46], and graphene quantum dots (GQDs) [47] were successfully applied in ECL investigations in aqueous solutions. Single QDs could be recognized as state-of-the art nanoemitters, but their low emission intensity hampers the practical applications. ECL emitted from single nanoemitters remains rare limited at present. Thanks to the improvement of single photon counter devices and microscopy objectives with greater numerical aperture (NA), Barbara et al. captured the first ECL images of single conjugate polymer nanoparticle (poly(9, 9-dioctylfluorene-co-benzothiadiazole), F8BT, 25 ± 15 nm in radius, see details in Fig. 3). This visualized ECL prototype is very promising to open a broad avenue for ECL imaging at the single nanoparticle level and multiplexed imaging analysis [35].

|
Download:
|
| Fig. 3. (a) The chemical structure of poly(9, 9-dioctylfluorene-co-benzothiadiazole), F8BT; (b) the electrochemical cell for ECL imaging; (c) Wide-field ECL images of F8BT nanoparticles (inset depicts ECL imaging from four individual particles); (d) The photoluminescence (PL) image of F8BT nanoparticles shown in the same zone in plot c. Copied with permission [35]. Copyright 2008, American Chemical Society. | |
Nanoparticles with super high surface area make them ideal carriers for ECL molecules. Hybrid nanoemitters can be easily fabricated by loading molecules or nanomaterial luminophores into polystyrene (PS) nanobeads or silica (SiO2) nanoparticles, which greatly broaden the source of ECL nanoemitters. Taking advantages of simple preparation, controllable morphology and size, good biocompatibility and strong resistance to organic solvents, SiO2 nanoparticles are the widely used ones. For example, Ru@SiO2 nanoparticles could be specifically labeled to the cell, which visually realized location and detection of tumor biomarkers via ECL imaging technique [48].
3.2. ECL imaging for single particle collisionSingle-particle collision is an effective way to gain insight into electrochemical process of single nanoparticles. In the classical way, the collision occurs between the nanoparticles and an ultramicroelectrode. The saltation of electrochemical signal caused by electrocatalysis is the significant sign of collision occurrence [49]. The traditional collision mode has huge advantage in the time resolution while suffers from poor SNR and complex operation process. To overcome these, in 2008 Bard et al. firstly introduced nearly no-background ECL as the reporter for single-nanoparticle collision events [50]. With the participation of ECL nanoemitters, the collision process could be tracked and displayed through ECL imaging. Considering the speedy diffusion and minuscule size of ECL nanoemitters, an ECL microscopy which could conduct ECL imaging with high spatial and temporal resolution at nanoscale is in need. The ECL microscopy applied in imaging at nanometer is generally equipped with objective with large NA to reduce the loss of light and EMCCD to enhance sensitivity to light, which could effectively improve the quality of ECL images.
So far, the highest time-resolution of ECL imaging was 0.2 s on the ECL microscopy built by Zhu et al., which successfully captured the ECL images of collision trajectory of Ru(bpy)32+@SiO2 nanoparticles (RuDSNs, ~62 nm) (as shown in Fig. 4) [51]. In the images, several bright ECL spots flashed over time, which directly indicated the occurrence of collision. Through studying the intensity and location of ECL points in detail, it was found that the nanoparticles were more likely to land at the edge of the electrode where higher diffusive flux of both the nanoparticles and coreactant existed. Moreover, a strategy called "relay probe" was proposed for longtime observation of collision process. In a word, ECL imaging based on ECL microscopy showed great potential in studying electrochemistry behavior of single nanoparticles.

|
Download:
|
| Fig. 4. Schematic illustration of the ECL microscopy setup. (b) Single ECL spike and (c) staircase signals during the collisions process; Insets: ECL snapshots of individual RuDSNs during a typical collision process. Constant potential: 1.4 V, scale bars (white): 2 μm, exposure time: 0.2 s. Adapted and reproduced with permission [51]. Copyright 2018, Royal Society of Chemistry. | |
3.3. ECL imaging at single particle level
Since the discovery of unique catalytic properties of nanoparticles, researchers have devoted tremendous effort on developing excellent nanocatalysts [52-54]. It is known that the catalytic behavior of nanoparticles is highly structure-depended, including size, composition, morphology and surface states [55, 56]. Studying catalysis at single-nanoparticle level could further demonstrate mechanisms of catalytic process, directly show the effect of structure on the catalytic ability and provide significant guidance for designing novel nanocatalysts. Zhang et al. immobilized the single Au nanoparticles (Au NPs) on the surface of the nanoelectrode and the steady-state voltammetric responses were available to compare the electrocatalytic activity of single Au NPs under various circumstances [57]. Recently, SECM at nanoscale was applied to directly disclose the relationship between geometry of single Pt nanoparticle (Pt NP) and its electrocatalytic ability [58]. Nonetheless, the high requirements of instrument and time-consuming analysis process hindered electrochemical method to go further in single-nanoparticle analysis. On the other hand, researchers tried to use various optical technologies (including super-resolution fluorescence microscopy [59], surface plasmon resonance microscopy (SPRM) [60] and surface-enhanced Raman scattering (SERS) [61]) to visualize the behavior of single nanoparticles, which were recognized for their high throughput and spatial and temporal resolution. However, the additional light source caused another obstacle to limit analysis sensitivity.
ECL imaging, known as the combination of electrochemical process which is easy to control and operate and low-background optical readout, offers another possibility to dynamically monitor electrocatalysis of single nanoparticles. In pursuit of higher quality ECL imaging, reducing the light electrogenerated by substrate electrode during electrocatalysis is a top priority. It is found that modifying the indium tin oxides (ITO) electrode with Al film could efficiently decrease the noise from substrate electrode [62]. Besides, TiO2 film-modified ITO electrode was also an ideal substrate electrode to get high SNR ECL imaging of single Au NP [63].
In consideration of strong spatial controllability of ECL reactions, ECL imaging is a promising means to investigate the relationship between the surface state of nanoparticles and electrocatalytic activity. Pan et al. imaged single Au NP and studied the influence of nanoparticle size and applied-potential on electrocatalytic behavior via ECL imaging for the first time [64]. In ECL imaging, duration of ECL generated on the surface of Au NPs was short and the ECL intensity fluctuated obviously, which showed unexpectedly unsteady electrocatalytic activity of Au NPs. It was attributed to the surface oxidation of Au NPs caused by ECL reaction. ECL imaging of several Au nanowires with different surface states confirmed it [65].
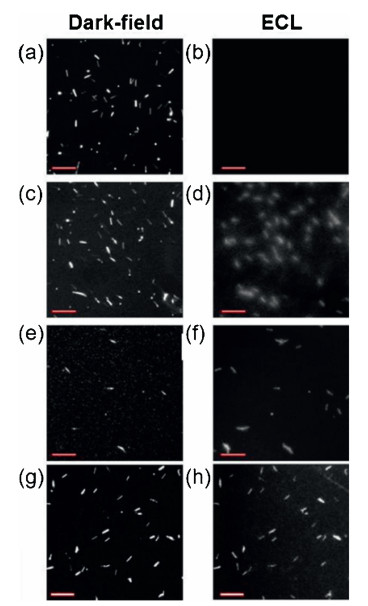
As shown in Fig. 5, the commercial gold nanowires without any treatment could not produce ECL, indicating the lack of electrocatalytic activity, because the surfaces of gold nanowires were passivated by the surfactants. After removal of the surfactants, the appearance of ECL on the nanowires confirmed the surfacedependent electrocatalytic activity. For further proving, PEDOT:PSS - PVA, a kind of conductive polymer, was coated on the nanowires to protect the surface from the serious oxidation. The clearer single nanowire ECL images with higher resolution were captured within expectation. Based on ECL imaging of single-nanowires, it was obviously shown that the activity of nanoparticle surface was the key to enhance electrocatalytic performance.

|
Download:
|
| Fig. 5. Dark-field scattering images of single gold nanowires (a, c, e, g) and the corresponding ECL images (b, d, f, h); (a, b) as-purchased gold nanowires; (c, d) gold nanowires with removal of surfactant; (e - h) gold nanowires coated with PEDOT: PSS - PVA by (e, f) drop casting on ITO electrode and (g, h) spin coating on ITO electrode. Scale bar: 20 mm. Copied with permission [65]. Copyright 2015, American Chemical Society. | |
Xu et al. focused on the relationship between composition of nanoparticles and electrocatalytic activity, and the effect of composition on electrocatalysis could also be judged by ECL imaging (Fig. 6) [62]. The result showed that the well-designed Janus nanoparticles composed by Au and Pt generated increased and stable ECL signals, which indicated higher electrocatalytic efficiency of the asymmetric nanoparticles. The author attributed it to different heterogeneous electron-transfer rates on the ends of the asymmetric Au-Pt nanoparticles. Therefore, there was a concentration gradient of reactants (Ru(bpy)32+ and TPrA) around the Au-Pt nanoparticle leading to the appearance of local fluid slip, which could speed up mass transportation and prevent the nanoparticle from oxidation. The latest work reported by the same group further visualized the electrocatalytic activity of single 2D micro-sized gold nanoplate via ECL imaging [66]. Surprisingly, both the spatial difference and the real-time change of singlenanoplate electrocatalytic activity could be reflected by distribution of ECL intensity in the images, which highlighted the huge potential of ECL imaging in becoming a compelling tool for studying properties of the individual nanoparticle. In summary, ECL microscopy and imaging provided investigation on singlenanoparticle electrocatalysis effective method to measure catalyzing performance.

|
Download:
|
| Fig. 6. ECL imaging of electrocatalysis at Au-Pt NPs. Adapted and reproduced with permission [62]. Copyright 2018, Wiley-VCH. | |
Except for noble metal nanoparticles, other kinds of nanoparticles which possessed better electrochemical stability were developed to investigate more types of reaction process combining ECL imaging. CdSeTe QDs, served as nanocatalyzer rather than ECL nanoemitter, were loaded into SiO2 microparticle to catalyze the oxidation of water [67]. In the presence of L012 (a kind of luminol derivative) and H2O2, the whole process of electrocatalysis could be visualized by enhanced ECL imaging. Lately, Zhu et al. reported outstanding electrocatalytic ability and electrochemical stability of TiO2 nanoparticles in luminol/H2O2 ECL system [68]. To our great satisfaction, a long-time (as long as 90 min) ECL imaging of cells was realized based on rutile TiO2 nanoparticles.
3.4. ECL imaging based on micro-/nanoarraysAs we all know, when at least one dimension of the electrode is scaled down to the micro- or nano-level, some special electrochemical properties appear, such as small polarization current, rapid response rate and high SNR, which makes the micro- or nano-electrodes useful in sensing and detecting, especially in biochemical analysis. Composed of multiple electrodes arranged in order, the micro- and nanoelectrode arrays have additional advantage of amplificated electrochemical signals, which could be a promising tool in high-throughput and fast analysis combining ECL imaging. As early as 1980s, researchers observed ECL on the Pt microelectrode array [69]. With the advent of high sensitivity imaging equipment, the optical resolution of ECL imaging based on the microelectrode reached micron level in 2006 [70]. Crooks et al. fabricated a micro-sized bipolar electrode (BPE) array which contained 1000 Au BPEs (each BPE had the length of 500 μm and the width of 50 μm) on the glass side [71]. From ECL imaging, it was found that every BPE had a clear ECL image individually, which was independent respectively. Moreover, this micro-BPE array could be constructed in large area, which showed the great potential of micro-BPE array to be a highefficiency ECL sensor.
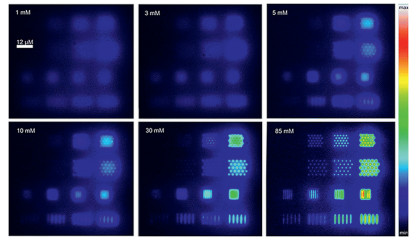
Especially with the appearance of the optical fiber (bundle) which owned excellent light transmission capability, it was considered to be one of the best substrates for constructing micro- or nanoelectrode arrays which would be utilized in ECL imaging. In 2003, Walt et al. prepared tapered Au microelectrode array on the fiber bundles by chemical wet etching and successfully captured the spatially resolved ECL images of the microelectrode array [34]. Furthermore, via post-treatment, a nanoelectrode array was fabricated from the tapered Au microelectrode array, in which the single nanoelectrode could be imaged with a higher resolution. It was mainly due to the smaller electrode size leading to less overlap of diffusion layers between adjacent electrodes. Another more complicated nanoelectrode arrays were constructed by Ugo et al. to systematically study the effect of the shape and distribution of the nanoelectrodes on their ECL imaging quality [72]. As for the brief preparation process, a layer of polycarbonate (PC) was spincoated on boron-doped diamond (BDD) substrate and then went through the e-beam lithographic procedure to exposure the BDD. In this way, nanoelectrode arrays could be formed with accurate controlling of size, shape and location. The ECL imaging directly showed that the larger size of the nanoelectrode and the closer distance between neighbors contributed to higher ECL intensity, when the nanoelectrode was in the same geometry (as shown in Fig. 7). It could be explained by the overlap of diffusion layers between adjacent nanoelectrodes. Additionally, the size of ECL emission zone, that is, the resolution of ECL image was closely related to the concentration of the co-reactant. In line with the molecular diffusion theory, the ECL imaging illustrated that with increasing concentration of TPrA, the ECL region of every nanoelectrode in the array shrunk and lead to clearer ECL image. All the basic research about ECL imaging on micro- or nanoelectrode array was the important reference in designing micro- or nanoelectrode array for ECL imaging analysis.

|
Download:
|
| Fig. 7. ECL images (false color) of Ru(bpy)32+ obtained on 16 nanoelectrode arrays with different concentrations of TPrA. The concentrations of TPrA were indicated in top-left corner of each box (from left to right are 1, 3, 5 mmol/L for the first row and 10, 30, 85 mmol/L for the second row). Scale bar: 12 μm. Copied with permission [72]. Copyright 2016, Springer Nature. | |
ECL imaging based on microelectrode array has been applied in sensing, which was expected to be high-throughput, rapid and visual. Sojic et al. etched an array of 6000 microelectrodes on the optical fiber beam bundles. At a certain potential, ECL generated on the microelectrode array was transmitted to the CCD through the optical fiber for imaging. Using this strategy, remote ECL imaging sensing of Ru(bpy)32+ and TPrA [73], hydrogen peroxide [74] and NADH [75] was conducted. A good linear relationship between the content of the analyte and ECL intensity, steady repeatability of analysis and the low LOD were obtained from ECL imaging analysis. Furthermore, the microelectrode arrays with super-high density were modified by various kinds of oxidases by Jiang et al. [76], which provided a powerful tool to detect multiple biomolecules, such as glucose, lactate and choline, in complex sample via ECL imaging.
4. Conclusions and outlookAs one of the leading transduction/reporting signals in analytical chemistry, ECL exhibits the promising applications ranging from the commercial clinical diagnosis to the advanced scientific research. Readout of ECL signals via imaging, especially coupling with microscopy, is a very powerful tool for both basic research and practical detection. Nowadays, ECL-based imaging technique allows us not only to revisit the ECL mechanisms at the single-particle level, but also to detect multiple analytes simultaneously. Moreover, the visualization of single-entities at the nanoscale level via ECL-based microscopy is already achieved such as ECL imaging on a single Au nanowire/Pt-Au Janus nanoparticle surface and identification of the collision process of nanoemitters on the electrode surface. Comparing with a traditional approach, SECM, which obtained spatially resolved electrochemical signals via long-time scanning, ECL imaging technique exhibits innately high temporal resolution. Though the spatiotemporal resolution of plasmonic-based electrochemical microscopy can be reached up to sub-millisecond and sub-micron levels simultaneously, the sensitivity is still being improved. As the external illumination source is not needed, ECL imaging is free of background light interference, ensuring the high sensitivity for chem-/bio-sensing. Clearly, high spatiotemporal resolution and high sensitivity are the two distinguished features of ECL imaging technique, endowed it the strong competitiveness. Some progress of ECL imaging has been made, but there are still many challenges such as single-molecule detection and super-resolution imaging. Nevertheless, we believe this fast-developing research field will achieve more progresses in near future.
AcknowledgmentsThis work was supported by the National Natural Science Foundation of China (Nos. 21575126 and 21874117) and the Natural Science Foundation of Zhejiang Province (No. LZ18B050001).
| [1] |
M.M. Richter, Chem. Rev. 104 (2004) 3003-3036. DOI:10.1021/cr020373d |
| [2] |
L. Hu, G. Xu, Chem. Soc. Rev. 39 (2010) 3275-3304. DOI:10.1039/b923679c |
| [3] |
N.E. Tokel, A.J. Bard, J. Am. Chem. Soc. 94 (1972) 2862-2863. DOI:10.1021/ja00763a056 |
| [4] |
W. Miao, Chem. Rev. 108 (2008) 2506-2553. DOI:10.1021/cr068083a |
| [5] |
M. Hesari, Z. Ding, J. Electrochem. Soc. 163 (2016) 3116-3131. DOI:10.1149/2.0161604jes |
| [6] |
W. Guo, Y. Liu, Z. Cao, et al., J. Anal. Test 1 (2017) 14. DOI:10.1007/s41664-017-0013-9 |
| [7] |
W. Miao, J. Choi, A.J. Bard, J. Am. Chem. Soc. 124 (2002) 14478-14485. DOI:10.1021/ja027532v |
| [8] |
M. Sentic, M. Milutinovic, F. Kanoufi, et al., Chem. Sci. 5 (2014) 2568-2572. DOI:10.1039/C4SC00312H |
| [9] |
D. Bruce, M.M. Richter, Anal. Chem. 74 (2002) 1340-1342. DOI:10.1021/ac0111513 |
| [10] |
B.D. Muegge, M.M. Richter, Anal. Chem. 76 (2004) 73-77. DOI:10.1021/ac035038j |
| [11] |
E.H. Doeven, E.M. Zammit, G.J. Barbante, et al., Angew. Chem. Int. Ed. 51 (2012) 4354-4357. DOI:10.1002/anie.201200814 |
| [12] |
E.H. Doeven, E.M. Zammit, G.J. Barbante, et al., Chem. Sci. 4 (2013) 977-982. DOI:10.1039/C2SC21707D |
| [13] |
E.H. Doeven, G.J. Barbante, E. Kerr, et al., Anal. Chem. 86 (2014) 2727-2732. DOI:10.1021/ac404135f |
| [14] |
W. Guo, H. Ding, C. Gu, et al., J. Am. Chem. Soc. 140 (2018) 15904-15915. DOI:10.1021/jacs.8b09422 |
| [15] |
Z. Ding, B.M. Quinn, S.K. Haram, et al., Science 296 (2002) 1293-1297. DOI:10.1126/science.1069336 |
| [16] |
N. Myung, Z. Ding, A.J. Bard, Nano Lett. 2 (2002) 1315-1319. DOI:10.1021/nl0257824 |
| [17] |
Y. Bae, N. Myung, A.J. Bard, Nano Lett. 4 (2004) 1153-1161. DOI:10.1021/nl049516x |
| [18] |
L. Sun, L. Bao, B. Hyun, et al., Nano Lett. 9 (2009) 789-793. DOI:10.1021/nl803459b |
| [19] |
N. Myung, Y. Bae, A.J. Bard, Nano Lett. 3 (2003) 1053-1055. DOI:10.1021/nl034354a |
| [20] |
M. Li, Q. Kong, Z. Bian, et al., Biosens. Bioelectron. 65 (2015) 176-182. DOI:10.1016/j.bios.2014.10.022 |
| [21] |
T. Li, S. Dong, E. Wang, J. Am. Chem. Soc. 132 (2010) 13156-13157. DOI:10.1021/ja105849m |
| [22] |
Z. Shi, G. Li, Y. Hu, Chin. Chem. Lett. (2019). DOI:10.1016/j.cclet.2019.04.066 |
| [23] |
Y. Zhao, Q. Wang, J. Li, et al., J. Mater. Chem. B 4 (2016) 2963-2971. DOI:10.1039/C6TB00120C |
| [24] |
Y. Kim, J. Kim, Anal. Chem. 86 (2014) 1654-1660. DOI:10.1021/ac403415m |
| [25] |
H. Lim, Y. Ju, J. Kim, Anal. Chem. 88 (2016) 4751-4758. DOI:10.1021/acs.analchem.6b00073 |
| [26] |
Z. Zhou, W. Guo, L. Xu, et al., Anal. Chim. Acta 886 (2015) 48-55. DOI:10.1016/j.aca.2015.06.005 |
| [27] |
W. Guo, X. Lin, F. Yan, et al., ChemElectroChem 3 (2016) 480-486. DOI:10.1002/celc.201500329 |
| [28] |
D.M. Hercules, Science 145 (1964) 808. DOI:10.1126/science.145.3634.808 |
| [29] |
R.C. Engstrom, K.W. Johnson, S. Desjarlais, et al., Anal. Chem. 59 (1987) 670-673. DOI:10.1021/ac00131a028 |
| [30] |
R.C. Engstrom, C.M. Pharr, M.D. Koppang, J. Electroanal. Chem. 221 (1987) 251-255. DOI:10.1016/0022-0728(87)80262-0 |
| [31] |
C.M. Pharr, R.C. Engstrom, R.A. Tople, J. Electroanal. Chem. 278 (1990) 119-128. DOI:10.1016/0022-0728(90)85127-Q |
| [32] |
P. Pantano, W.G. Kuhr, Anal. Chem. 65 (1993) 2452-2458. DOI:10.1021/ac00066a009 |
| [33] |
F.F. Fan, D. Cliffel, A.J. Bard, Anal. Chem. 70 (1998) 2941-2948. DOI:10.1021/ac980107t |
| [34] |
S. Szunerits, J.M. Tam, L. Thouin, et al., Anal. Chem. 75 (2003) 4382-4388. DOI:10.1021/ac034370s |
| [35] |
Y. Chang, R.E. Palacios, F.F. Fan, et al., J. Am. Chem. Soc. 130 (2008) 8906-8907. DOI:10.1021/ja803454x |
| [36] |
L. Xu, Y. Li, S. Wu, et al., Angew. Chem. Int. Ed. 51 (2012) 8068-8072. DOI:10.1002/anie.201203815 |
| [37] |
J. Zhou, Y. Chen, D. Fang, et al., Anal. Chem. 87 (2015) 8138-8143. DOI:10.1021/acs.analchem.5b00542 |
| [38] |
G. Jiang, X. Liu, Y. Wang, et al., Anal. Sci. 32 (2016) 1023-1027. DOI:10.2116/analsci.32.1023 |
| [39] |
X. Liu, M. Dong, H. Qi, et al., Anal. Chem. 88 (2016) 8720-8727. DOI:10.1021/acs.analchem.6b02070 |
| [40] |
Meso Scale Diagnostics, 2019, https://www.mesoscale.com/en/technical_resources/our_technology/ecl.
|
| [41] |
R.G. Maus, R.M. Wightman, Anal. Chem. 73 (2001) 3993-3998. DOI:10.1021/ac010128e |
| [42] |
Y. Zu, Z. Ding, J. Zhou, et al., Anal. Chem. 73 (2001) 2153-2156. DOI:10.1021/ac001538q |
| [43] |
L. Xu, Y. Li, Y. He, et al., Analyst 138 (2013) 2357-2362. DOI:10.1039/c3an00110e |
| [44] |
J.L. Delaney, C.F. Hogan, J. Tian, et al., Anal. Chem. 83 (2011) 1300-1306. DOI:10.1021/ac102392t |
| [45] |
G. Zou, H. Ju, Anal. Chem. 76 (2004) 6871-6876. DOI:10.1021/ac049012j |
| [46] |
T. Ren, J. Xu, Y. Tu, et al., Electrochem. Commun. 7 (2005) 5-9. DOI:10.1016/j.elecom.2004.10.005 |
| [47] |
L. Li, J. Ji, R. Fei, et al., Adv. Funct. Mater. 22 (2012) 2971-2979. DOI:10.1002/adfm.201200166 |
| [48] |
J. Cao, Y. Wang, J. Zhang, et al., Anal. Chem. 90 (2018) 10334-10339. DOI:10.1021/acs.analchem.8b02141 |
| [49] |
A.J. Bard, H. Zhou, S.J. Kwon, Isr. J. Chem. 50 (2010) 267-276. DOI:10.1002/ijch.201000014 |
| [50] |
F.F. Fan, A.J. Bard, Nano Lett. 8 (2008) 1746-1749. DOI:10.1021/nl8009236 |
| [51] |
C. Ma, W. Wu, L. Li, et al., Chem. Sci. 9 (2018) 6167-6175. DOI:10.1039/C8SC02251H |
| [52] |
W. Han, N. Liu, C. Liu, et al., Chin. Chem. Lett. 21 (2010) 1411-1414. DOI:10.1016/j.cclet.2010.06.019 |
| [53] |
M.Z. Kassaee, R. Mohammadi, H. Masrouri, et al., Chin. Chem. Lett. 22 (2011) 1203-1206. |
| [54] |
G. Zhang, R. Wang, G. Li, Chin. Chem. Lett. 29 (2018) 687-693. DOI:10.1016/j.cclet.2018.01.043 |
| [55] |
A.T. Bell, Science 299 (2003) 1688-1691. DOI:10.1126/science.1083671 |
| [56] |
C. Burda, X. Chen, R. Narayanan, et al., Chem. Rev. 105 (2005) 1025-1102. DOI:10.1021/cr030063a |
| [57] |
Y. Li, J.T. Cox, B. Zhang, J. Am. Chem. Soc. 132 (2010) 3047-3054. DOI:10.1021/ja909408q |
| [58] |
J. Kim, C. Renault, N. Nioradze, et al., J. Am. Chem. Soc. 138 (2016) 8560-8568. DOI:10.1021/jacs.6b03980 |
| [59] |
N.M. Andoy, X. Zhou, E. Choudhary, et al., J. Am. Chem. Soc. 135 (2013) 1845-1852. DOI:10.1021/ja309948y |
| [60] |
D. Jiang, Y. Jiang, Z. Li, et al., J. Am. Chem. Soc. 139 (2017) 186-192. DOI:10.1021/jacs.6b08923 |
| [61] |
K. Imura, H. Okamoto, M.K. Hossain, et al., Nano Lett. 6 (2006) 2173-2176. DOI:10.1021/nl061650p |
| [62] |
M. Zhu, J. Pan, Z. Wu, et al., Angew. Chem. Int. Ed. 57 (2018) 4010-4014. DOI:10.1002/anie.201800706 |
| [63] |
D.M. Benoist, S. Pan, J. Phys. Chem. C 114 (2010) 1815-1821. |
| [64] |
S. Pan, J. Liu, C.M. Hill, J. Phys. Chem. C 119 (2015) 27095-27103. DOI:10.1021/acs.jpcc.5b06829 |
| [65] |
A.J. Wilson, K. Marchuk, K.A. Willets, Nano Lett. 15 (2015) 6110-6115. DOI:10.1021/acs.nanolett.5b02383 |
| [66] |
M. Chen, W. Zhao, M. Zhu, et al., Chem. Sci. 10 (2019) 4141-4147. DOI:10.1039/C9SC00889F |
| [67] |
Y. Chen, J. Fu, C. Cui, et al., Anal. Chem. 90 (2018) 8635-8641. DOI:10.1021/acs.analchem.8b01935 |
| [68] |
C. Cui, Y. Chen, D. Jiang, et al., Anal. Chem. 91 (2019) 1121-1125. DOI:10.1021/acs.analchem.8b04778 |
| [69] |
C.E. Chidsey, B.J. Feldman, C. Lundgren, et al., Anal. Chem. 58 (1986) 601-607. DOI:10.1021/ac00294a026 |
| [70] |
C. Amatore, C. Pebay, L. Servant, et al., ChemPhysChem 7 (2006) 1322-1327. DOI:10.1002/cphc.200500626 |
| [71] |
K. Chow, F. Mavré, J.A. Crooks, et al., J. Am. Chem. Soc. 131 (2009) 8364-8365. DOI:10.1021/ja902683f |
| [72] |
M. Sentic, F. Virgilio, A. Zanut, et al., Anal. Bioanal. Chem. 408 (2016) 7085-7094. DOI:10.1007/s00216-016-9504-1 |
| [73] |
A. Chovin, P. Garrigue, P. Vinatier, et al., Anal. Chem. 76 (2004) 357-364. DOI:10.1021/ac034974w |
| [74] |
A. Chovin, P. Garrigue, N. Sojic, Electrochim. Acta 49 (2004) 3751-3757. DOI:10.1016/j.electacta.2004.01.084 |
| [75] |
A. Chovin, P. Garrigue, N. Sojic, Bioelectrochemistry 69 (2006) 25-33. DOI:10.1016/j.bioelechem.2005.10.002 |
| [76] |
J. Zhang, J. Zhou, C. Tian, et al., Anal. Chem. 89 (2017) 11399-11404. DOI:10.1021/acs.analchem.7b02363 |