 2019, Vol. 30


b Faculty of Science and Technology, University of Macau, Taipa 999078, Macau, China
In the past, various techniques including electrochemistry [1], optical strategies [2-4], nuclear magnetic resonance [5] and mass spectroscopy [6] have been established, which provide rich information for accurate bioanalysis and disease diagnosis. Among the commonly used techniques, optical strategies, such as fluorescence (FL), are by far the most significant techniques for bioanalysis, especially at the single cell level [7, 8]. FL microscopy offers high contrast images containing fruitful information on biomolecules by modifying appropriate fluorescent dyes. Especially the recently proposed super-resolution FL microscopy provides more possibilities for bioanalytical applications. Unlike FL spectroscopy requires labeling external dye molecules, Raman spectroscopy, discovered by Sir. C.V. Raman in 1928, depends on the inelastic light scattering of the sample [9, 10].
Raman spectroscopy measures the vibrational, rotational, and other low-frequency modes of molecules, and offers specific fingerprints to distinguish molecular components, structure, conformation, and the interaction between molecules [11, 12]. A Raman spectrum contains the native fingerprint vibrational information on the sample determined by the constituents, the symmetry, and the environment, which offers an ultrahigh spatial resolution bases on its flexible excitation source from UV to nearinfrared light. Hence, it has been extensively applied to determine the chemical components, molecular structure, conformation and even interaction between diverse molecules. Moreover, this technique is available in aqueous solutions as a consequence of the negligible Raman signal of water, which exhibits great potential in bioanalytical applications [13-16]. However, the Raman cross section of molecules is much smaller than their corresponding emission cross sections, and hence the inherently weak nature of Raman signatures limited its extended applications [17, 18]. In the 1970s, surface-enhanced Raman scattering (SERS) phenomena was observed upon significantly enhanced Raman signals of pyridine molecules adsorpted on the rough silver electrode surface, which led to the rapid and extensive development of Raman scattering spectroscopy technique [19]. In SERS, several orders of magnitude enhancement enable the observation of a signal from a monolayer species and even a single molecule deposit on nanoscale rough metal surfaces, which greatly improve the detection sensitivity of Raman spectroscopy technique [20-23]. SERS has opened up a new avenue for bioanalytical and biomedical research, exhibiting outstanding merits compared with traditional bioanalysis strategies: (1) SERS spectra can reflect the intrinsic molecular fingerprint information of biological samples [24]; (2) SERS technique provides non-destructive and ultrasensitive detection even down to single molecule level [25]; (3) SERS is able to prevent the damage from photodegradation and photobleaching [26]; (4) SERS spectrum has much narrower bandwidth compared to FL spectrum [27, 28] and (5) SERS substrate is designable for multiplex detection under single wavelength excitation, especially it can be optimized for nearinfrared laser excitation to avoid the native autofluorescence from the biological samples and to minimize the photo damage to living cells [29]. Based on these merits, SERS technique has been widely used for the determination of biomolecules, disease biomarkers, microbes and bacteria, as well as cancer cells and tumor tissue imaging [24, 30].
However, the difference in depth of laser, the interference of laser fluctuation and substrate non-uniformity could affect the reliability of SERS analysis, which could hinder practical application performance to a large extent [31]. Great efforts have been devoted to improving the reliability of SERS, especially in the rational design of SERS-active substrate of superior surface plasmon resonance (SPR) effect with some noble metal nanomaterials like Au, Ag and Cu [32]. Undeniably, those traditional plasmonic nanomaterials substrates have unique advantages of controllable morphology, adjustable size and excellent optical properties. SERS enhancement efficiency is related to substrate's morphology and distribution, the distance between the Raman signal molecules and the substrate [33, 34]. Molecules usually directly attached to the substrate surface can cause photocarbonization of signal molecules or nearby impurity molecules under strong or prolonged laser irradiation, which severely limited the extensive practical applications of SERS [35, 36]. Some valuable strategies have been proposed to expand the SERS technique to non-traditional substrates, most notably tip-enhanced Raman spectroscopy (TERS) where the probed substance can be on a generic substrate and where a nanoscale gold tip above the substrate acts as the Raman signal amplifier [37, 38]. However, TERS technique is limited to study molecules with large Raman cross-sections due to weak Raman scattering signal from the tip area [35].
In 2010, Li et al. [39] reported a novel shell-isolated nanoparticle-enhanced Raman spectroscopy (SHINERS) technique, in which the Raman signal amplification was provided by gold nanoparticles with an ultrathin silica or alumina shell. The ultrathin coating kept the nanoparticles from agglomerating, separated them from direct contact with the probed material, and meanwhile, overcame the problems of conventional SERS-active substrates to a large extent. Significantly, such shell-isolated nanoparticle offered new possibilities and flexible applications for bioanalysis, food safety, drugs, and environment pollutants [40, 41]. Graphene possesses superb mechanical strength, electrical conductivity, and optical properties, as well as good biocompatibility and low toxicity, which offers special advantages as a metal nanoparticle isolating material [31]. Metal nanoparticles with few-layer graphitic shell coating, termed as metal graphitic nanocapsules (MGNs), can protect the inner core from harsh acidic or alkalic environments and long-time laser exposure to guarantee stable optical properties [42-46]. As a kind of graphitic nanomaterials, MGNs have much larger Raman scattering cross sections compared to other organic Raman-active molecules [36, 47]. Furthermore, the graphitic shell is able to quench the background fluorescence interference from external environments via a FRET process and even avoid unnecessary reactions catalyzed by inner metal core, which greatly increased the reproducibility and reliability of SERS analysis [48]. It cannot be ignored that interferences from measurement conditions and external environment could cause the fluctuation of Raman signals, therefore IS molecule is usually introduced to improve the reliability of SERS detection [49-51]. Most of the reported SERS substrate requires the design of special structures or introduction of conventional IS tag including organic molecules and silicon for reliable and accurate SERS detection. The MGNs possess unique Raman scattering bands and themselves can act as Raman signal probe or stable IS for sensitive SERS analysis. It is worth noting that the 2D-band (~2650 cm-1) within the Raman-silent region of the cell can help to reduce the interference signals from environmental biomolecules. Hence, MGNs have been extensively applied in SERS biodetection and bioimaging applications [43, 47, 52]. In this context, we will introduce the preparation and unique properties of MGNs, as well as their extensive applications in SERS biodetection and bioimaging. A comprehensive conclusion drawn from these studies will shed light on the future direction of MGNs in SERS bioanalysis.
2. Properties of metal graphitic nanocapsulesMGNs, which structurally consist of a metal or alloy core encapsulated in an inert graphitic, have aroused widespread attention in many fields [53-56]. The anticipated applications determine the inner metal core that graphitic nanocapsules required, which in turn affects the structures and encapsulation of the graphitic shell. Carbon atoms within graphite shell are orderly arranged via a weak van der Waals force of attraction between layers, but strong covalent bonds within layers, endowing smooth texture of the graphite shell [57, 58]. Upon the unique structure and properties of graphite shell, various methods can be applied to prepare MGNs including carbon arc [59], radio frequency thermal plasma [60], wet chemical synthesis [61] and chemical vapor deposition (CVD) [62-64]. MGNs with better quality of graphitic shell can be prepared by employing a facile CVD method, while carbon arc and wet chemical synthesis methods make large-scale synthesis for more extensive applications. We will concentrate on the introduction of metal-catalyzed graphene CVD method to controllable synthesis of high-quality MGNs and describe their unique properties indetail toguide further bioanalysis applications.
The mechanism CVD for MGNs preparation is similar to that of traditional graphene CVD synthesis. A typical bulk metal-catalyzed graphene CVD growth procedures are as follows: (1) precursor gas are fed into the reactor and pass through the hot zone; (2) hydrocarbon precursors are decomposed to carbon radicals; (3) decomposed carbon species diffusion and dissolution on the surface and into the metal catalyst; (4) dissolved carbon atoms attach on the metal surface and (5) nucleation and growth of graphene on the surface of catalyst [31, 65, 66]. The metal substrate not only plays the role of a catalyst to lower energy barrier of the reaction, but also determines the specific graphene mechanism, which eventually affects the thickness and quality of graphene [66, 67]. Some metals like copper with poor affinity to carbon, the formation of graphene is realized by direct diffusion rather than dissolution and segregation of carbon atoms on the surface [68]. Actually, the two routes above usually coexist in the graphene CVD processes, but which route dominates highly dependent on the properties of the metal substrate [66]. For the synthesis of MGNs, the metal catalyst (like Au, Ag, Pt, Fe, Co, etc.) are confined into pores of the template such as fumed silica and then become nanodroplets at high temperature. Saturated carbon atoms originate from the carbon source pyrolysis will deposit on the metal catalyst surface, high-quality MGNs are finally obtained through rapid cooling [31, 69].
MGNs with controllable sizes have been well-prepared and the core-shell structure was confirmed by scanning electron microscope (SEM) and high-resolution transmission electron microscope (HR-TEM) [45, 52, 70]. The inert graphitic shells can protect the metal core from erosion even in harsh conditions, and meanwhile, maintain their inherent properties. MGNs have two remarkable Raman vibration bands, a disordered (D)-band and a graphitic carbon (G)-band located at ~1330 and ~1590 cm-1, respectively. Intensities of 2D Raman band at ~2650 cm-1, about twice the frequency of the D-band, mainly depend on the layers of graphitic shells. The UV-vis spectra of MGNs mainly rely on the optical properties of the inner metal core, whereas the characteristic peak of graphitic shell located at 265 nm approximately. MGNs are hydrophobic but easy to modify with amphiphilic surfactants or perform chemical surface modifications due to the unique structure and properties of the outside graphitic shell. MGNs showed good water solubility with the introduction of hydroxyl and carboxyl groups on the surface by treating with high concentration of strong-oxidizing mixed acids [71]. Much better water solubility achieved, and meanwhile, maintained their surface integrity by attaching hydrophobic alkyl-modified PEG polymers on the surface through strong hydrophobic-hydrophobic interaction [36]. Amphiphilic functionalized MGNs endowing good solubility in different solutions for extended bioanalytical applications [44]. Undoubtedly, functionalized MGNs possessed improved biocompatibility, which convenient for meeting the demands of future bioanalysis applications. In addition, smallmolecule drug loading capacity [36] and behaviors to enter different cell lines by endocytosis [72] were also deeply studied.
The metal core renders MGNs different physical, chemical, thermal and optical properties. Different types of MGNs can be flexibly controlled for desired bioanalytical purposes. For instance, Co encapsulated magnetic graphitic nanocapsules was used for biomolecule detection and enrichment by utilizing the core magnetic properties by virtue of the strong magnetic core [71]. FeCo encapsulated magnetic graphitic nanocapsules (FeCo@G) were employed for in situ targeted magnetic resonance imaging (MRI) detection of Helicobacter pylori (H. pylori) in gastric environment [73]. Plasmonic Au, Ag or Cu graphitic nanocapsules have superior SERS performance of graphitic shell and detected molecules. Some relative works were developed for SERS detection and imaging [47, 52, 74]. Furthermore, the outside graphitic structure could be regulated for different applications. Doping of nitrogen element modulated electrical properties of the graphitic shell, and the doped MGNs were used as a catalyst for fuel cells [64]. Modulating the ratio of encapsulating binary metal optimized the surface electronic structure of graphitic layer for enhanced oxygen evolution reaction activity [53].
We will focus on the application of MGNs in Raman biodetection and bioimaging applications. As a kind of graphitic nanomaterials, they possess much larger Raman scattering cross sections compared to other organic Raman-active molecules. Benefiting from the outside inert graphitic shell, the MGNs are able to resist erosion and morphological variations from hash conditions. The graphitic shell can quench the background fluorescence interference from external environments via a FRET process and even avoid unnecessary reactions catalyzed by inner metal core. The graphitic shell with several characteristic Raman bands itself can act as the Raman signal probe, especially the 2D-band within the Raman silent region of the cell helps to reduce the interference signals from environmental biomolecules and increase the accuracy of SERS bioanalysis. Moreover, the graphitic shell is easily modified with hydrophilic or hydrophobic groups to meet the requirements for SERS analysis in complex systems [36, 42, 47, 52].
3. Metal graphitic nanocapsules for SERS detectionRaman spectroscopy technique has some inherent advantages including high specificity, minimal sample volume and low background interference from water, and most biomolecules are Raman active to provide distinctive fingerprint signals on the basis of their abundance, endowing this technique more possibilities for qualitative and quantitative bioanalysis [75]. However, Raman spectroscopy itself has fairly weak signal and this inherent nature limited its extensive applications to a large extent [18]. Fortunately, the development of SERS technique has opened up a new avenue for bioanalytical and biomedical research [76-81]. Although researchers have been paid much attention to the development of novel SERS analysis methods in the past decades, SERS as a quantitative detection technique remains a huge challenge since the SERS signal being predominantly contributed by the molecules in the hot spots [82]. A little change of the geometric structure, such as interparticle distance caused by the morphology alteration and aggregation of substrates, may result in an obvious signal fluctuation by several orders of magnitude [31]. Hence, it is of great importance to design rational SERS substrates for improving the reliability and accuracy of SERS analysis. MGNs structurally consist of a metal or alloy core encapsulated in an inert graphitic shell, exhibiting superior stability even under harsh environments. The graphitic shell with unique Raman scattering bands can act as stable Raman signal probe or IS tag, can quench the background fluorescence interference from analytes through a FRET process and even avoid unnecessary reactions catalyzed by inner metal core, which enable MGNs to provide a new path for future reliable SERS quantitative analysis. Herein, we will discuss the versatile MGNs in SERS biodetection and disease diagnosis applications.
SERS usually uses the unique SPR properties of plasmonic nanomaterials, including Au, Ag, Cu and hybrid metal nanocrystals with different morphology and size, to sensitively measure spectroscopic vibrations of detected molecules on or near the surface of plasmonic nanostructures [29, 83-86]. However, most of the nanomaterials are hard to keep their morphologies and properties under harsh conditions. Graphene-isolated-Au-nanocrystals (GIANs), which employed Au as the encapsulating core within graphitic shells, were prepared by a simple one-pot CVD method [36]. The graphitic shell possessed excellent robustness, endowing GIANs strong ability to resist erosion and morphological variations from extremely acidic or alkaline, high salt, strong oxidation and biological enzyme conditions. GIANs were used to increase the Raman signal of rhodamine 6 G (R6 G) in aqueous solution. The inert graphitic shell prevented it from direct contact with Au core and also quenched its background fluorescence through a FRET process, thus minimized the photocarbonization of R6 G or nearby impurities. Hence, an enhanced R6 G Raman signalto-noise ratio and a signal amplification factor over 100 were obtained [36].
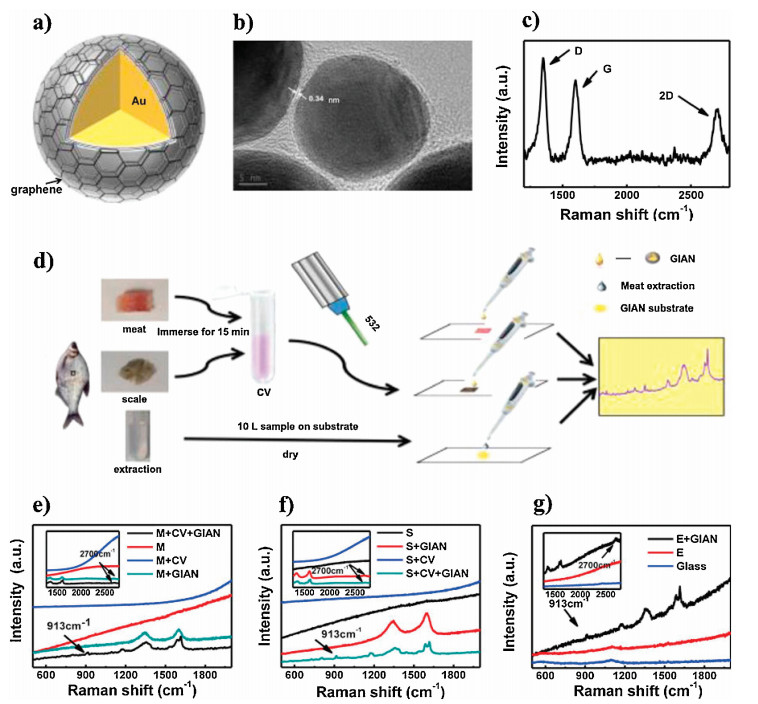
One of the most significant barriers to SERS is quantification since the SERS signal being predominantly contributed by the molecules in the hot spots [82]. In order to address this issue, an IS tag is usually introduced to realize the quantitative detection of analytes. Labelling a tag is complicated, uncontrolled and difficult to ensure the tagged molecules uniformly distributed on the SERS substrate, in turn resulting in unreliable and inaccurate sample quantification analysis to a certain degree. GIANs possess a simple and unique 2D Raman signal located at ~2700 cm-1, which is localized in the Raman silent region of the biomolecules with less background, making it an ideal IS for quantitative Raman analysis with quite low background interference [52]. The introduction of 2D-band as IS tag can decrease errors in detection caused by laser exposure, focusing and substrate fluctuation, as well improving quantification accuracy and effectively eliminating coexisting interferences, such as acid, base and extra protein in the detection system. The correlation coefficient was significantly improved from 0.778 to 0.996 employing GIANs as the IS for crystal violet (CV) detection with cell culture medium as the interference. To exploit the practical application performance of GIANs, SERS detection of CV within fish muscle and scale was demonstrated. CV as a widely used triphenylmethane dye in the breeding industry is carcinogenic when it accumulates in the human body through the food chain. Hence, GIANs SERS platform was employed to detect CV pre-immersed fish muscle and scale without complex extraction process. We believed GIANs were an ideal choice for accurate and reliable SERS analysis in biosamples (Fig. 1) [52].

|
Download:
|
| Fig. 1. (a) Schematic diagram of GIAN. (b) HR-TEM images of GIANs; scale bar: 5 nm. (c) Raman spectrum of GIAN under 532 nm laser irradiation. (d) Schematic illustration of CV detection on site. Raman spectra of (e) CV detection on fish muscle, (f) CV detection on fish scale and (g) extraction containing CV. M, S and E stand for fish muscle, scale and extraction, respectively. Reproduced with permission [52]. Copyright 2016, American Chemical Society. | |
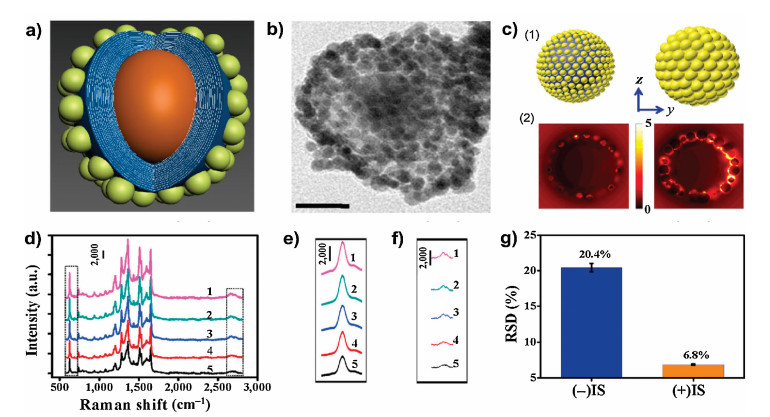
With the goal of further improving the detection sensitivity and exploring the SERS analytical potential of MGNs, a unique coreshell IS nanostructure of gold nanoparticles (AuNPs) decorated graphitic magnetic nanocapsules (abbreviated as AGNs) was developed [48]. The core-shell AGNs with a high SERS enhancement effect were obtained through adjusting gold nanoparticles assembly on the magnetic nanocapsules surface, Raman signals were significantly enhanced more than 106 times for rhodamine B (RhB). The AGNs indicated superior stability in the presence of high concentration of nitroreductase or saline solutions, and the strong 2D Raman vibration band located in the Raman silent region could act as a more ideal IS than traditional organic IS molecule of p-toluenethiol. Using RhB molecule as the detection model, a relative standard deviation was obviously decreased from 20.4% to 6.8% using the AGNs IS to minimize Raman signal variation from the testing environment. In addition, the AGNs were further applied to fabricate a paper-based SERS substrate for RhB detection down to 40 fmol. The experimental results fully illustrated the AGNs SERS platform could enhance detection sensitivity and reduce quantitative errors from collection loss and non-uniform distribution of the analytes (Fig. 2) [48].

|
Download:
|
| Fig. 2. (a) Schematic diagram of AGNs. (b)TEM image of single AGN. (c) (1) FDTD simulation models with an average diameter of 12 nm (right) and 5 nm (left); (c) (2) plots showing simulated results of electric field distribution relative to (1). (d) SERS spectra of 30 μmol/L RhB with various laser focusing depths of 5, 4, 3, 2, and 1 μm. Raman bands of (e) 618 cm-1 and (f) 2655 cm-1 zoom in (d). (g) RSD (%) calculated from (d) with and without AGN IS normalization. Reproduced with permission [48]. Copyright 2016, Springer. | |
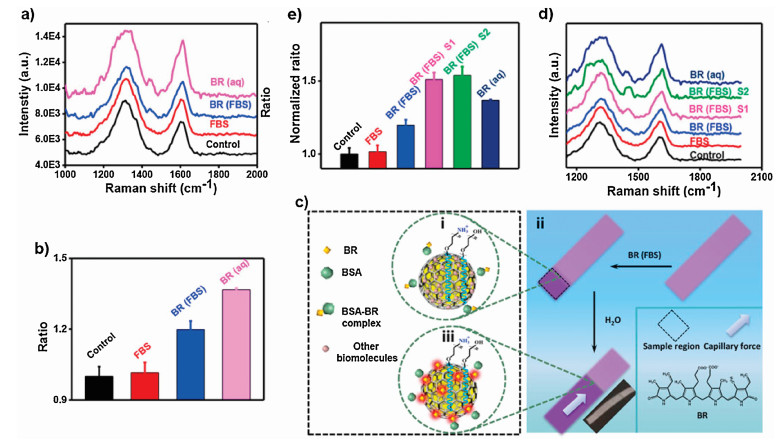
In recent years, a relative decentralized diagnostic analysis trend, so called point-of-care testing (POCT) technology, which occurs directly at patients' beds, in operating rooms or even at accident scenes, have been developed to drive healthcare forward and facilitate more predictive, efficient, personalized medical care [87-90]. Benefiting from the inherent advantages of SERS including abundant chemical fingerprint signals and high sensitivity, in combination SERS with POCT offers a new and highly promising technology platform for low-cost, rapid, sensitive diagnostic [91-93]. However, it remains challenging to suppress interference from the competing absorbent on the plasmonic surface, and meanwhile measure the desired biomarker in complex biological samples sensitively and specifically, which largely hinder the effective translation SERS technologies to POCT [94, 95]. For instance, in actual blood samples SERS analysis, the interference from coexisting biomolecules as well as target analytes could interact with serum albumin, resulting in sharply decreased detection sensitivity. Hence, an ideal SERS substrate with strong affinity to the analyte and minimizes the existing steric hindrance is urgently needed [96]. A GIANs-loaded cellulose paper strip, termed as CS@GIANs, was applied to determine free bilirubin (BR), an important biomarker for the jaundice, in newborns' serum using a portable Raman spectrometer with a 785 nm laser [97]. SERS signal from the graphitic shell of GIANs at ~1595 cm-1 was used as a stable IS for quantitative detection of BR in CH2Cl2, and the limit of detection was as low as 7 μmol/L in 1 μL sample dripped on CS@GIANs strip. With the hydrophobic graphitic shells, GIANs showed more superior ability against albumin interference and stronger affinity to BR compared with bare Ag or AuNPs, and much more obvious SERS signal was therefore observed on BR added serum than normal human serum by using the CS@GIANs strip. To further explore the clinical application potential of CS@GIANs strip, the BR values of blood serum samples from two newborn baby patients with jaundice were firstly calculated through traditional diazo method, and the sample of patient with high BR value had stronger SERS signal, indicating it held promise in the application of BR detection in complex biological samples. Significantly, the SERS signal from blood serum samples with the volume as low as 1 μL could be detected sensitivity, which could avoid a blood draw from vein and reduce the pain of newborns. Such a multifunctional cellulose SERS strip combined the high sensitivity of SERS technique, superior adsorption capability of graphene and the separation and preconcentration properties of cellulose paper, which possessed huge potential for the development of rapid, low-cost and point-of-care diagnostic in complex biofluids (Fig. 3) [97].

|
Download:
|
| Fig. 3. Detection of BR in complex biological samples with GIANs-loaded paper strip. (a) SERS spectra of CS@GIANs strip (black), CS@ GIANs strip dripped with fetal bovine serum (FBS) (red), CS@GIANs dripped with BR in the presence (blue) and absence of FBS (pink). (b) Statistical value of ratiometric intensities (I1612 - I1642)/(I1595 - I1642) with respect to (a). (c) Schematic diagram of BR detection in FBS matrix before (ⅰ) and after (ⅲ) separation; (ⅱ) The adsorption process of BR occurred on the surface of GIANs in FBS matrix. Insert image was the digital photo of CS@ GIANs dripped with BR (FBS) aqueous after separation. (d) SERS spectra of CS@GIANs (black), CS@GIANs dipped with FBS (red), CS@ GIANs dipped with BR in the FBS matrix before (blue) and after separation (pink and green for two repeated process) and preconcentration, CS@ GIANs dipped with BR aqueous. (e) Statistical value of ratiometric intensities (I1612 - I1642)/(I1595 - I1642) with respect to (d). Reproduced with permission [97]. Copyright 2018, American Chemical Society. | |
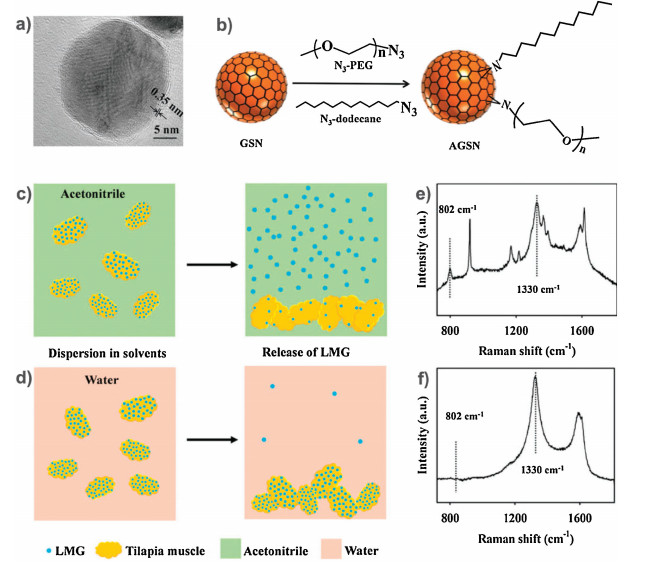
Most of the currently reported SERS substrates are only dispersible in aqueous solution, leading to huge difficulty for the detection of analytes in nonaqueous solution without evaporation and drying [98-100]. Hence, it is highly urgent to establish covalently functionalized amphiphilic SERS substratesfor accurate detection in various solvents. AuNPs have been extensively used as SERS substrates for bioanalysis owing to their strong plasmonic properties [14, 101-104]. In fact, AgNPs have larger optical cross section and lower price than AuNPs, which possess broader prospects for plasmon resonance applications [105, 106]. However, the surface of AgNPs is prone to form silver oxide or silver sulfide layer when exposed in environmental O2 or H2S molecules, which could hinder the SERS capacity and limit their extensive applications [107-109]. Like GIANs, encapsulating the silver nanocrystals within inert graphitic shells will protect the silver core from the harsh external environment. Herein, superstable GSNs structurally consisted of an AgCu alloy core encapsulated in a graphitic shell were firstly prepared through a facile CVD method, then amphiphilic graphitic silver nanoparticles (AGSNs) were obtained by covalently modifying the GSNs with both hydrophilic N3-PEG and lipophilic N3-dodecane for reliable quantitative SERS analysis in diverse liquids [44]. No obvious variations were observed on the UV-vis spectroscopy and Raman spectra of AGSNs treated with high concentration of different aqueous solution, which ensured remarkable SERS-enhancing capability from the AgCu alloy core and stable IS Raman signals from the graphitic shell. Besides, the modified azides could enhance the dispersity in various kinds of solvents, which made AGSNs as ideal substrate for reliable quantitative SERS analysis in different solutions without evaporation and drying. As we know, the carcinogenic malachitegreen (MG) has beenforbidden in many countries, but it is still used as fungicide and insecticide in certain fish farms. Most of the MG in fish body can be metabolized to leucomalachite green (LMG), which is insoluble in water but soluble in acetonitrile [110]. The MG in water and LMG in acetonitrile were firstly measured quantitatively using the AGSNs as the SERS substrate and the D-band as IS to calibrate the inaccuracy. To prove the huge potential of AGSNs as IS SERS substrates for the practical Raman analysis in different solutions, LMG in tilapia muscle was selected as the detection model. LMGcontaminated tilapia muscle was washed with water and acetonitrile to release the LMG molecules, respectively, almost no Raman signal was detected in water, while strong SERS peaks were observed on LMG dispersed in acetonitrile. The experimental results fully illustrated such highly stable AGSNs exhibited huge potential in different SERS bioanalytical applications (Fig. 4) [44].

|
Download:
|
| Fig. 4. (a) TEM image of single GSN. (b) Schematic illustration of AGSNs. SERS detection of LMG in contaminated fish muscle washed with different solvents: (c) using acetonitrile as dispersion solvent and (d) using water as dispersion solvent.Raman spectra of AGSN mixed LMG released from contaminated fish into acetonitrile (e) and water (f). Reproduced with permission [44]. Copyright 2018, Royal Society of Chemistry. | |
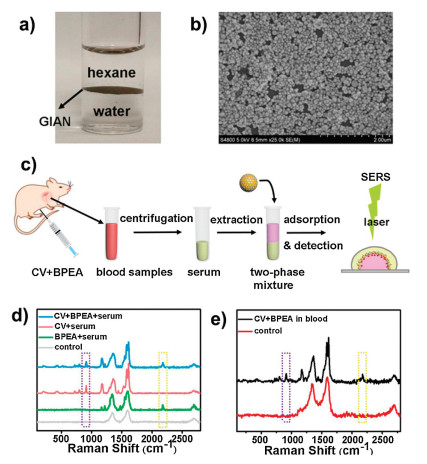
It is of great practical significance to propose effective method for simultaneous multiphase detection of multiplex analytes, especially in the pharmaceutical field, because lipid- and watersoluble drugs are commonly administrated together for synergistic therapy [111, 112]. SERS technique provides a good platform for label-free and sensitive method for multiphase interfaces analysis. It is reported that some self-assembled nanoparticle substrates with high signal enhancement effect and minimized nanogaps between particles have been developed for SERS multiphase analysis [113-115]. Nevertheless, multiphase interfacial selfassembly usually requires the help of salts or inducers for structural aggregation, or surfactant surface modification of the nanoparticles to decrease the Coulomb repulsion [116-119], which restricts extensive SERS applications. Herein, we developed a GIANs-based multiphase analysis system, in which GIANs as SERS substrate spontaneously assembled at the interface of different phases without the addition of any surfactant [74]. Target molecules could approach GIANs easily because they were not modified, and the graphitic shell of GIANs with large surface area and unique π-π electrostatic stacking interaction was available for the adsorption of aromatic compounds effectively. For proof of concept, lipid-soluble 9, 10-bis(phenylethynyl)anthracene (BPEA) and water-soluble CV were dispersed in hexane and water phases for analysis. With the addition of GIANs, the UV-vis absorption peaks at different positions of both BPEA in hexane and CV in water reduced sharply, which was due to the good adsorption performance of the two-phase interface self-assembled GIANs SERS substrate. Some other analytes including R6 G, iron phthalocyanine and methylene blue were also tested, illustrating the GIANs SERS substrate had superior simultaneous multiphase SERS analysis performance for diverse targets. In addition, the 2D Raman peak of GIANs at around 2700 cm-1 was utilized as IS to improve the accuracy and reproducibility of interfacial SERS quantitative analysis for BPEA and CV. Based on drugs with different solubility were usually administrated to better achieve disease treatment, GIANs SERS substrate was applied to mimic the simultaneous analysis of lipid- and water-soluble drugs in blood samples. BPEA and CV were selected as the model molecules to mimic the drugs with water and lipid solubility. The detection limit of about 10-7 mol/L was obtained for both of them in spiked serum samples. To further explore the ex vivo practical application performance of the versatile GIANs SERS substrate, blood samples were collected from the heart of ALB/c mice after intraperitoneal injection with both CV and BPEA for 10 min, the experimental results indicated both of them were simultaneously detected. We drawed a conclusion that the liquid-liquid interface suspended GIANs SERS substrate demonstrated superior simultaneous multiphase enrichment and quantitative detection capabilities even in a complex system (Fig. 5) [74].

|
Download:
|
| Fig. 5. (a) Photograph of assembled GIANs film at the hexane-water interface. (b) SEM image of interfacial GIANs substrate. (c) Schematic illustration of Raman analysis of CV and BPEA in mice. (d) Simultaneous determination of CV and BPEA in spiked serum sample. (e) Blood analysis of mice injected with CV and BPEA (black line). Control mice (red line) were injected with the same volume of corresponding solvent. The Raman signal in the violet box located at 913 cm-1 is attributed to CV, and the 2180 cm-1 Raman signal in the yellow box belongs to BPEA. Reproduced with permission [74]. Copyright 2018, American Chemical Society. | |
4. Metal graphitic nanocapsules for SERS imaging
It is crucial to provide extra evidence and experimental data for validating the accuracy of bioanalysis and providing multiparameter information, especially in accurate diagnosis of diseases [120]. Optical imaging techniques have received special attention for bioimaging applications owing to their unique features of excellent sensitivity, high specificity, and operational ease [121-123]. Although fluorescence-based imaging modalities are widely employed in bioanalytical applications, they suffer from significant limitations including small Stokes shift, broad fluorescence band, photobleaching of labels, poor chemical selectivity, phototoxicity and so forth [124]. Since the first SERS imaging of tissue by the Schlücker group [125], a great deal of efforts have been devoted to fabricating nanostructures with the capacity of dual imaging or multi-imaging. SERS imaging is the separation of the Raman scattered photons corresponding to the characteristic signal from the SERS spectrum of a particular analyte, exhibiting great potential to unravel the spatial distribution of a particular type of analyte in a heterogeneous environment [126, 127]. However, the critical issue limiting Raman detection limits Raman imaging as well, that is the commonly used SERS substrates of Au, Ag or Cu are necessary, but sensitive to external environments such as in an extracellular or interstitial milieu, resulting in inaccuracy and poor reproducibility of SERS imaging [31]. Introducing graphitic nanomaterials as a protectant is a good way to address this dilemma as possible. Our group has been committed to preparing versatile MGNs with a metal or metal alloy core encapsulated in an inert graphitic shell, which possess numerous merits as mentioned in Section 3. This section will mainly discuss about recent advancements in SERS imaging by using the robust MGNs.
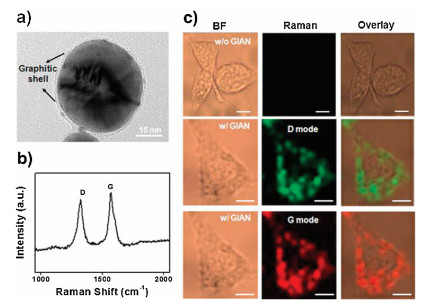
SERS imaging, which combines Raman scattering with optical imaging techniques, can obtain images of respective biomarkers based on the signals from Raman tags through scanning specific vibration peaks of Raman tags for the whole sample. Like SERS detection, an ideal substrate is indispensable for SERS imaging analysis. Gold nanocrystals show great promise in SERS imaging due to their strong plasmonic properties [128, 129], but they suffer from poor stability because of environmental erosion and interference from adsorbed biomolecules [130, 131]. On the basis of the problems above, GIANs which structurally consisted of an Au core encapsulated in a graphitic shell were rationally prepared by a simple CVD method [36]. GIANs possessed enormous Raman scattering cross sections compared to organic Raman active molecules [132] and the graphitic shells could protect the inner Au core from oxidation, powerful laser irradiation and photocarbonization, avoid unnecessary reactions catalyzed by Au core and quench the background fluorescence from external environments [52]. The graphitic shell with two Raman vibrational modes of D and G-band located at ~1325 and ~1595 cm-1, respectively, was used as a good Raman tag for cell imaging. SERS imaging of GIANs preincubated MCF-7 cells were executed, indicating both the D and G modes could be utilized to image cells and almost all the Raman signals were distributed throughout the cellular cytoplasm. Compared to the fluorescence images of MCF-7 cells, Raman images had better resolution benefiting from the narrow full width at half maximum (FWHM) of the Raman scattering peak and the stable signals from the unbleachable Raman signals of GIANs. This offered a useful tool for exploring endocytosis processes of GIANs in the cells (Fig. 6) [36].

|
Download:
|
| Fig. 6. (a) TEM image of single GIAN. (b) Raman spectrum of GIANs showing the D and G bands of graphitic carbon with a 633 nm laser excitation. (c) Raman imaging of MCF-7 cells with and without GIAN staining, respectively. BF: bright field, scale bar: 10 mm. Reproduced with permission [36]. Copyright 2014, Nature Publishing Group. | |
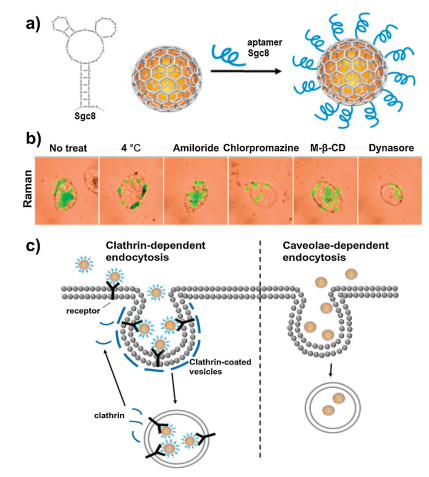
With the development of nanomedicine technology, nanomaterials are considered as efficient intracellular DNA, RNA or proteins delivery platform for ex vivo cell-based therapies, as well as a critical component of diverse fundamental research applications [133-136]. Aptamers are single-stranded DNA or RNA oligonucleotides selected by systematic evolution of ligands by exponential enrichment (SELEX) technique that can bind to the specific target molecules with high affinity by folding into distinct secondary or tertiary structures [137-140]. Benefiting from the merits of nanomedicine and the cell-targeting capabilities of aptamers, aptamer-functionalized nanoparticles have huge potential to open new perspectives for biomedical applications [141-143]. It is of great significance to unravel the endocytosis and metabolism processes of NPs for improving the diagnostic sensitivity and therapeutic efficiency. Superstable GIANs with strong and unique Raman scattering properties was demonstrated to be an ideal Raman tag for cell staining and SERS imaging [36]. The graphitic shell of GIANs could offer a robust platform for aptamers functionalization via strong π-π interactions. The cellular entry pathways of NPs with and without functionalization of Sgc8 aptamer, which selectively binds to protein tyrosine kinase 7 cell membrane proteins, were therefore investigated systematically through SERS imaging. The experimental results illustrated that GIANs entered the HeLa cells via the caveolae-mediated endocytosis pathway, while the Sgc8 aptamer functionalized GIANs were taken up by the cells via a clathrin-mediated endocytosis process during which the nanoparticles firstly bind to a cell surface receptor, followed by internalization of NPs through invagination of the cell membrane. Significantly, such a GIAN-based SERS imaging study may also facilitate the development of nanocarriers with receptor targeting for efficient drug delivery and cancer therapeutics (Fig. 7) [36].

|
Download:
|
| Fig. 7. (a) Schematic illustration of a Sgc8 aptamer and Sgc8 aptamer-functionalized GIAN. (b) Raman images of inhibitor-pretreated HeLa cells incubated with Sgc8-functionalized GIANs. (c) Model of the cellular endocytosis of the GIANs and Sgc8-GIAN complex, respectively. Reproduced with permission [36]. Copyright 2016, Royal Society of Chemistry. | |
Although GIANs with strong and unique Raman scattering properties showed great promise for cell staining and SERS imaging [48, 72], we have never stopped to modulate the morphology of gold graphitic nanostructures with higher Raman signal enhancement for extensive applications. Gold nanorods (AuNRs) have been aroused widespread attention in biomedicine owing to their tunable localized surface plasmon resonance (LSPR) effect [144-149]. Hence, AuNRs-encapsulated graphitic nanocapsules (AuNRs@G) were prepared by employing a confinement growth method, which demonstrated superior morphological stability and better plasmon resonance with near infrared (NIR) laser excitation comparing to AuNPs-encapsulated graphitic nanocapsules (Au@G) [42]. The longitudinal plasmon modes of AuNRs@G were resonant at the NIR region where the absorption of biological molecules and water was minimized. Both D and G bands of AuNRs@G were used for cellular Raman imaging. The AuNRs core strongly enhanced the Raman signal of the graphitic shell and clearly illuminating the MCF-7 cells with a 633 nm laser even with integration time as short as 0.01 s. The intensity of Raman images of AuNRs@G-stained MCF-7 cells was much higher than that of Au@G-stained MCF-7 cells under the same conditions. Based on the SYL3C aptamer could specifically recognize some human cancer cells derived from breast, colorectal, and gastric cancers with overexpressed epithelial cell adhesion molecule (EpCAM), SYL3C aptamer-functionalized AuNRs@G nanocapsules were finally used for targeted Raman imaging. The breast cancer tissue sample with overexpressed EpCAM showed bright Raman intensities, while the normal liver tissue sample exhibited negligible imaging signals. The results fully demonstrated the AuNRs@G had great potential in targeted imaging and diagnostics (Fig. 8) [42].

|
Download:
|
| Fig. 8. (a) TEM and (b) HR-TEM image of AuNRs@G. FDTD simulated electromagnetic field distributions of (c) Au@G and (d) AuNRs@G under excitation of 633 nm laser. (e) Schematic illustration of AuNRs@G and aptamer-functionalized AuNRs@G preparation process and uptake process by cells, respectively. (f) Rapid Raman mapping images of MCF-7 cell with and without AuNRs@G staining with 0.01 and 1 s integration/pixel. BF, bright-field; scale bar: 10 μm. (g) Targeted Raman imaging of cancerous breast and normal liver tissues of rat treated with aptamer-AuNRs@G nanocapsules at room temperature for 40 min with 1 s integration time per pixel. BF, bright-field; scale bar: 10 μm. Reproduced with permission [42]. Copyright 2016, American Chemical Society. | |
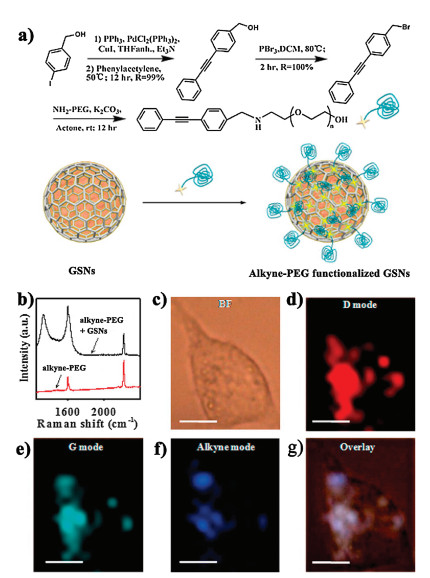
GSNs with superior stability in harsh conditions were used as an ideal SERS substrate for reliable SERS quantitative biodetection [44]. GSNs also showed good performance to be a good Raman tag for imaging cells and tissues [47]. Both D and G bands of GSNs were used to image MCF-7 cells. One Raman image was acquired in a few seconds employing the global imaging mode based on strong Raman scattering of GSNs. Aptamer-functionalized ACGs were further used to improve the selectivity, exhibiting good targeting imaging for cells and tissues. Significantly, the Raman signals in the cells had better spatial resolution compared with fluorescence imaging due to narrow FWHM of Raman peaks and the unbleached Raman signals, which indicated GSNs could be a useful tool for monitoring endocytosis processes. However, the D and G bands with signals located at the fingerprint region (500-1800 cm-1) [150, 151] where the intrinsic components of cells also have strong Raman signals, the signals are probably overlapped with those from the intrinsic counterparts of the cells, which seriously limited sensitivity of the GSNs-based SERS imaging process. Based on the similar issue, researches have been developed some newly optical interference free Raman reporters with strong vibration in the Raman-silent region of the cell (1800-2800 cm-1) [152, 153], which help to image the biological processes more specifically without any hindrance from cellular background signals, including deuterium, alkyne, cyano, azide, and metal carbonyls [154, 155]. Hence, alkyne-PEG-functionalized GSNs in which alkyne possessed a strong vibration at ~2220 cm-1 were further utilized to perform Raman-silent region SERS imaging of MCF-7 cells, indicating superior intracellular localization capability of the functionalized GSNs from strong Raman signals of D, G, and alkyne bands in high-resolution Raman images (Fig. 9) [47].

|
Download:
|
| Fig. 9. (a) Synthesis procedure of alkyne-PEG and alkyne-PEG functionalized GSNs. (b) Raman spectra of alkyne-PEG (black curve) and alkyne-PEG functionalized GSNs (red curve). (c–g) SERS imaging of MCF-7 cells treated with alkyne-PEG functionalized GSNs using 1 s integration per pixel. BF, bright field; scale bar: 10 μm. Reproduced with permission [47]. Copyright 2014, American Chemical Society. | |
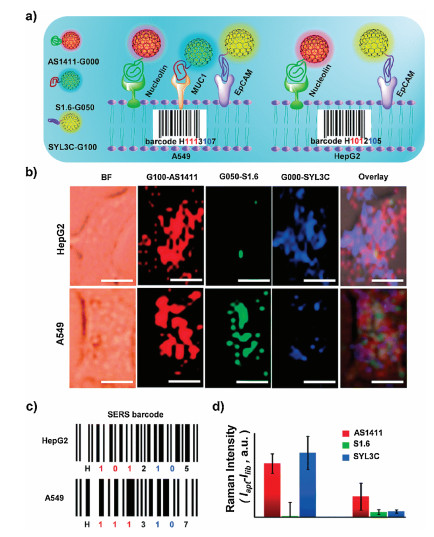
Multiplexed molecular recognition is required in accurate cancer diagnostics, but still insufficient to discriminate among cancer cell types. Therefore, technologies must be capable of molecular recognition, and possess a built-in pattern recognition component for efficient imaging and discrimination of targeted cancer cells [156-158]. SERS tags hold great promise for accurate and efficient cancer cell recognition due to their ultra-narrow Raman scattering peak and ultrasensitive optical properties [159-161]. However, traditional SERS tags have low photostability under long laser exposure duration and complex fingerprint spectra, leading to huge difficulty in data analysis. GIANs with superior stability, strong Raman scattering properties and simple fingerprint spectrum was demonstrated to be an efficient Raman tag for SERS imaging applications. Based on that, five GIAN multiplexed tags with obviously different shift of the strong 2D-band located in the cellular Raman silent region were synthesized by simply introducing different fraction of isotopic compositions of C12 and C13 in the CVD system [43]. Compared with some other organic Raman tags, such isotopic GIAN tags had highly stable optical properties and free from interference of different conditions, revealing the accurate SERS imaging potential both in vivo and in vitro. Moreover, feasibility of SERS-encoded isotopic cellular Raman-silent GIANs-based multiplexed bioimaging in vivo was further studied with C. elegans as the model. The results showed different organs were visualized simultaneously and clearly, which further proved the isotopic GIANs possessed multiplexed SERS imaging capabilities in vivo. Based on the superior multiplexed SERS imaging capabilities in complex biosystems, SERS-encoded isotopic cellular Raman-silent GIANs-based multiplexed tags were further conjugated with phospholipid-polyethylene glycol-linked aptamers to target proteins overexpressed on the cancer cell membrane for rapid imaging and pattern recognition of HepG2 and A549 cell lines. In brief, such isotopic GIAN-aptamer-encoders exhibited great promise for cancer cell identification with high sensitivity and low background interference, providing a novel and valuable tool for biomedical applications in the future (Fig. 10) [43].

|
Download:
|
| Fig. 10. (a) Schematic illustration of pattern recognition and discrimination of cancer cell lines with multiplexed GIAN-encoders. (b) SERS images of cancer cells, scale bar: 10 mm. G100, G050 and G000 conjugated with DSPE-PEG-linked aptamer AS1411, S1.6 and SYL3C, respectively. (c) SERS barcodes of HepG2 and A549 cell lines. (d) Statistics of normalized SERS signals shown in (b). Copied with permission [43]. Copyright 2018, Royal Society of Chemistry. | |
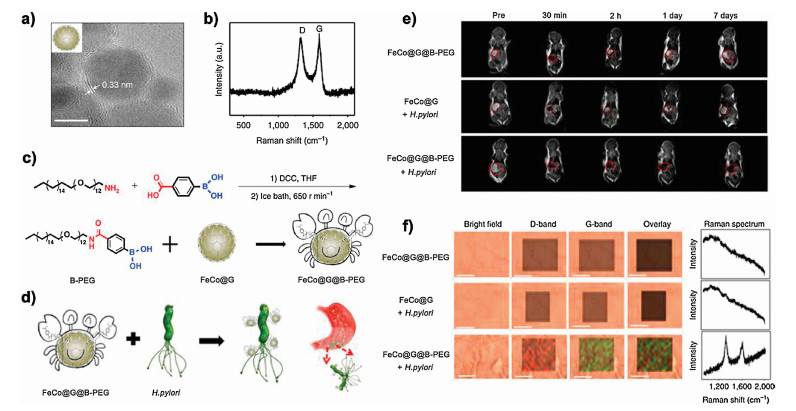
Almost all the Raman imaging researches are executed with the help of plasmonically active nanoparticles [14, 162, 163]. Some nonplasmonically active nanomaterials-based Raman imaging can be used as an auxiliary mean for the diagnosis or treatment of diseases. Benefiting from the superior stability and unique optical performance of the versatile MGNs, superstable FeCo@G was prepared and used for in situ targeted detection of H. pylori, a pathogen related with gastric disease [73]. The graphitic shell effectively protected the magnetic core from corrosion while retaining the superior contrast effect for MRI in the gastric environment. In the H. pylori-infected mouse model, H. pylori was specifically detected through T2-weighted MRI using boronicpolyethylene glycol (B-PEG) molecules modified FeCo@G (FeCo@G@B-PEG). In addition, the mice were killed and D-, Gband of the FeCo@G were used for Raman imaging of their gastric tissue, the obvious Raman signals could be easily identified in the H. pylori-infected gastric mucosa treated with FeCo@G@B-PEG, which further confirmed the targeted detection of H. pylori in vivo (Fig. 11) [73].

|
Download:
|
| Fig. 11. (a) HR-TEM images of ~7 nm FeCo@G. Scale bar: 5 nm. (b) Raman spectrum of FeCo@G (excitation 633 nm). (c) Synthesis process of FeCo@G@B-PEG functionalization. (d) Schematic illustration of H. pylori detection using FeCo@G@B-PEG. (e) T2-weighted images at different times with or without FeCo@G@B-PEG treatments. (f) Raman images and spectra of mice gastric mucosa used in (e). Scale bar: 10 mm; slice thickness: 50 mm. Reproduced with permission [73]. Copyright 2017, Nature Publishing Group. | |
5. Conclusions and outlooks
In this feature article, we systematically summarized the versatile MGNs used for SERS biodetection and bioimaging applications. As a kind of graphitic nanomaterials, MGNs possess much larger Raman scattering cross sections compared to other organic Raman-active molecules. Protecting by the inert graphitic shell, MGNs are able to resist erosion from hash conditions and even avoid unnecessary reactions catalyzed by inner metal core. The graphitic shell with several characteristic Raman bands itself can act as Raman signal probe or IS, especially the 2D-band within the Raman-silent region of the cell can reduce the interference signals from external environments. Moreover, the graphitic shell can quench the background fluorescence interference from external environments and can be modified with hydrophilic or hydrophobic groups to meet the requirements for SERS analysis in complex systems. Overall, the versatile MGNs possess huge potential for reliable SERS bioanalysis due to their outstanding merits above. We expect that more robust MGNs with controllable optical properties will be available, which will then further advance applications of these SERS-active graphitic nanomaterials in biomedical diagnosis and therapy.
AcknowledgmentsThis work was financially supported by the National Natural Science Foundation of China (No. 21522501), Hunan Provincial Natural Science Foundation of China (No. 2018JJ1007), Science and Technology Development Fund, Macau (No. 196/2017/A3).
| [1] |
Y.W. Wang, Y.L. Liu, J.Q. Xu, et al., Anal. Chem. 90 (2018) 5977-5981. DOI:10.1021/acs.analchem.8b01396 |
| [2] |
L. Li, Q. Li, Z. Liao, et al., Anal. Chem. 90 (2018) 9621-9628. DOI:10.1021/acs.analchem.8b02572 |
| [3] |
S.K. Li, A.Y. Chen, X.X. Niu, et al., Chem. Commun. 53 (2017) 9624-9627. DOI:10.1039/C7CC04747A |
| [4] |
J. Yan, M.C. Estévez, J.E. Smith, et al., Nano Today 2 (2007) 44-50. |
| [5] |
I. Lovchinsky, A.O. Sushkov, E. Urbach, et al., Science 351 (2016) 836-841. DOI:10.1126/science.aad8022 |
| [6] |
C. Zhang, N.E. Manicke, Anal. Chem. 87 (2015) 6212-6219. DOI:10.1021/acs.analchem.5b00884 |
| [7] |
Y. Lv, M. Liu, Y. Zhang, et al., ACS Nano 12 (2018) 1350-1358. DOI:10.1021/acsnano.7b07716 |
| [8] |
X. Zhen, J. Zhang, J. Huang, et al., Angew. Chem. Int. Ed. 57 (2018) 7804-7808. DOI:10.1002/anie.201803321 |
| [9] |
C.V. Raman, K.S. Krishnan, Nature 121 (1928) 501-502. |
| [10] |
C.V. Raman, Indian J. Phys. 2 (1928) 387-398. |
| [11] |
K. Kneipp, H. Kneipp, I. Itzkan, et al., Chem. Rev. 99 (1999) 2957-2976. DOI:10.1021/cr980133r |
| [12] |
L.M. Malard, M.A.A. Pimenta, G. Dresselhaus, et al., Phys. Rep. 473 (2009) 51-87. DOI:10.1016/j.physrep.2009.02.003 |
| [13] |
J. Yang, L. Xia, Z. Lin, et al., Chin. Chem. Lett. 30 (2019) 638-642. DOI:10.1016/j.cclet.2018.08.004 |
| [14] |
S. Pang, T. Yang, L. He, TrAC-Trend Anal. Chem. 85 (2016) 73-82. DOI:10.1016/j.trac.2016.06.017 |
| [15] |
X. Yin, H. Dong, S. Wang, et al., Chin. Chem. Lett. 30 (2019) 179-182. DOI:10.1016/j.cclet.2018.06.013 |
| [16] |
J.P. Camden, J.A. Dieringer, Y. Wang, et al., J. Am. Chem. Soc. 130 (2008) 12616-12617. DOI:10.1021/ja8051427 |
| [17] |
M.M. Joseph, N. Narayanan, J.B. Nair, et al., Biomaterials 181 (2018) 140-181. DOI:10.1016/j.biomaterials.2018.07.045 |
| [18] |
Z.Q. Tian, B. Ren, J.F. Li, et al., Chem. Commun. (2007) 3514-3534. |
| [19] |
M. Fleischmann, P.J.A. Hendra, J. Chem. Phys. Lett. 26 (1974) 163-166. DOI:10.1016/0009-2614(74)85388-1 |
| [20] |
K. Kneipp, Y. Wang, H. Kneipp, et al., Phys. Rev. Lett. 78 (1997) 1667-1670. DOI:10.1103/PhysRevLett.78.1667 |
| [21] |
K. Kneipp, H. Kneipp, V.B. Kartha, et al., Phys. Rev. E 57 (1998) R6281. DOI:10.1103/PhysRevE.57.R6281 |
| [22] |
J. Kneipp, H. Kneipp, K. Kneipp, Chem. Soc. Rev. 37 (2008) 1052-1060. DOI:10.1039/b708459p |
| [23] |
D.K. Lim, K.S. Jeon, H.M. Kim, et al., Nat. Mater. 9 (2010) 60-67. DOI:10.1038/nmat2596 |
| [24] |
D. Cialla-May, X.S. Zheng, K. Weber, et al., Chem. Soc. Rev. 46 (2017) 3945-3961. DOI:10.1039/C7CS00172J |
| [25] |
S. Nie, S.R. Emory, Science 275 (1997) 1102-1106. DOI:10.1126/science.275.5303.1102 |
| [26] |
M.S. Strozyk, D.J. de Aberasturi, J.V. Gregory, et al., Adv. Funct. Mater. 27 (2017) 1701626. DOI:10.1002/adfm.201701626 |
| [27] |
S. Schluecker, Angew. Chem. Int. Ed. 53 (2014) 4756-4795. DOI:10.1002/anie.201205748 |
| [28] |
G. McNay, D. Eustace, W.E. Smith, et al., Appl. Spectrosc. 65 (2011) 825-837. DOI:10.1366/11-06365 |
| [29] |
J.F. Li, Y.J. Zhang, S.Y. Ding, et al., Chem. Rev. 117 (2017) 5002-5069. DOI:10.1021/acs.chemrev.6b00596 |
| [30] |
M. Vendrell, K.K. Maiti, K. Dhaliwal, et al., Trends Biotechnol. 31 (2013) 249-257. DOI:10.1016/j.tibtech.2013.01.013 |
| [31] |
D. Ding, Y. Xu, Y. Zou, et al., Nanoscale 9 (2017) 10529-10543. DOI:10.1039/C7NR02587D |
| [32] |
J. Gao, N. Zhang, D. Ji, Song, et al., Small Methods 2 (2018) 1800045. |
| [33] |
M.F. Cardinal, E. Vander Ende, R.A. Hackler, et al., Chem. Soc. Rev. 46 (2017) 3886-3903. DOI:10.1039/C7CS00207F |
| [34] |
X.M. Lin, Y. Cui, Y.H. Xu, et al., Anal. Bioanal. Chem. 394 (2009) 1729-1745. DOI:10.1007/s00216-009-2761-5 |
| [35] |
J.F. Li, J.R. Anema, T. Wandlowski, et al., Chem. Soc. Rev. 44 (2015) 8399-8409. DOI:10.1039/C5CS00501A |
| [36] |
X. Bian, Z.L. Song, Y. Qian, et al., Sci. Rep. 4 (2014) 6093. |
| [37] |
E. Bailo, V. Deckert, Chem. Soc. Rev. 37 (2008) 921-930. DOI:10.1039/b705967c |
| [38] |
J. Steidtner, B. Pettinger, Phys. Rev. Lett. 100 (2008) 236101. DOI:10.1103/PhysRevLett.100.236101 |
| [39] |
J.F. Li, Y.F. Huang, Y. Ding, et al., Nature 464 (2010) 392-395. DOI:10.1038/nature08907 |
| [40] |
J.F. Li, X.D. Tian, S.B. Li, et al., Nature Protoc. 8 (2013) 52-65. DOI:10.1038/nprot.2012.141 |
| [41] |
J.R. Anema, J.F. Li, Z.L. Yang, et al., Annu. Rev. Anal. Chem. 4 (2011) 129-150. DOI:10.1146/annurev.anchem.111808.073632 |
| [42] |
X.F. Lai, Y.X. Zou, S.S. Wang, et al., Anal. Chem. 88 (2016) 5385-5391. DOI:10.1021/acs.analchem.6b00714 |
| [43] |
Y. Zou, S. Huang, Y. Liao, et al., Chem. Sci. 9 (2018) 2842-2849. DOI:10.1039/C7SC05442D |
| [44] |
Z.L. Song, X. Dai, M. Li, et al., Chem. Commun. 54 (2018) 8618-8621. DOI:10.1039/C8CC04388D |
| [45] |
W. Gao, X. Wang, H. Fan, et al., Sci. Bull. 60 (2015) 1101-1107. DOI:10.1007/s11434-015-0814-z |
| [46] |
F. Liu, L. Zhang, Q. Dong, et al., Acta Phys.-Chim. Sin. 35 (2019) 651-656. |
| [47] |
Z.L. Song, Z. Chen, X. Bian, et al., J. Am. Chem. Soc. 136 (2014) 13558-13561. DOI:10.1021/ja507368z |
| [48] |
Y. Zou, L. Chen, Z. Song, et al., Nano Res. 9 (2016) 1418-1425. DOI:10.1007/s12274-016-1037-6 |
| [49] |
R. Goodacre, D. Graham, K. Faulds, TrAC-Trends Anal. Chem. 102 (2018) 359-368. DOI:10.1016/j.trac.2018.03.005 |
| [50] |
S.E. Bell, N.M. Sirimuthu, Chem. Soc. Rev. 37 (2008) 1012-1024. DOI:10.1039/b705965p |
| [51] |
W. Shen, X. Lin, C. Jiang, et al., Angew. Chem. Int. Ed. 54 (2015) 7308-7312. DOI:10.1002/anie.201502171 |
| [52] |
Y. Zhang, Y. Zou, F. Liu, et al., Anal. Chem. 88 (2016) 10611-10616. DOI:10.1021/acs.analchem.6b02958 |
| [53] |
Y. Tu, P. Ren, D. Deng, et al., Nano Energy 52 (2018) 494-500. DOI:10.1016/j.nanoen.2018.07.062 |
| [54] |
M. Li, W. Wang, Z. Chen, et al., Sens. Actuators B-Chem. 260 (2018) 778-785. DOI:10.1016/j.snb.2018.01.093 |
| [55] |
X.W. Wang, W. Gao, H.H. Fan, et al., Nanoscale 8 (2016) 7942-7948. DOI:10.1039/C6NR00369A |
| [56] |
X.K. Nie, Y.T. Xu, Z.L. Song, et al., Nanoscale 6 (2014) 13097-13103. DOI:10.1039/C4NR03837A |
| [57] |
H. Rydberg, M. Dion, N. Jacobson, et al., Phys. Rev. Lett. 91 (2003) 126402. DOI:10.1103/PhysRevLett.91.126402 |
| [58] |
P.L. De Andres, R. Ramírez, J.A. Vergés, Phy. Rev. B 77 (2008) 045403. DOI:10.1103/PhysRevB.77.045403 |
| [59] |
S. Sadhasivam, S. Savitha, C.J. Wu, et al., Int. J. Pharm. 480 (2015) 8-14. DOI:10.1016/j.ijpharm.2015.01.029 |
| [60] |
M. Bystrzejewski, S. Cudzilo, A. Huczko, et al., Biomol. Eng. 24 (2007) 555-558. DOI:10.1016/j.bioeng.2007.08.006 |
| [61] |
X.M. Sun, Y.D. Li, Angew. Chem. Int. Ed. 43 (2004) 597-601. DOI:10.1002/anie.200352386 |
| [62] |
Y. Han, P. Li, Y. Xu, et al., Small 11 (2015) 877-885. DOI:10.1002/smll.201401989 |
| [63] |
Y. Liu, Y. Hu, J. Zhang, J. Phys. Chem. C 118 (2014) 8993-8998. DOI:10.1021/jp500751a |
| [64] |
D. Ding, Z.L. Song, Z.Q. Cheng, et al., J. Mater. Chem. A 2 (2014) 472-477. DOI:10.1039/C3TA14054G |
| [65] |
K.A.I. Yan, L.E.I. Fu, H. Peng, et al., Acc. Chem. Res. 46 (2013) 2263-2274. DOI:10.1021/ar400057n |
| [66] |
Z. Yan, Z. Peng, J.M. Tour, Acc. Chem. Res. 47 (2014) 1327-1337. DOI:10.1021/ar4003043 |
| [67] |
H.C. Lee, W.W. Liu, S.P. Chai, et al., Procedia Chem. 19 (2016) 916-921. DOI:10.1016/j.proche.2016.03.135 |
| [68] |
X. Li, W. Cai, J. An, et al., Science 324 (2009) 1312-1314. DOI:10.1126/science.1171245 |
| [69] |
Y.T. Xu, L. Chen, Z. Chen, Acta Phys.-Chim. Sin. 33 (2017) 28-39. |
| [70] |
W.S. Seo, J.H. Lee, X. Sun, et al., Nat. Mater. 5 (2006) 971-976. DOI:10.1038/nmat1775 |
| [71] |
Z.L. Song, X.H. Zhao, W.N. Liu, et al., Small 9 (2013) 951-957. DOI:10.1002/smll.201201975 |
| [72] |
S. Wang, Z. Liu, Y. Zou, et al., Analyst 141 (2016) 3337-3342. DOI:10.1039/C6AN00483K |
| [73] |
Y. Li, X. Hu, D. Ding, et al., Nat. Commun. 8 (2017) 15653. DOI:10.1038/ncomms15653 |
| [74] |
L. Zhang, F. Liu, Y. Zou, et al., Anal. Chem. 90 (2018) 11183-11187. DOI:10.1021/acs.analchem.8b03040 |
| [75] |
J.R. Baena, B. Lendl, Curr. Opin. Chem. Biol. 8 (2004) 534-539. DOI:10.1016/j.cbpa.2004.08.014 |
| [76] |
Y.F. Huang, H.P. Zhu, G.K. Liu, et al., J. Am. Chem. Soc. 132 (2010) 9244-9246. DOI:10.1021/ja101107z |
| [77] |
H. Zhang, L. Sun, Y. Zhang, et al., Chin. Chem. Lett. 29 (2018) 981-984. DOI:10.1016/j.cclet.2017.10.017 |
| [78] |
D. Graham, R. Goodacre, Chem. Soc. Rev. 37 (2008) 883-884. DOI:10.1039/b804297g |
| [79] |
Y. Wang, B. Yan, L. Chen, Chem. Rev. 113 (2012) 1391-1428. |
| [80] |
M.M. Harper, K.S. McKeating, K. Faulds, Phys. Chem. Chem. Phys. 15 (2013) 5312-5328. DOI:10.1039/c2cp43859c |
| [81] |
H. Lei, Y. Hu, G. Li, Chin. Chem. Lett. 29 (2018) 509-512. DOI:10.1016/j.cclet.2017.08.012 |
| [82] |
C. Zong, M. Xu, L.J. Xu, et al., Chem. Rev. 118 (2018) 4946-4980. DOI:10.1021/acs.chemrev.7b00668 |
| [83] |
P. Mosier-Boss, Nanomaterials 7 (2017) 142. DOI:10.3390/nano7060142 |
| [84] |
B. Dong, Y. Fang, X. Chen, et al., Langmuir 27 (2011) 10677-10682. DOI:10.1021/la2018538 |
| [85] |
K. Liu, Y. Bai, L. Zhang, et al., Nano Lett. 16 (2016) 3675-3681. DOI:10.1021/acs.nanolett.6b00868 |
| [86] |
Z. Yin, Y. Wang, C. Song, et al., J. Am. Chem. Soc. 140 (2018) 864-867. DOI:10.1021/jacs.7b11293 |
| [87] |
P.B. Luppa, C. Müller, A. Schlichtiger, et al., TrAC-Trends Anal. Chem. 30 (2011) 887-898. DOI:10.1016/j.trac.2011.01.019 |
| [88] |
V. Gubala, L.F. Harris, A.J. Ricco, et al., Anal. Chem. 84 (2012) 487-515. DOI:10.1021/ac2030199 |
| [89] |
S.K. Vashist, P.B. Luppa, L.Y. Yeo, et al., Trends Biotechnol. 33 (2015) 692-705. DOI:10.1016/j.tibtech.2015.09.001 |
| [90] |
S. Wang, T. Chinnasamy, M.A. Lifson, et al., TrendsBiotechnol. 34 (2016) 909-921. |
| [91] |
V. Tran, B. Walkenfort, M. König, et al., Angew. Chem. Int. Ed. 58 (2019) 442-446. DOI:10.1002/anie.201810917 |
| [92] |
O.J.R. Clarke, B.L. Goodall, H.P. Hui, et al., Anal. Chem. 89 (2017) 1405-1410. DOI:10.1021/acs.analchem.6b04710 |
| [93] |
J. Van Rie, W. Thielemans, Nanoscale 9 (2017) 8525-8554. DOI:10.1039/C7NR00400A |
| [94] |
J.H. Granger, N.E. Schlotter, A.C. Crawford, et al., Chem. Soc. Rev. 45 (2016) 3865-3882. DOI:10.1039/C5CS00828J |
| [95] |
H. Marks, M. Schechinger, J. Garza, et al., Nanophotonics 6 (2017) 681-701. |
| [96] |
P. Miškovský, D. Jancura, S. Sánchez-Cortés, et al., J. Am. Chem. Soc. 120 (1998) 6374-6379. DOI:10.1021/ja974233a |
| [97] |
Y. Zou, Y. Zhang, Y. Xu, et al., Anal. Chem. 90 (2018) 13687-13694. DOI:10.1021/acs.analchem.8b04058 |
| [98] |
L. Xie, X. Yang, Y. He, et al., ACS Appl. Mater. Interfaces 10 (2018) 15200-15206. DOI:10.1021/acsami.7b19717 |
| [99] |
D. Martín-Yerga, A. Pérez-Junquera, M.B. González-García, et al., Chem. Commun. 54 (2018) 5748-5751. DOI:10.1039/C8CC02069H |
| [100] |
P. Mao, C. Liu, G. Favraud, et al., Nat. Commun. 9 (2018) 5428. DOI:10.1038/s41467-018-07869-5 |
| [101] |
Y. Hu, H. Cheng, X. Zhao, et al., ACS Nano 11 (2017) 5558-5566. DOI:10.1021/acsnano.7b00905 |
| [102] |
C.L. Zavaleta, E. Garai, J.T. Liu, et al., Proc. Natl. Acad. Sci. U. S. A. 110 (2013) E2288-E2297. DOI:10.1073/pnas.1211309110 |
| [103] |
L. Wu, W. Wang, W. Zhang, et al., NPG Asia Mater. 10 (2018) e462. DOI:10.1038/am.2017.230 |
| [104] |
R.M. Davis, B. Kiss, D.R. Trivedi, et al., ACS Nano 12 (2018) 9669-9679. DOI:10.1021/acsnano.8b03217 |
| [105] |
S. Mondal, U. Rana, S. Malik, ACS Appl. Mater. Interfaces 7 (2015) 10457-10465. DOI:10.1021/acsami.5b01806 |
| [106] |
K.M. Mayer, J.H. Hafner, Chem. Rev. 111 (2011) 3828-3857. DOI:10.1021/cr100313v |
| [107] |
W. Cao, H.E. Elsayed-Ali, Mater. Lett. 63 (2009) 2263-2266. DOI:10.1016/j.matlet.2009.07.052 |
| [108] |
C. Levard, B.C. Reinsch, F.M. Michel, et al., Environ. Sci. Technol. 45 (2011) 5260-5266. DOI:10.1021/es2007758 |
| [109] |
S.K. Gahlaut, K. Yadav, C. Sharan, et al., Anal. Chem. 89 (2017) 13582-13588. DOI:10.1021/acs.analchem.7b04064 |
| [110] |
Y. Zhang, W. Yu, L. Pei, et al., Food Chem. 169 (2015) 80-84. DOI:10.1016/j.foodchem.2014.07.129 |
| [111] |
H.C. Shin, A.W. Alani, D.A. Rao, et al., J. Control. Release 140 (2009) 294-300. DOI:10.1016/j.jconrel.2009.04.024 |
| [112] |
Y. Fang, G. Zheng, J. Yang, et al., Angew. Chem. Int. Ed. 53 (2014) 5366-5370. DOI:10.1002/anie.201402002 |
| [113] |
M.P. Cecchini, V.A. Turek, J. Paget, et al., Nat. Mater. 12 (2013) 165-171. DOI:10.1038/nmat3488 |
| [114] |
G.C. Phan-Quang, H.K. Lee, I.Y. Phang, et al., Angew. Chem. Int. Ed. 54 (2015) 9691-9695. DOI:10.1002/anie.201504027 |
| [115] |
M. Su, X. Li, S. Zhang, et al., Anal. Chem. 91 (2019) 2288-2295. DOI:10.1021/acs.analchem.8b04893 |
| [116] |
M.P. Konrad, A.P. Doherty, S.E. Bell, Anal. Chem. 85 (2013) 6783-6789. DOI:10.1021/ac4008607 |
| [117] |
Y. Ma, H. Liu, M. Mao, et al., Anal. Chem. 88 (2016) 8145-8151. DOI:10.1021/acs.analchem.6b01884 |
| [118] |
E. Smirnov, M.D. Scanlon, D. Momotenko, et al., ACS Nano 8 (2014) 9471-9481. DOI:10.1021/nn503644v |
| [119] |
L. Tian, M. Su, F. Yu, et al., Nat. Commun. 9 (2018) 3642. DOI:10.1038/s41467-018-05920-z |
| [120] |
G. Saranya, P. Anees, M.M. Joseph, et al., Chem.-Eur. J. 23 (2017) 7191-7195. DOI:10.1002/chem.201700839 |
| [121] |
Z. Guo, S. Park, J. Yoon, et al., Chem. Soc. Rev. 43 (2014) 16-29. DOI:10.1039/C3CS60271K |
| [122] |
X. Wu, Y. Zhang, K. Takle, et al., ACS Nano 10 (2016) 1060-1066. DOI:10.1021/acsnano.5b06383 |
| [123] |
I. Martinic', S.V. Eliseeva, T.N. Nguyen, et al., J. Am. Chem. Soc. 139 (2017) 8388-8391. DOI:10.1021/jacs.7b01587 |
| [124] |
A. Sujith, T. Itoh, H. Abe, et al., Anal. Bioanal. Chem. 394 (2009) 1803-1809. DOI:10.1007/s00216-009-2883-9 |
| [125] |
S. Schlücker, B. Küstner, A. Punge, et al., J. Raman Spectrosc. 37 (2006) 719-721. DOI:10.1002/jrs.1534 |
| [126] |
A.J. Wilson, K.A. Willets, Nanomed. Nanobiotechnol. 5 (2013) 180-189. DOI:10.1002/wnan.1208 |
| [127] |
K.A. Willets, Chem. Soc. Rev. 43 (2014) 3854-3864. DOI:10.1039/C3CS60334B |
| [128] |
Z. Zhu, H. Meng, W. Liu, et al., Angew. Chem. Int. Ed. 50 (2011) 1593-1596. DOI:10.1002/anie.201005493 |
| [129] |
X. Chen, Q. Zhang, J. Li, et al., ACS Nano 12 (2018) 5646-5656. DOI:10.1021/acsnano.8b01440 |
| [130] |
F. Kim, J.H. Song, P. Yang, J. Am. Chem. Soc. 124 (2002) 14316-14317. DOI:10.1021/ja028110o |
| [131] |
O.R. Miranda, T.S. Ahmadi, J. Phys. Chem. B 109 (2005) 15724-15734. DOI:10.1021/jp0514832 |
| [132] |
Z. Chen, S.M. Tabakman, A.P. Goodwin, et al., Nat.Biotechnol. 26 (2008) 1285-1292. DOI:10.1038/nbt.1501 |
| [133] |
E.C. Dreaden, A.M. Alkilany, X. Huang, et al., Chem. Soc. Rev. 41 (2012) 2740-2779. DOI:10.1039/C1CS15237H |
| [134] |
X. Yang, M. Yang, B. Pang, et al., Chem. Rev. 115 (2015) 10410-10488. DOI:10.1021/acs.chemrev.5b00193 |
| [135] |
K. Yang, L. Feng, X. Shi, et al., Chem. Soc. Rev. 42 (2013) 530-547. DOI:10.1039/C2CS35342C |
| [136] |
M.P. Stewart, A. Sharei, X. Ding, et al., Nature 538 (2016) 183-192. DOI:10.1038/nature19764 |
| [137] |
A.D. Ellington, J.W. Szostak, Nature 346 (1990) 818-822. DOI:10.1038/346818a0 |
| [138] |
C. Tuerk, L. Gold, Science 249 (1990) 505-510. DOI:10.1126/science.2200121 |
| [139] |
S.K. Li, Z.T. Liu, J.Y. Li, et al., ACS Appl. Mater. Interfaces 10 (2018) 14483-14490. DOI:10.1021/acsami.8b02262 |
| [140] |
S.K. Li, A.Y. Chen, Y.Q. Chai, Electrochim. Acta 212 (2016) 767-774. DOI:10.1016/j.electacta.2016.07.074 |
| [141] |
H.M. Meng, H. Liu, H.L. Kuai, Chem. Soc. Rev. 45 (2016) 2583-2602. DOI:10.1039/C5CS00645G |
| [142] |
D. Ding, Y. Zhang, E.A. Sykes, et al., Nano Res. 12 (2019) 129-135. DOI:10.1007/s12274-018-2191-9 |
| [143] |
S.A. Moosavian, A. Sahebkar, Cancer Lett. 448 (2019) 144-154. DOI:10.1016/j.canlet.2019.01.045 |
| [144] |
R. Mout, D.F. Moyano, S. Rana, et al., Chem. Soc. Rev. 41 (2012) 2539-2544. DOI:10.1039/c2cs15294k |
| [145] |
J. Song, X. Yang, O. Jacobson, et al., Adv. Mater. 27 (2015) 4910-4917. DOI:10.1002/adma.201502486 |
| [146] |
Y. Liu, M. Yang, J. Zhang, et al., ACS Nano 10 (2016) 2375-2385. DOI:10.1021/acsnano.5b07172 |
| [147] |
A.K. Parchur, G. Sharma, J.M. Jagtap, et al., ACS Nano 12 (2018) 6597-6611. DOI:10.1021/acsnano.8b01424 |
| [148] |
J.Y. Zeng, M.K. Zhang, M.Y. Peng, et al., Adv. Funct. Mater. 28 (2018) 1705451. DOI:10.1002/adfm.201705451 |
| [149] |
Q. Dong, X. Wang, X. Hu, et al., Angew. Chem. Int. Ed. 57 (2018) 177-181. DOI:10.1002/anie.201709648 |
| [150] |
M. Hashimoto, T. Araki, S. Kawata, Opt. Lett. 25 (2000) 1768-1770. DOI:10.1364/OL.25.001768 |
| [151] |
B. Elumalai, A. Prakasarao, B. Ganesan, et al., J. Raman Spectrosc. 46 (2015) 84-93. DOI:10.1002/jrs.4601 |
| [152] |
J. Kneipp, H. Kneipp, K. Kneipp, Proc. Natl. Acad. Sci. U. S. A. 103 (2006) 17149-17153. DOI:10.1073/pnas.0608262103 |
| [153] |
L. Lin, X. Tian, S. Hong, et al., Angew. Chem. Int. Ed. 125 (2013) 7407-7412. DOI:10.1002/ange.201301387 |
| [154] |
Y. Yin, Q. Li, S. Ma, et al., Anal. Chem. 89 (2017) 1551-1557. DOI:10.1021/acs.analchem.6b03521 |
| [155] |
K.V. Kong, Z. Lam, W.D. Goh, et al., Angew. Chem. Int. Ed. 51 (2012) 9796-9799. DOI:10.1002/anie.201204349 |
| [156] |
E. Ly, O. Piot, A. Durlach, et al., Analyst 134 (2009) 1208-1214. DOI:10.1039/b820998g |
| [157] |
S. Bamrungsap, T. Chen, M.I. Shukoor, et al., ACS Nano 6 (2012) 3974-3981. DOI:10.1021/nn3002328 |
| [158] |
S. Rodríguez-Enríquez, S.C. Pacheco-Velázquez, J.C. Gallardo-Pérez, et al., J. Cell. Biochem. 112 (2011) 2703-2715. DOI:10.1002/jcb.23224 |
| [159] |
Z.A. Nima, M. Mahmood, Y. Xu, et al., Sci. Rep. 4 (2014) 4752. |
| [160] |
D. Craig, S. McAughtrie, J. Simpson, et al., Anal. Chem. 86 (2014) 4775-4782. DOI:10.1021/ac4038762 |
| [161] |
J. Pan, W. Chen, Y. Ma, et al., Chem. Soc. Rev. 47 (2018) 5574-5587. DOI:10.1039/C7CS00854F |
| [162] |
Y. Liu, H. Zhou, Z. Hu, et al., Biosens. Bioelectron. 94 (2017) 131-140. DOI:10.1016/j.bios.2017.02.032 |
| [163] |
S.Y. Ding, J. Yi, J.F Li, et al., Nat. Rev. Mater. 1 (2016) 16021. DOI:10.1038/natrevmats.2016.21 |