 2019, Vol. 30


In the traditional solar cell industry, the formation of front electrode is divided into two stages. First, silver paste is printed on the surface of Si wafer in parallel arrangement with 1–2 mm spacing. Second, sintering process is necessary to make electrode a good contact (ohmic contact) on Si substrates to decrease contact resistance of Si substrates and electrodes. It is reported that good ohmic contact could be obtained at high temperatures above 835 ℃ [1]. However, high temperature treatment would have some negative effects on conversion efficiency of solar cells. As we all know that the conversion efficiency of solar cells is closely associated with fill factor, short-circuit current and open-circuit voltage, where these factors, in turn, are affected by series and parallel resistance. High parallel resistance or low series resistance lead to high conversion efficiency. After sintering at high temperature, the formation of large silver crystals would result in high series resistance, and some thermal breakdown of p-n junction is inevitable [2]. Therefore, silver particles of nanostructures in silver paste is introduced to decrease the treatment temperature of front electrode.
Nanoparticles have been extensively studied in the last decade because of their unusual chemical, physics, electrical properties [3] and potential applications in magnetic recording [4, 5] or electrodes [6]. More importantly, nanoparticles can exhibit high surfaceto-volume ratio properties, which are not apparent in bulk materials [7]. It is important that melting temperature reduced by decreasing size of silver nanoparticles has been proven in previous work [8]. In Keunju et al.'s work, silver paste composed of nanoparticles, Pb-free frit and organic vehicle were screen printed on alumina substrates and sintered at temperatures ranging from 250 ℃ to 450 ℃, and the densification of nanoparticles took place at the sintering temperature of 400 ℃ [9]. Luo et al. reported that the silver paste using silver nanoparticles (AgNPs) was proper for the manufacturing electrical components at a low sintering temperature as low as 300 ℃ [10]. However, the most commonly production routes of silver paste introduces the impurity elements, non-environmentally friendly reducing agent and even toxic substances [11-13]. All these works are based on screen printing technology. The limit of the width of printed silver lines is more than 50 mm, so that the efficiency of the solar cell is indirectly limited due to the transmittance of visible light affected by the area of the front electrode.
In this work, a kind of silver-coated copper wire (Ag-Cu wire) with the dimeter of 25 μm is provided. The AgNPs form a dense coating on the surface of Cu wire by using sonochemical reduction method, when ethylene glycol (EG) is used as solvent and reducer to deoxidize Ag+. The effect of silver ion concentration and ultrasonic cavitation on the growth of AgNPs is studied. Ag-Cu wire with small dimeter shows good antioxidant property, and can be sintered on the surface of silicon wafer (SW) at a lower temperature, which is conducive to the application of front electrodes in solar cells.
The copper wire (Cu, ≥99.99%, ~25 μm) is purchased from Matfron Semiconductor Technology Company. Meanwhile, silver nitrate (AgNO3, AR, ≥ 99.9%), Ethanol, ethylene glycol (EG), polyvinylpyrrolidone (PVP-K30) and hydrochloric acid (HCl, 37%) are purchased from Sinopharm Chemical Reagent Company. AgNPs coating is fabricated by ultrasonic irradiation (40 kHz, 300 W, BL10-300 ltrasonic machine) on copper wires cut in length of 20 cm. The copper wire is washed with deionized water and ethanol, respectively, rinsed with 100 mL hydrochloric acid solution (6%) for 15 min under ultrasonic irradiation, and then are immersed into 50 mL EG. AgNO3 solution is added in EG as a precursor, followed by PVP. After being sonicated for a period of time (15, 30, 45, and 60 min) at ambient condition, when the surrounding temperature was maintained at 24 ℃, the wire is rinsed with ethanol and DI water for three times and left to dry in open air. The effect of silver ion and reducing agent on the growth of AgNPs is investigated by varying the concentration of the AgNO3 (6 mmol/L, 12 mmol/L, 24 mmol/L, 36 mmol/L, 59 mmol/L) and the molar ratio vs. PVP (1:6, 1:8, 1:10, 1:12) while keeping other variables constant. All the reagents are of analytical grade and used without further purification. For the potential application of Ag-Cu wire in Si solar cell as silver omitting busbars, the products synthesized above are sintered on the SW with 20 mm × 20 mm in size in a muffle furnace (SX-3-10) for 1 h. The annealing temperature was increased from 200 ℃ to 500 ℃.
The morphology and structures of Ag-Cu wire before and after sintering on silicon are characterized by scanning electron microscope (SEM, S-4800) equipped with energy dispersive Xray spectroscopy (EDS). The crystal structure of Ag-coating is characterized by powder X-Ray Diffraction (PXRD, Ultima Ⅳ). The electrical conductivity of Ag-Cu wire is measured by digital Multimeter (8808 A), while the contact resistance between Ag-Cu wire and Si wafer is studied by DC regulated power (ZHAOXIN RXN-605D).
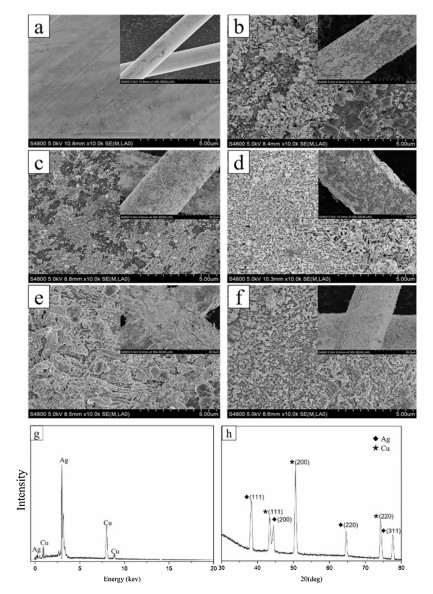
The image in Fig. 1 shows the morphologies of Cu wire and AgNPs on the surface of Cu wire. It can be seen that the surface of raw Cu wire is smooth. After ultrasonic irradiation in AgNO3 solution, roughness of the wire indicates that Cu wires are wrapped in nanoparticles. When the concentration of AgNO3 is lower than 12 mmol/L, the Cu wires are partly naked, and the size of AgNPs is small in diameter of 100–200 nm, as shown in Figs. 1b and c. When AgNO3 concentration increases to 24 mmol/L, Cu wire is completely wrapped by AgNPs of 200–400 nm in high density. At higher AgNO3 concentration, the more silver ion in the solution, the silver atoms are reduced to form thicker wrap outside. Therefore, when the concentration of AgNO3 reaches to above 36 mmol/L, the silver films formed by random stacking of silver particles is so thick to result in cracks and warpage, as shown in the insets of Figs. 1e and f. Meanwhile, the size of AgNPs increase to more than 500 nm. Fig. 1g shows the EDS spectrum of Ag-Cu wire in above sample (d). The results indicate the presence of Cu and Ag, and the intensity of Ag peak is quite strong which means copper wire is well-coated by silver nanoparticles. PXRD spectrum (Fig. 1h) of Ag-Cu wire in sample (d) reveals that there are no shift on diffraction peaks of Ag and Cu, shows that there are no Ag, Cu oxide and Ag-Cu alloy in the product. Ag-Cu wire has excellent anti-oxidation property according to XRD spectrum. The coverage rate and size of silver particles on the surface increase obviously with the increasing of AgNO3 concentration. Overall, the diameter and coverage of AgNPs are more uniformity at AgNO3 concentration of 24 mmol/L. Therefore, this concentration can be assumed as the saturation concentration, which is most suitable and stable for growth of AgNPs.

|
Download:
|
| Fig. 1. SEM images of copper wires (a) and AgNPs grown on Cu wire at different AgNO3 concentrations of (b) 6 mmol/L, (c) 12 mmol/L, (d) 24 mmol/L, (e) 36 mmol/L and (f) 59 mmol/L; EDS spectrum (g) and XRD spectrum (h) of Ag-Cu wire in above sample (d). | |
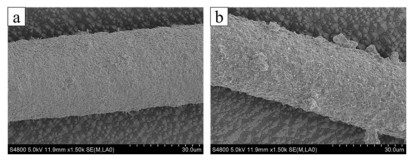
In the course of the experiment, it is found that without ultrasonic wave, the encapsulation layer of AgNPs could not be achieved under the same conditions mentioned above. Therefore, the effect of ultrasonic irradiation is studied at AgNO3 concentration of 24 mmol/L. It is reported that the chemical effects of ultrasound do not come from a direct interaction of sound with molecular species, and acoustic cavitation is responsible for the sonochemical process [14, 15]. The main event in sonochemistry is the creation, growth, and collapse of a bubble that is formed in the liquid. The stage leading to the growth of the bubble occurs through the diffusion of solute vapor into the volume of the bubble. The last stage is the collapse of the bubble when the bubble size reaches its maximum value. High temperature (5000–25000 K) are obtained upon the collapse of the bubble. Since this collapse occurs in less than nanosecond, transient hot spot forms, and that hot spot is responsible for the chemistry. To check this hypothesis, we have carried out the reaction at 200 ℃ without ultrasonic waves. Indeed, the expected silver coating is failure to obtain. Then, we observe AgNPs on surface of Cu wire after ultrasonic irradiating for different time under 40 kHz and 0.45 W/cm2, as shown in Fig. 2. After ultrasonic irradiating, although the density of AgNPs has no obviously improvement, extension of time increases the size of AgNPs from 150 nm to 450 nm. The results are accordance with the reaction process by sonochemical method. The formation of AgNPs from solution to solid involves two stages, which are nucleation and growth. The density of nucleation site on Cu wire is dominated by ultrasonic power [16]. During nucleation, silver atoms joint together forming small particles. The growth of single crystal follows the Ostwald ripening process whereby the growth of larger crystals is more energetically favored with respect to smaller crystals that nucleate first. On this basis, it is realized that there is enough bubble collapse in ethylene glycol to result in high temperature. Then ethylene glycol decomposes, and radical ion are created, which is beneficial to the landing of silver ions on the surface of Cu wires as follow reaction equations [17, 18].

|
Download:
|
| Fig. 2. SEM images of silver-coated copper wire at different ultrasonic time under constant power: (a) 15 min, (b) 30 min, (c) 45 min, (d) 60 min. | |

|
(1) |
|
(2) |
The Ag-Cu wire is sintered on a SW at different temperature. As a result, when the temperature is below 400 ℃, the Ag-Cu wire is failure to connect on the SW. Fig. 3 shows the SEM images of Ag-Cu wire on SW at 400 ℃ and 500 ℃. In Fig. 3a, AgNPs still show complete particle morphology, and the boundary between Ag-Cu wire and SW is clear, which means the AgNPs have not formed hot melt connection. The subsequent measurements prove that the adhesion between Ag-Cu wire and SW is not strong enough and fall off easily. When increasing sintering temperature to 500 ℃, AgNPs melt and form a dense enclosing layer. In addition, the connection between the Ag-Cu wire and SW is relatively stronger. However, this annealing temperature is still too high.

|
Download:
|
| Fig. 3. SEM images of silver-coated copper wire sintered on silicon substrate at different temperature: (a) 400 ℃, (b) 500 ℃. | |
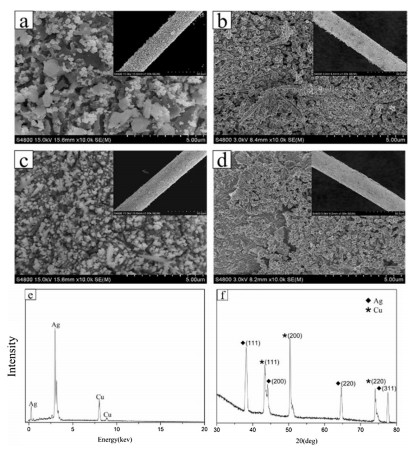
Our former work has reported that the size of AgNPs could be controlled by polyvinylpyrrolidone (PVP) [19]. Therefore, PVP was introduced into sonochemical synthesis of AgNPs. Fig. 4 shows the SEM images of AgNPs grown on Cu wire regulated by different molar ratio of PVP vs. AgNO3, keeping AgNO3 concentration at 24 mmol/L. When the molar ratio is 6:1, the size and shape of AgNPs is irregular. Both small particles and large pieces are present in the products. As a kind of organic polymer compounds, PVP has large steric hindrance because of existence of five-membered ring, which could provide a stable and disperse environment. Further, the pyrrole ring of the PVP branch is a typical polar functional group, which can effectively combine with the metal crystal plane. It is suggested that when the concentration of PVP is low, silver nanoparticles are partly coated by PVP. The silver nanoparticles without PVP coated are easy to aggregate to form a big one. The higher the molar ratio is, the smaller the dimeter of AgNPs is. When molar ratio is 10:1, the diameter of AgNPs decreases to ~100 nm and the uniformity is obviously increased. It is suggested that most silver crystal plane is coated by PVP so that the deposition rate of silver atoms on each plane is limited. In the situation nucleation is in domination, so that AgNPs in small size are formed on the surface of copper wire [20, 21]. However, if the amount of PVP is overdose, due to the rest polymer chain of PVP as bridge [22], part of silver nanoparticles aggregates again, as shown in Fig. 4d. High intensity of Ag peak as shown in the EDS spectrum in Fig. 4e reveals that the percentage of silver nanoparticles on the surface of copper wire in sample (c) is still can reach to a high level, which means the AgNPs are denser. The degree of diffraction peaks in powder XRD spectrum of Ag-Cu wire in sample(c) as shown in Fig. 4f is similar with XRD spectrum in Fig. 1h. This means the Ag-Cu wire synthesized through PVP does not contain copper oxide, silver oxide or Ag-Cu alloy either. Compared to XRD spectrum in Fig. 1h, the intensity of (111) peak in Fig. 4f is stronger and this is attributed to the selective adsorption of PVP. The functional group N-C=O of PVP is easy to adsorb on (100) plane of Ag to decrease its growth rate and (111) crystal plane has relatively less PVP adsorption, So the crystal structure of Ag as shown in Fig. 4f forms.

|
Download:
|
| Fig. 4. SEM images of AgNPs grown on Cu wire regulated by different molar ratio of PVP vs. AgNO3: (a) 6:1, (b) 8:1, (c) 10:1, (d) 12:1. EDS spectrum (e) and XRD spectrum (f) of Ag-Cu wire in above sample (c). | |
After annealing at 320 ℃ for 1 h, the Ag-Cu wire in Fig. 4c is sintered firmly on silicon substrate. Fig. 5 shows the surface and cross-sectional mapping images of Ag-Cu wire after sintering process. Cu wire is wrapped in silver layer of ~2.5 μm in thickness, while there is also a thicker silver layer between the Ag-Cu wires and the silicon substrate according to Fig. 5a. These results indicate that the AgNPs melt and form the silver layer between Cu core and Si substrate. The existence of intermediate silver layer provides excellent bonding strength between Ag-Cu wire and silicon substrate. The distribution of Ag (Fig. 5b) and Cu element (Fig. 5c) show a core-shell structure of Ag-Cu wire. Surface morphology of sintered Ag-Cu wire in Fig. 5d shows that Cu wire is coated completely by silver, and the AgNPs on the surface melt completely and form a dense, well-crystallized silver film, which provided good properties of anti-oxidation to the products. The distribution of Ag element in Fig. 5e indicates that the Ag coating is welldistributed. From the above results, it can be seen that good sintering of Ag-Cu wire and silicon substrate was realized at low temperature.

|
Download:
|
| Fig. 5. Mapping images of Ag-Cu wire after heated at 320 ℃ for 1 h: (a) SEM image, distribution of (b) Ag element and (c) Cu element in cross section; (d) SEM image, distribution of (e) Ag element and (f) Cu element in surface. | |
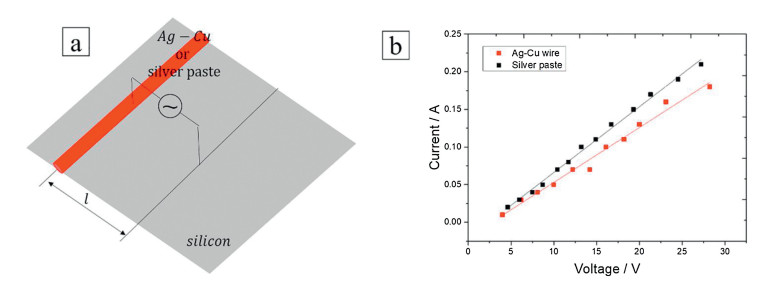
The resistance of raw Cu wire is 1.58 Ω/10 cm, while the resistance of Ag-Cu wire in Fig. 4c is only 1.48 Ω/10 cm. After exposure to air for more than 3 months, the resistance of Cu wire increases to 1.64 Ω, but the resistance of Ag-Cu wire does not change significantly. The results show good antioxidant performance of silver-coated copper wire. The series resistance is the main performance parameter of solar cell, and the contact resistance between the front electrode and the SW is a part of the series resistance [23]. To illustrate the electrical behavior of the Ag-Cu wire, the contact resistance between Ag-Cu wire and Si substrate is tested as shown in Fig. 6a. The positive electrode of power is connected with the Ag-Cu wire, while the negative electrode is connected with the SW. The distance l between two electrodes is 1 cm. Good linearity characteristic of I-V curve shown in Fig. 6b indicates that the contact between SW and silver-coated copper wire was ohmic contact. The electrical resistance of Ag-Cu wire is so close to that of silver line by printed (width of printed silver line is 100 mm) that it can be considered as a substitute for silver paste. Considering economic synthesis process, low sintering temperature and more transmission of visible light, Ag-Cu wire could be a potential alternative in front electrodes of solar cells.

|
Download:
|
| Fig. 6. Test structure diagram (a) and I-V curve (b) for measurement of electrical properties of contact resistance between SW and silver electrodes. | |
This paper describes the synthesis of AgNPs coating on copper wire using sonochemical method for application in silicon solar cell. The density and size of AgNPs in coated layer directly affected by the growth parameters such as variation of AgNO3 concentration, ratio proportion of PVP and ultrasonic time. The AgNO3 concentration, ratio proportion of PVP affect the size and thickness of AgNPs coating on the surface of copper wire while ultrasonic cavitation influenced the nucleation rate and density of AgNPs. The best condition suitable for growth of silver coating layer by Sonochemical-assisted method is established on Cu wire, which can be sintered on silicon substrate at a low temperature. The results on electrical conductivity and anti-oxidation indicates that Ag-Cu wire are suitable for the front electrode in silicon solar cells.
AcknowledgmentsThis work is financially supported by the National Nature Science Foundation of China (No. 11204082) and Shanghai Natural Fund (No. 16ZR1410700).
| [1] |
J.T. Tsai, S.T. Lin, J. Alloy Compd. 548 (2013) 105-109. DOI:10.1016/j.jallcom.2012.09.018 |
| [2] |
C. Khadilkar, S. Kim, T. Pham, A. Sharkh, S. Sridharan, Sol. Energy Mater. Sol. C 69 (2004) 1630-1642. |
| [3] |
G. Schmid, Chem. Rev. 92 (1992) 1709-1727. DOI:10.1021/cr00016a002 |
| [4] |
K. Iwasaki, T. Yamamura, Mater. Trans. 46 (2005) 1368-1377. DOI:10.2320/matertrans.46.1368 |
| [5] |
J.M. Qiu, J. Bai, J.P. Wang, Appl. Phys. Lett. 89 (2006) 222506. DOI:10.1063/1.2398912 |
| [6] |
D.Q. Zhang, R.R. Wang, et al., J. Am. Chem. Soc. 134 (2012) 14283-14286. DOI:10.1021/ja3050184 |
| [7] |
S. Maria, G. Konsta, J. Sustain. Chem. Mater. 3 (2014) 167-180. |
| [8] |
J.R. Qu, M.G. Hu, J.Z. Chen, J. Earth Sci. 30 (2005) 194-198. |
| [9] |
K. Park, D. Seo, J. Lee, Colloid Surf. A 313 (2008) 351-354. |
| [10] |
Y.L. Shi, J. Chen, et al., Adv. Mater. Res. 392 (2012) 745-748. |
| [11] |
Y. Sun, Y. Xia, Sci. 298 (2002) 2176-2179. DOI:10.1126/science.1077229 |
| [12] |
L. Rodriguez-Sanchez, M. Blanco, M. Lopez-Quintela, J. Phys. Chem. B 104 (2000) 9683-9688. DOI:10.1021/jp001761r |
| [13] |
H. Huang, X. Ni, G. Loy, C. Chew, K. Tan, F. Loh, et al., Langmuir 12 (1996) 909-912. DOI:10.1021/la950435d |
| [14] |
K.S. Suslick, MRS Bull. 20 (1995) 29-34. |
| [15] |
A. Gedanken, Ultrason. Sonochem. 11 (2004) 47-55. DOI:10.1016/j.ultsonch.2004.01.037 |
| [16] |
R. Rayathulhan, B.K. Sodipo, A.A. Aziz, Ultrason. Sonochem. 35 (2017) 270-275. DOI:10.1016/j.ultsonch.2016.10.002 |
| [17] |
C. Özmetin, M. Çopur, et al., Chem. Eng. Technol. 23 (2000) 707-711. DOI:10.1002/(ISSN)1521-4125 |
| [18] |
B. Blin, F. Fievet, D. Beaupere, M. Figlarz, New J. Chem. 13 (1989) 67-72. |
| [19] |
Q. Zhu, Z.J. Zhang, Z. Sun, B. Cai, W.J. Cai, Appl. Phys. A 122 (2016) 1-7. |
| [20] |
I. Pastoriza-Santos, L.M. Liz-Marzán, Langmuir 18 (2002) 2888-2894. DOI:10.1021/la015578g |
| [21] |
Z.T. Zhang, B. Zhao, L.M. Hu, J. Solid State Chem. 121 (1996) 105-110. DOI:10.1006/jssc.1996.0015 |
| [22] |
X.Z. Lan, Z.H. Jin, X.C. Zhao, et al., Rare Metal Mater. Eng. 32 (2003) 50-53. |
| [23] |
Z. Liu, S.K. Traore, L. Lin, et al., Acta Energy Sol. Sin. 24 (2003) 659-662. |