 2019, Vol. 30


b Chongqing Key Laboratory of Biomedical Analysis(Southwest University), Chongqing Science & Technology Commission, College of Chemistry and Chemical Engineering, Southwest University, Chongqing 400715, China
It is well known that copper ion is one of the most important transition metals in human body as it serves as a significant catalytic cofactor for a variety of metalloenzyme [1, 2]. Copper plays an essential role in multiple physiological processes, including bone formation, cellular respiration, and connective tissue development and so on. However, it is highly toxic to human health under overloading condition and will cause neurodegenerative diseases, such as Wilson's disease and Alzheimer's disease [3, 4]. Along with the widespread applications of copper in industry and agriculture, the potential toxic effects on human beings have attracted an increasing attention. Therefore, developing simple and practical approaches for the precise determination of environmental Cu2+are crucial for both human health and environment pollution monitoring.
Over the past several years, carbon dots (CDs) have emerged ongoing interest as prompt sensing probes due to their excellent photoluminescent (PL) properties, good biocompatibility and low toxicity [5-7]. So far, CDs have been successfully applied for detection of various heavy metal ions including Cu2+ [8, 9]. For example, Dong et al. prepared branched poly(ethylenimine) (BPEI)- functionalized carbon quantum dots (CQDs) for Cu2+ detection, wherein Cu2+ ions were captured by the amino groups of the BPEICQDs to form an absorbent complex on the surface of CQDs, resulting a strong PL quenching of CQDs via inner filter effect [9]. Liu et al. proposed a strategy of fluorescent colorimetry, which used ratiometric fluorescent blue CDs and red CDs probes for visual detection of copper ions, wherein Cu2+ ions bound onto the surface of red CDs could result in strong absorption that overlapped the emission of blue CDs and Cu2+ ions also could promote adsorption of blue CDs onto the red CDs, leading to the PL quenching of blue CDs [10]. It is noticeable that most of these reported techniques to detect metal ions are based on the PL quenching of CDs [11-15] except a few reports focusing on PL enhancement [16, 17].
The aggregation-induced emission characteristics (AIEgens) of fluorescent organic small molecules or PL nanoparticles have attracted great interest since firstly proposed by Tang et al. [18, 19], which might have wide applications in the fields of bioimaging and biosensing [20-22]. For instance, an interesting example is that single layered graphene quantum dots (s-GQDs) prepared at room temperature via a simple self-exothermic reaction display aggregation induced emission enhancement (AIEE) properties in the presence of Al3+ through coordination and electrostatic interaction [23]. Therefore, it is worthy of further exploiting the CDs AIEgens both in theoretical study and practical application in the fields of bioimaging and biosensing, molecular recognition and assembly.
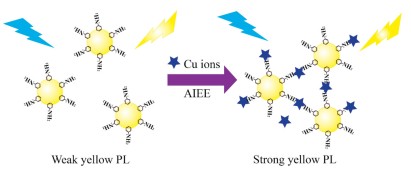
In this work, OPD-CDs showed a weak yellow PL emission, which could be greatly enhanced by the addition of Cu2+ ions because of the AIEE properties of OPD-CDs induced by the coordination of Cu2+ with amino groups on the surface of OPD-CDs (Scheme 1) [10]. Under the optimal conditions, the AIEE-based method displayed high sensitivity with a limit of detection as low as 0.28 mmol/L, which was much lower than the allowable level of copper (~20 μmol/L) in drinking water set by US Environmental Protection Agency [24], and thus successfully applied to the detection of copper in Jialing River closure reservoir in Caojie Hydropower Station region (Chongqing, PRC). Furthermore, the OPD-CDs showed negligible cytotoxicity and good biocompatibility, which could be used for intracellular Cu2+ imaging.

|
Download:
|
| Scheme 1. The AIEE property of OPD-CDs for detecting Cu2+. | |
The stable PL CDs were prepared via hydrothermal process using o-phenylenediamine (OPD) as carbon source. In details, 100 mg o-phenylendiamine was dissolved into 5.0 mL of water, and the solution was transferred into a 25-mL Teflon-lined stainless steel autoclave and heated at 220 ℃ for 12 h. After the reaction was completed, the autoclave was cooled down to room temperature. Then, the product was filtered with a 0.22-μm filter membrane to remove large particles to obtain the yellow solution, which was concentrated and purified with silica-column chromatography using methanol and dichloromethane mixture (volume ratio 1:10) as eluents. After removing solvents and further drying under vacuum, the purified OPD-CDs powder was saved at 4 ℃ for further use.
The as-prepared OPD-CDs presented excellent optical properties, which displayed an obvious absorption band at 410 nm with a minor shoulder band at 285 nm (Fig. S1a in Supporting information, blue curve). The band at 285 nm was consistent with the π-π* transition of C=C, resulting in nearly no observable PL emission. The band at 410 nm originated from n-π* transition and led to a strong PL emission due to the trapping of excited-state energy by the surface states. The absorption band of OPD-CDs had some red shift as comparison to typical absorption band of CDs around 320–380 nm in previous reports [25, 26], indicating that the as-prepared product might have a lower transition from the σ and π orbital (HOMO) to the lowest unoccupied molecular orbital (LUMO) [27]. Therefore, OPD-CDs exhibited the comparatively long-wavelength emission at 568 nm under 420 nm excitation, and showed a yellow color under the illumination of 365 nm UV light (the inset photograph of Fig. S1b in Supporting information). Notably, OPDCDs showed excitation-independent PL feature (Fig. S1b), suggesting that both the size and the surface state of those CDs may be uniform [28]. In addition, the results demonstrated that the photostability of OPD-CDs was better than traditional dyes under continuous irradiation by UV light, and presented stable emission at high ionic strength (up to 1.0 mmol/L NaCl) (Fig. S2 in Supporting information), suggesting that the OPD-CDs were competent to serve as potential PL probes.
The morphology and structure of the as-prepared OPD-CDs (Fig. S3a in Supporting information) indicated that OPD-CDs were mono-dispersed and uniform in size. As estimated from the TEM image, the diameters of OPD-CDs were mainly distributed in the range of 4–10 nm with an average size of about 7 nm. The HRTEM image (Fig. S3b in Supporting information) clearly showed the representative image of individual CDs with a lattice spacing of 0.23 nm, which corresponded to the (102) diffraction plane of graphitic (sp2) carbon [29]. Then, XPS and FT-IR were carried out to characterize the functional groups and chemical bonds of OPDCDs. The full range of XPS analysis of the OPD-CDs (Fig. S3c in Supporting information) clearly showed three peaks at 284.8 eV, 399.1 eV, and 532.5 eV, which were attributed to C 1s, N 1s and O 1s, respectively. A high-resolution XPS spectrum of C 1s (Fig. S4a in Supporting information) confirmed the existence of C=C (284.2 eV, sp2), C—N (285.1 eV, sp3) and C—O (285.7 eV, sp3) bonds [30]. The N 1s peaks (Fig. S4b in Supporting information) at 398. 6 eV, 399.2 eV and 400.2 eV indicated that nitrogen existed mostly in the form of N—H, N—(C)3, and N-C—N, respectively, implying that nitrogen-containing groups were on the surface of the carbon frame and were favorable for the detection of Cu2+ ions [31]. The O 1s spectrum showed two peaks at 531.7 eV and 532.9 eV, which were attributed to C=O and C—OH/C—O—C functional groups (Fig. S4c in Supporting information) [32]. The infrared spectrum of OPD-CDs and that of OPD presented obvious differences (Fig. S3d Supporting information), which indicated that new structure was formed accompanied by the carbonization process of OPD. In comparison to the source material (OPD), a characteristic peak at 3433 cm-1 of OPD-CDs infrared spectrum, which could be assigned to the amino and oxygen functional groups on their surface. And some new absorption bands appeared at about 2856-2931 cm-1, which should be attributed to aliphatic C—H, and that at 1463 cm-1 and 1382 cm-1 might correspond to the stretching vibrations of C=C and C—N=, respectively. The peaks at 1123 cm-1 and 1026 cm-1 were assigned to the C—N and C—O chemical bonds [33]. Both FT-IR spectra and XPS results indicate the asprepared OPD-CDs possess rich chemical bonds of C=C, C—N, C=O, and rich surface functional groups, such as —NH, —OH, —CONH— and these functional groups can bind with targets and enhance water-solubility of the OPD-CDs [28].
Since the functional groups such as amino and carboxyl groups on the surface of OPD-CDs have a very strong affinity toward heavy metals ions, which can be used for the recognition of heavy metal ions by regulating their binding ability through pH or ionic strength. To optimize the detection conditions, the dependence of the PL responses to Cu2+ on pH values and reaction time have been investigated. The result showed that the optimal time was 60 min for the reaction between OPD-CDs and Cu2+ (Fig. S5a in Supporting information). In the absence of Cu2+, the PL intensities of OPD-CDs were almost unchanged at different pH conditions. In the presence of Cu2+, however, the PL intensity of OPD-CDs was strongly dependent on pH values (Fig. S5b in Supporting information). In the pH range of 2.0–7.0, the protonation of amino groups led to the decrease interactions between Cu2+ and OPD-CDs. When pH was over 7.0, however, Cu2+ ions were inclined precipitate in the form such as Cu(OH)2, and CuO, rarely forming Cu2+-(OPD-CDs) complexes [34]. Interestingly, it was found that the addition of Cu2+ ions into the OPD-CDs aqueous solution can enhance rather than quench the PL (Fig. 1a). In contrast, other metal ions including Al3+, Ba2+, Ca2+, Cd2+, Cr2+, Fe3+, Hg2+, K+, Li+, Mg2+, Mn2+, Na+, Ni2+, Pb2+, Zn2+ have no significant effect on the PL of OPD-CDs. The high selectivity of OPD-CDs for Cu2+ is due to that Cu2+ ion has higher thermodynamic affinity and faster chelating process with "N" of OPD-CDs than other metal ions [35].

|
Download:
|
| Fig. 1. (a) The binding features of OPD-CDs with different metal ions. The concentration of Cu2+ is 20 μmol/L and other metal ions are 100 μmol/L, the concentration of OPDCDs was 5 μg/mL. Inset: photographs of the OPD-CDs mixed with various metal ions under 365 nm UV light. (b) Fluorescence response of OPD-CDs upon addition of various concentrations of Cu2+ (from bottom to top, 0, 0.5, 1, 2, 4, 8, 10, 15, 20, 30, 40, 80, 100, 200 μmol/L) in pH 7 BR solution. Inset: Photographs of the OPD-CDs mixed with various concentrations of Cu2+ under 365 nm UV light. (c) The fluorescence intensity of the OPD-CDs versus the Cu2+ concentration (I and I0 represent PL intensities with the presence and absence of Cu2+ ions, respectively), the concentration of OPD-CDs was 5 μg/mL. Inset: Resulting calibration curve. | |
Fig. 1b shows the enhanced PL emission spectra of OPD-CDs with the addition of various concentrations of Cu2+ ranging from 0 to 200 μmol/L, accompanied by the emission red-shift from 568 nm to 577 nm. A calibration plot of the PL intensity as a function of Cu2+ concentration couldbe availablein the range of0.5–40μmol/L (inset of Fig. 1c) with the limit of detection of 0.28 μmol/L (3σ/k). Compared with other methods (Table S1 in Supporting information), the present work could act as a convenient and sensitive platform for Cu2+ detection, providing an alternative fluorescence enhancement method.
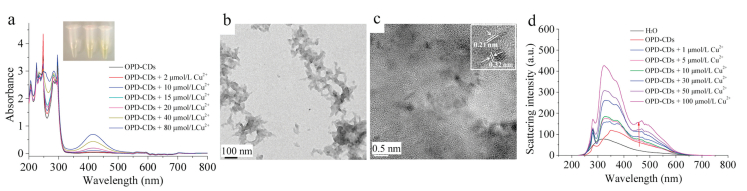
The enhanced PL phenomenon of Cu2+ ions is greatly different from the conventional quenching effect and thus deserves further discussion. In order to elucidate the mechanism of copper ions detection using OPD-CDs, a series of measurements including absorption spectra, scattering spectra, FT-IR spectra, and quantum yield (QY) of OPD-CDs were employed. As shown in Fig. 2a, the absorption of OPD-CDs at 410 nm was obviously enhanced with the addition of Cu2+ into the OPD-CDs solution, indicating that Cu2+ might coordinate with OPD-CDs, and then form Cu2+-(OPD-CDs) complexes. Measurements of absorption spectra were consistent with the color change of OPD-CDs solution (inset of Fig. 2a), wherein the color of OPD-CDs obviously turned from light yellow to dark yellow in the presence of different concentrations of Cu2+. Therefore, the enhanced PL emission of OPD-CDs by Cu2+ might result from the increase of n-π* transition efficiency, which can be inferred also from the broadening infrared bands of OPD-CDs in the presence of Cu2+ (Fig. S6a in Supporting information), wherein the interactions of Cu2+ with amino groups of OPD-CDs might occur. In addition, the XPS spectra of Cu2+ ions after interacting with OPD-CDs have a strong satellite peak at 942.0 eV (Fig. S6b in Supporting information), suggesting that the existence of Cu(Ⅱ) species. On the other hand, there were also two typical Cu 2p1/2 and Cu 2p3/2 peaks with the binding energy of 954.1 and 934.3 eV, indicating that there are Cu(0) and Cu(I) species due to the charge transfer [36]. The TEM/HRTEM images (Figs. 2b and c, Fig. S6c in Supporting information) could directly prove the aggregation of OPD-CDs with the addition of Cu2+. The scattering intensities of OPD-CDs at 470 nm (Fig. 2d) got enhanced with the increase of Cu2+, indicating that the size of OPD-CDs became larger due to the formation of Cu2+-(OPD-CDs) complexes through the coordination Cu2+ and OPD-CDs.

|
Download:
|
| Fig. 2. Aggregation features of OPD-CDs in the presence of Cu2+ ions. (a) UV–vis absorption spectra of OPD-CDs without and with various concentrations of Cu2+ ions in the range of 2–80 μmol/L. Inset: Photograph of OPD-CDs with various concentrations of Cu2+ ions under daylight. (b, c) TEM/HRTEM images of aggregated OPD-CDs in the aqueous medium of 50 μmol/L Cu2+ ions. Inset of (c): Lattice spacing of a typical OPD-CQD. (d) The scattering spectra of OPD-CDs without and with the addition of various concentrations of Cu2+ ions in the range of 1–100 μmol/L. | |
The PL QY and lifetime of OPD-CDs in the absence and presence of Cu2+ were also measured (Table S2 in Supporting information). The constant of the radiative rate and the non-radiative rate could be calculated according to the following equations [33]:

|
(1) |

|
(2) |
wherein, kr and knr refer to the radiative and non-radiative rate constants, Φ and τ refer to the QY and lifetime, respectively. The radiative rate constants evidently increased from 1.206 × 10⁷ s-1 to 5.202 × 10⁷ s-1, while the non-radiative rate decreased from 3.38 × 10⁸ s-1 to 2.6 × 10⁸ s-1.
From above discussion, we presumed that copper induced the aggregation of OPD-CDs could result in the suppression of intramolecular vibration and the decrease of non-radiative rate, so as to significantly enhance the PL intensity of OPD-CDs, which in accordance with AIEE mechanism [22, 37].
It is well known that excessive Cu2+ can easily enter bloodstreams and many tissues, such as liver, kidney and brain, and then cause serious damage to the central nervous system. Therefore, intracellular monitoring of Cu2+ is essential for biological and biomedical research. In this case, Hep-2 cells were employed to investigate the cellular activities of Cu2+. CCK-8 assay is an effective way to evaluate the cytotoxicity of nanomaterials [38-41], which was carried out to assess the cytotoxicity of OPDCDs and Cu2+ ions to Hep-2 cells. Exposure of Hep-2 cells to low concentrations of OPD-CDs (5–80 μg/mL) did not produce any cell toxicity (Fig. S7a in Supporting information). However, as expected, after the addition of Cu2+ to cell culture medium, the viability of Hep-2 cells declined with the increasing of concentration and the extension of time (Fig. S7b in Supporting information). Thus, with the incubation time of 3 h, the concentration of Cu2+ under 50 μmol/L can be considered to be non-toxic and biocompatible for further biological applications.
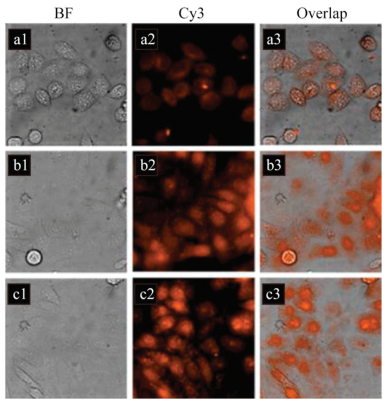
Subsequently, imaging was carried out to demonstrate the availability of OPD-CDs for intracellular Cu2+ in Hep-2 cells. By incubating Hep-2 cells with OPD-CDs for 3 h, a weak orange emission from the intracellular region could be observed (Fig. 3a2), suggesting that OPD-CDs could successfully enter cells possibly via endocytosis. Then, Hep-2 cells were treated with different concentrations of Cu2+ to semi-quantitatively sensing and monitoring the intracellular Cu2+ level (Figs. 3b and c). The PL signal gradually increased with the enhanced Cu2+ concentration, indicating the formation of OPD-CDs aggregates at the intracellular level. Simultaneously, it was found that the tendency of PL intensity from the laser confocal microscope images measured by image J (Fig. S8 in Supporting information) were consistent with the quantitative analysis of the fluorescence intensity. Furthermore, the cytotoxicity of OPD-CDs + Cu2+ was negligible as confirmed by the facts that no significant changes in cell morphology (Figs. 3a3-c3), indicating that the obtained OPDCDs were membrane permeable and could be applied for semiquantitative imaging intracellular Cu2+.

|
Download:
|
| Fig. 3. Confocal fluorescence microscopy images and their corresponding brightfield transmission images. (a1-a3) Hep-2 cells incubated with 10 μg/mL OPD-CDs for 3 h at 37 ℃. (b1-b3, c1-c3) Hep-2 cells first incubated with 5 μg/mL OPD-CDs for 3 h at 37 ℃ and then incubated with 20 μmol/L (b1-b3) and 50 μmol/L (c1-c3) of Cu2+ ions for 2 h at 37 ℃. | |
To evaluate the reliability of this proposed method, we applied the OPD-CDs based fluorescent probe to detect the concentration of Cu2+ in water samples from river closure reservoir, which were sampled from different locations of Jialing River (Beibei, Chongqing, China). The pre-treatment of the river water was centrifuged at 12,000 rpm for 20 min then filtered with a 0.22-μm membrane to remove insoluble impurities, which was then analyzed by both direct calibration and standard additions. The analytical results of three measurements (Table S3 in Supporting information) showed the recoveries were in acceptable range of 89.6%-95.1% and the relative error was less than 4%, which indicated the validity of our newly established method for Cu2+ detection in the environment samples.
In summary, we have reported a simple, low-cost route to synthesize yellow fluorescence CDs via hydrothermal reaction using o-phenylendiamine as the carbon source. It was found that Cu2+ ions could efficiently enhance the PL emission of the OPD-CDs as a result of Cu2+ induced aggregation of the OPD-CDs, which attributed to the coordination of Cu2+ ions with the amino groups at the surface of OPD-CDs. To the best of our knowledge, the metal ions induced fluorescence enhancement of OPD-CDs via AIEE has rarely been reported. The CDs-AIEE based sensing system shows many advantages, including high sensitivity, excellent selectivity, low cost, and wide linear response range, and has been demonstrated to have promising applications in the detection of Cu2+ in complex biological and environmental samples.
AcknowledgmentsThis work is financially supported by the National Natural Science Foundation of China (NSFC, No. 21535006).
Appendix A. Supplementary dataSupplementary material related to this article can be found, in the online version, at doi: https://doi.org/10.1016/j.cclet.2019.04.011.
| [1] |
J.C. Claessens, P.V. Cappellen, Environ. Sci. Technol. 41 (2007) 909-914. DOI:10.1021/es0620944 |
| [2] |
M.L. Wang, G.W. Meng, Q. Huang, Y.W. Qian, Environ. Sci. Technol. 46 (2012) 367-373. DOI:10.1021/es202137c |
| [3] |
Y.H. Chan, J.X. Chen, Q.S. Liu, et al., Anal. Chem. 82 (2010) 3671-3678. DOI:10.1021/ac902985p |
| [4] |
X.J. Liu, N. Zhang, T. Bing, D.H. Shangguan, Anal. Chem. 86 (2014) 2289-2296. DOI:10.1021/ac404236y |
| [5] |
S.Y. Lim, W. Shen, Z.Q. Gao, Chem. Soc. Rev. 44 (2015) 362-381. DOI:10.1039/C4CS00269E |
| [6] |
W. Zhang, R.X. Wang, W. Liu, et al., Chem. Sci. 9 (2018) 721-727. DOI:10.1039/C7SC03878J |
| [7] |
J. Zhou, Y. Yang, C.Y. Zhang, Chem. Commun. 49 (2013) 8605-8607. DOI:10.1039/c3cc42266f |
| [8] |
C.Q. Ding, A.W. Zhu, Y. Tian, Acc. Chem. Res. 47 (2014) 20-30. DOI:10.1021/ar400023s |
| [9] |
Y.Q. Dong, R.X. Wang, G.L. Li, et al., Anal. Chem. 84 (2012) 6220-6224. DOI:10.1021/ac3012126 |
| [10] |
C. Liu, D.H. Ning, C. Zhang, et al., ACS Appl. Mater. Interfaces 9 (2017) 18897-18903. DOI:10.1021/acsami.7b05827 |
| [11] |
Q. Xu, P. Pu, J.G. Zhao, et al., J. Mater. Chem. A 3 (2015) 542-546. DOI:10.1039/C4TA05483K |
| [12] |
J. Wang, R.S. Li, H.Z. Zhang, et al., Biosens. Bioelectron. 97 (2017) 157-163. DOI:10.1016/j.bios.2017.05.035 |
| [13] |
Y.H. Yuan, R.S. Li, Q. Wang, et al., Nanoscale 7 (2015) 16841-16847. DOI:10.1039/C5NR05326A |
| [14] |
J.J. Zhao, M.J. Huang, L.L. Zhang, et al., Anal. Chem. 89 (2017) 8044-8049. DOI:10.1021/acs.analchem.7b01443 |
| [15] |
H.D. Huang, L. Liao, X. Xu, et al., Talanta 117 (2013) 152-157. DOI:10.1016/j.talanta.2013.08.055 |
| [16] |
X.H. Gao, Y.Z. Lu, R.Z. Zhang, et al., J. Mater. Chem. C 3 (2015) 2302-2309. DOI:10.1039/C4TC02582B |
| [17] |
Q. Wang, S.R. Zhang, Y.G. Zhong, et al., Anal. Chem. 89 (2017) 1734-1741. DOI:10.1021/acs.analchem.6b03983 |
| [18] |
Y.N. Hong, J.W.Y. Lam, B.Z. Tang, Chem. Soc. Rev. 40 (2011) 5361-5388. DOI:10.1039/c1cs15113d |
| [19] |
S. Zhang, J.M. Yan, A.J. Qin, J.Z. Sun, B.Z. Tang, Chin. Chem. Lett. 24 (2013) 668-672. DOI:10.1016/j.cclet.2013.05.014 |
| [20] |
G.X. Feng, Y.Y. Yuan, H. Fang, et al., Chem. Commun. 51 (2015) 12490-12493. DOI:10.1039/C5CC03807C |
| [21] |
G.X. Feng, B. Liu, Small 12 (2016) 6528-6535. DOI:10.1002/smll.201601637 |
| [22] |
Z.X. Liu, Z.L. Wu, M.X. Gao, H. Liu, C.Z. Huang, Chem. Commun. 52 (2016) 2063-2066. DOI:10.1039/C5CC08635C |
| [23] |
B.B. Chen, R.S. Li, M.L. Liu, H.Z. Zhang, C.Z. Huang, Chem. Commun. 53 (2017) 4958-4961. DOI:10.1039/C7CC00546F |
| [24] |
J.W. Liu, Y. Lu, J. Am. Chem. Soc. 129 (2007) 9838-9839. DOI:10.1021/ja0717358 |
| [25] |
Y. Du, S.J. Guo, Nanoscale 8 (2016) 2532-2543. DOI:10.1039/C5NR07579C |
| [26] |
X.T. Zheng, A. Ananthanarayanan, K.Q. Luo, P. Chen, Small 11 (2015) 1620-1636. DOI:10.1002/smll.201402648 |
| [27] |
L. Bao, C. Liu, Z.L. Zhang, D.W. Pang, Adv. Mater. 27 (2015) 1663-1667. DOI:10.1002/adma.201405070 |
| [28] |
Y.H. Yuan, Z.X. Liu, R.S. Li, et al., Nanoscale 8 (2016) 6770-6776. DOI:10.1039/C6NR00402D |
| [29] |
Z.L. Wu, M.X. Gao, T.T. Wang, et al., Nanoscale 6 (2014) 3868-3874. DOI:10.1039/C3NR06353D |
| [30] |
C.S. Stan, C. Albu, A. Coroaba, M. Popa, D. Sutiman, J. Mater. Chem. C 3 (2015) 789-795. |
| [31] |
S.W. Yang, J. Sun, X.B. Li, et al., J. Mater. Chem. A 2 (2014) 8660-8667. DOI:10.1039/c4ta00860j |
| [32] |
K. Jiang, S. Sun, L. Zhang, et al., ACS Appl. Mater. Interfaces 7 (2015) 23231-23238. DOI:10.1021/acsami.5b07255 |
| [33] |
K. Jiang, S. Sun, L. Zhang, et al., Angew. Chem. Int. Ed. 54 (2015) 5360-5363. DOI:10.1002/anie.201501193 |
| [34] |
J. Lan, H.Y. Zou, Q. Wang, et al., Talanta 161 (2016) 482-488. DOI:10.1016/j.talanta.2016.08.081 |
| [35] |
S. Liu, J.Q. Tian, L. Wang, et al., Adv. Mater. 24 (2012) 2037-2041. DOI:10.1002/adma.201200164 |
| [36] |
X.F. Jia, J. Li, L. Han, et al., ACS Nano 6 (2012) 3311-3317. DOI:10.1021/nn3002455 |
| [37] |
Z.H. Li, S. Guo, C. Lu, Analyst 140 (2015) 2719-2725. DOI:10.1039/C5AN00017C |
| [38] |
M.M. Luan, J.J. Chang, W. Pan, et al., Anal. Chem. 90 (2018) 10951-10957. DOI:10.1021/acs.analchem.8b02494 |
| [39] |
W. Pan, H.H. Wang, L.M. Yang, et al., Anal. Chem. 88 (2016) 6743-6748. DOI:10.1021/acs.analchem.6b01010 |
| [40] |
Z.Z. Yu, Q.Q. Sun, W. Pan, li N., B. Tang, ACS Nano 9 (2015) 11064-11074. DOI:10.1021/acsnano.5b04501 |
| [41] |
Z.Z. Yu, P. Zhou, W. Pan, N. Li, B. Tang, Nat. Commun. 9 (2018) 5044-5052. DOI:10.1038/s41467-018-07197-8 |