 2019, Vol. 30


b College of Chemistry, Jilin University, Changchun 130012, China;
c Key Laboratory of Physics and Technology for Advanced Batteries of Ministry of Education, Changchun 130012, China
In recent years, supercapacitors have attracted significant attention, mainly due to their high power density, long cycling life, and rapid charge/discharge processes. Activated carbon (AC) is a promising electrode material for supercapacitors because of its abundance, large surface area, relatively good electronic properties and moderate cost [1-3]. Considering the production cost and energy/environmental effects, the transformation of renewable biomass to ACs is regarded as more worthwhile [4]. Until now, ACs have been prepared from various renewable biomasses, such as rice husk [5, 6], cellulose [7-9] and lignin [10, 11]. Among the above biomasses, rice husk (RH) is a kind of low cost and abundant biomass. The annual world rice production is about 571 million tonnes, which produces approximately 140 million tonnes of useless rice husk. Therefore, converting renewable rice husks into electrode materials is supposed to be an economical and sustainable route [4, 12, 13].
RH contains a variety of organic components such as lignin, cellulose, and hemicellulose. Besides, the unique composition (silica) is formed during the growth of RH. It is known that silica accounts for ~15-20 wt% of the entire weight of RH [6]. In order to obtain ACs with high specific surface area, KOH is often used as activating agents. However, the silica in RH makes the activation process of RH different from that of the other precursors. Namely, silica in RH affects the formation of pores in activation process and the electrochemical performances of the prepared AC. Although some researches have reported the activation process of RH using KOH as the activating agent, the effect of silica in RH on the formation of pores during the activation process is not fully understood.
In this paper, the effects of silica in rice husk on the activation process and the electrochemical performances of the prepared AC are investigated by removing the silica in rice husk by alkali leaching (carbon materials denoted as RHCB) or not (carbon material denoted as RHC) before activation process. When the silica in RH is not removed, the prepared AC exhibits high specific surface area, high micropore ratio, and high specific capacitance, but poor rate capability. In the activation process, silica in RH hinders the formation of mesopores. On the contrary, when the silica in RH is removed, the prepared AC exhibits high mesoporous ratio and good rate capability.
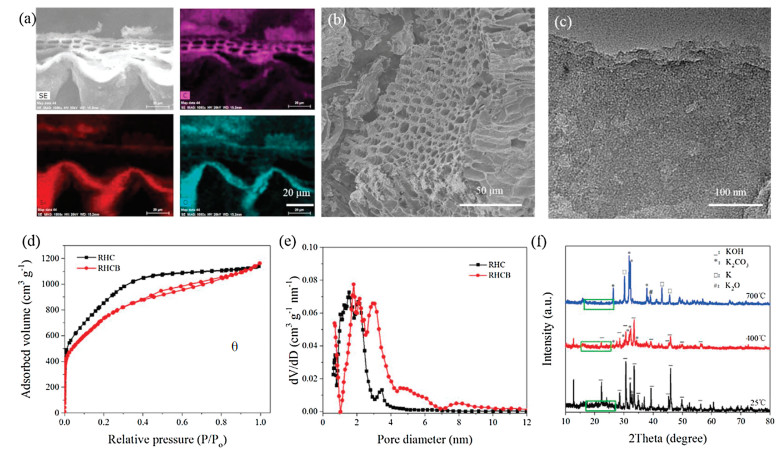
Fig. 1a shows the typical energy dispersive spectroscopy (EDS) mapping of carbonized rice husk (CRH). The silicon element exists in the form of amorphous silica (account for ca. 45% of the weight of CRH), as indicated by the consistent mapping of Si and O elements. The RHCB shows apparent vascular bundle morphology in the scanning electron microscopy (SEM) image (Fig. 1b), and RHCB shows apparent micro/mesoporous structure inside carbon skeleton in the transmission electron microscopy (TEM) image (Fig. 1c). However, it is hard to find the structural difference between RHC and RHCB with SEM and TEM techniques. Therefore, it is important to probe the porous structure of RHCB and RHC using N2 adsorption/desorption method. Fig. 1d shows N2 adsorption/ desorption isotherms of RHC and RHCB. The adsorption/desorption isotherms of RHC are approximately type Ⅰ isotherms according to the IUPAC classification [14, 15]. At relatively low pressure, the adsorbed N2 volume increases steeply. At the higher relative pressures, the adsorbed N2 volume rises to an almost horizontal plateau. These results indicate that RHC possesses high microporosity. However, RHCB shows a combined Ⅰ/Ⅳ type adsorption/ desorption isotherm (Fig. 1d). Strong N2 adsorption occurs at low pressure due to the presence of micropores. The obvious hysteresis loop between the adsorption and desorption branches suggests the existence of mesopores. This adsorption behavior indicates that the mesopores are significantly developed due to the removal of silica in RH.

|
Download:
|
| Fig. 1. (a) EDS mapping of CRH with carbon, silicon and oxygen elements, (b) SEM and (c) TEM images of RHCB, (d) Nitrogen adsorption/desorption isotherms of RHC and RHCB, (e) Pore size distributions of RHC and RHCB, (f) XRD patterns of KOH-impregnated CRH at 25 ℃, annealed at 400 ℃ and 700 ℃ for 1 h. | |
Shown in Fig. 1e are the pore size distributions of RHC and RHCB. The RHC exhibits a narrow pore size distribution between 0.5 and 3 nm, indicating that large numbers of micropores exist in RHC. This ensures a large specific surface area for RHC. On the contrary, the pore sizes of the RHCB are distributed in a broad range from 0.5 to 10 nm. There are several obvious peaks in Fig. 1e for RHCB, which indicates the presence of micropores and mesopores of different sizes. It can be concluded that the RHCB possesses a combined micro/mesopore structure with a larger volume of mesopores than RHC. The large volume mesopores of RHCB is suitable for the mass transfer of electrolyte ions. As summarized in Table S1 (see Supporting information), the specific surface area (3263 m2/g) of RHC is larger than RHCB (2804 m2/g) due to the presence of massive and large micropores in RHC. The micropore volume of RHC reaches up to 1.132 cm3/g, which accounts for 63.9% of the total volume. This confirms that the micropore is dominant in RHC. On the contrary, the RHCB exhibits a low micropore volume (0.476 cm3/g) accounting for 26.5% of the total volume. The mesopore ratio is 73.5% for RHCB which is much higher than that of RHC. From the above results, the RHC exhibits a high specific surface area and high microporous ratio. On the contrary, the RHCB exhibits high mesoporous ratio. This difference in pore size distribution may be caused by the removal of silica or not during activation process.
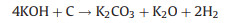
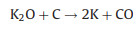
To investigate the effects of silica on the activation process, we investigated the phases of rice husk reacted with KOH in the calcination process. Fig. 1f shows the XRD patterns of KOHimpregnated CRH at different temperatures. There is a broad diffraction peak observed at 2θ = 22.5° under 25 ℃, which is attributed to amorphous silica in CRH. When the KOH-impregnated CRH was treated at 400 ℃, the broad peak of silica disappeared, which is due to that silica reacts with KOH at 400 ℃. At the same time, the peaks of K2CO3 were strengthened, which is due to the reaction between CO2 produced in carbonization and KOH. Namely, the silica reacts with KOH before 400 ℃, which precedes the reaction of KOH with carbon. For the activation process of CRH, the KOH preferentially reacts with silica in CRH generating the new-born silicate before the reaction of carbon with KOH.

|
(1) |
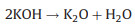
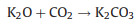
The new-born silicate as a "shell" covers carbon, which hinders the reaction of KOH with carbon. The metallic K and K2O are produced during the further reaction. The metallic K intercalated between the graphene layers of the carbon materials and generated micropores. The KOH reacts with carbon may be as follows [16, 17]:
|
(2) |
|
(3) |
|
(4) |
|
(5) |
|
(6) |
To verify the above KOH-activation reactions, the activation products from the activation process of CRH under 700 ℃ were analyzed by XRD. As shown in Fig. 1f, the peaks of KOH disappear. The peaks of K2CO3, K, and K2O are dominant in XRD pattern. These results prove the above reactions.
As for the activation process of CRHB (CRH treated with alkali leaching), The CRHB exhibits higher specific area than CRH after the removal of silica (Table S2 in Supporting information). The specific surface area of the RHCB increases from 19 m2/g of CRH to 247 m2/g of CRHB with the removal of silica in CRH, similar with the research published recently [4]. As can be seen, a large volume of micropores and mesopores are formed due to the removal of silica in CRH. The large volume of micropores and mesopores results in a high mesopore ratio in RHCB. In the initial stage of the activation process of CRHB, the reaction of silica with KOH do not occur since almost all the silica are removed by NaOH leaching. Because CRHB possesses relative high specific area, the KOH congregates in the porous channel of nanostructured carbon in CRHB via capillary effect. Along with the activation, the primary porous micropores are enlarged to mesopores. And the already formed mesopores are enlarged to larger mesopores. So the resultant RHCB has higher mesoporous volume and larger mesoporous size compared with RHC.
From the above discussion, the silica in RH plays an important role in the activation process. The removal of silica is beneficial to form high pore volume and large size mesopores. In order to study the difference in electrochemical performances of RHC and RHCB, cyclic voltammetry (CV), galvanostatic charge-discharge (GCD), and electrochemical impedance spectroscopy (EIS) were carried out in a 6 mol/L KOH aqueous electrolyte using a two-electrode configuration.
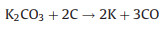
Figs. 2a and b show the CV curves of RHC and RHCB electrodes at different scan rates from 5 mV/s to 1000 mV/s. The CV curves of RHC and RHCB all exhibit quasi-rectangular shape indicating the ideal double-layer capacitive performances. Besides, the areas of CV curves of RHC are higher than that of RHCB at low scan rates. So, RHC has higher specific capacitance than RHCB. This is because RHC has a higher surface area than RHCB, which provides more active sites for forming electric double layer by adsorption electrolyte ions. This phenomenon becomes different with the increase of scan rates. The CV curves of RHC are gradually distorted. This is due to that the RHC possesses a large number of micropores, which make ions transportation more difficult at a high scan rate. However, the quasi-rectangular shapes of CV curves of RHCB are still kept quasi-rectangular at 1000 mV/s. That is to say, the RHCB exhibits a better rate capability compared with RHC. These results are also verified by the GCD test. The GCD curves of RHC and RHCB in a current range of 0.5–20 A/g in the voltage range between 0 and 1.0 V are shown in Figs. 2c and d. The symmetric GCD characteristic with triangular shape typical for the ideal capacitor is observed. The specific capacitances were calculated from the discharge curves according to Eq. 7:

|
Download:
|
| Fig. 2. The CV curves of (a) RHC and (b) RHCB; the GCD curves of (c) RHC and (d) RHCB. | |

|
(7) |
Where I is the discharge current, m is the mass of one electrode, Δt is the time change, Δu is the voltage change. The specific capacitances of the RHC and RHCB electrode at different current densities were calculated according to GCD curves (Fig. 3a).

|
Download:
|
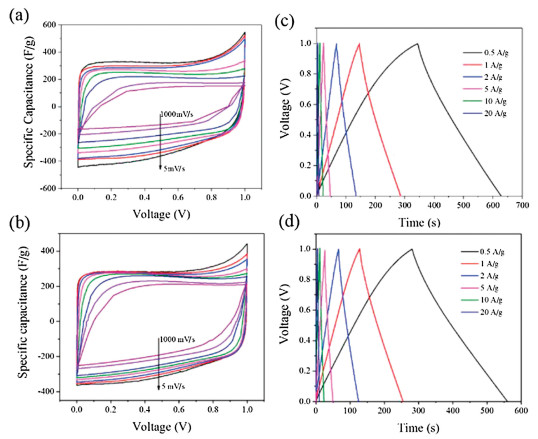
| Fig. 3. (a) The specific capacitances as a function of current density. The normalized real, the imaginary capacitances as a function of frequency for (b) RHC and (c) RHCB. (d) Ragone plots of the symmetric supercapacitor. | |
For the RHC electrode, the specific capacitance decreases from 315 F/g to 163 F/g as the current density increases from 0.5 A/g to 20 A/g, with capacitance retention of ca. 51.7%. This poor rate performance of RHC electrode is ascribed to its large diffusion resistance in the micropores. It is worth noting that, RHCB electrodes retains a high capacitance at the current density of 20 A/g compared with RHC. The specific capacitance of RHCB electrode is 278 and 213 F/g at 0.5 and 20 A/g, respectively. About 76.6% of specific capacitance is retained when the GCD current changes from 0.5 A/g to 20 A/g. The improved rate capability of RHCB is attributed to the much more mesoporous structure compared with RHC, enabling higher availability of electrolyte ions at a high rate.
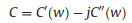
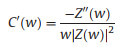
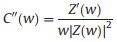
EIS is a nondestructive technique for understanding the electrochemical behavior and providing complementary information about the frequency response of the porous carbon electrode [18]. The impedance frequency behavior was investigated by the complex model of the capacitance (C (w)). It is well known that C (w) is dependent on real capacitance C'(w), the imaginary capacitance C"(w) related to the losses of energy dissipation and frequency, which is defined as follows:
|
(8) |
|
(9) |
|
(10) |
where Z'(w) and Z"(w) are the real and imaginary parts of the complex impedance Z(w). w is the angular frequency which is given by w = 2πf. The normalized C'(w) and C"(w) as a function of frequency for the RHC and RHCB electrodes are presented in Figs. 3b and c. It is obvious that the C'(w) gradually decreases with the increase of frequency for both electrodes, however, the capacitance of the RHCB electrode deteriorates more slowly than that of RHC electrode, which can be attributed to the fast ion diffusion and transport in the RHCB electrode. Besides, the characteristic relaxation time constant defined as τ0 = 1/fo (τo, the minimum time needed with an efficiency of greater than 50%) is obtained from the frequency (fo) of C"(w) at the maximum value. The fo is 2.51 Hz for the RHCB (Eqs. (8)–(10)), corresponding to the τo = 398 ms, which is much lower than that of RHC electrode (τo = 1002 ms, as shown in Figs. 3b and c) and other porous carbons [19, 20]. This result further demonstrates the fast accessibility of the RHCB electrode to the electrolyte ions and excellent rate capability at high scan rates with high power density characteristics. It indicates that the RHCB presents superior rate capability, in agreement with the results of CV and GCD test.
The energy density and the power density are important parameters to characterize the electrochemical performances of supercapacitor. Fig. 3d shows the Ragone plots of the symmetric supercapacitors based on the RHC and RHCB electrodes. The energy density and power density are calculated based on the following equations:

|
(11) |

|
(12) |
where CT is the specific capacitance of the symmetric supercapacitor based on the total masses of two electrodes, ΔV is the voltage range (V) and t is the discharge time (s).
As shown in Fig. 3d, with the increase of power density, the energy density of RHCB decreases slowly. When the power density increases from 125 W/kg to 6195 W/kg, the energy density decreases from 9.6 Wh/kg to 7.4 Wh/kg. However, the energy density of RHC fast decreases to 5.6 Wh/kg with the increase of power density, although the RHC shows a high energy density (as high as 10.9 Wh/kg). It can be concluded that RHCB electrode is capable of delivering high power without profound loss in energy, indicating a promising application in high power electrochemical capacitors [18]. On the contrary, the RHC electrode is suitable for high energy electrochemical capacitors.
From above results, RHC exhibits higher specific capacitance compared with RHCB. However, the RHC exhibits poorer rate capability compared with RHCB. Both RHC and RHCB show excellent performances compared with the activated carbon materials developed recently (Table S3 in Supporting information). The different electrochemical performances of two electrode materials are closely related to pore structure determined by the presence or absence of silica during KOH activation process.
In this paper, the rice husk based-activated carbons were prepared via KOH activation. The effects of the silica in RH in the activation process on pore structure and electrochemical performance of activated carbon are investigated by the removal of silica with NaOH or not before activation. When silica in RH is not removed, the silica preferentially reacts with KOH to product silicate. The new-born silicate, as a "shell", covers carbon, which hinders the reaction of KOH with carbon and the enlargement of pores. So, a large number of micropores are generated instead of the development of mesopores. This endows the RHC with a high specific area (as high as 3263 m2/g) but low mesoporous ratio (36.1%), which leads to the high specific capacitance (315 F/g at 0.5 A/g), high energy density (10.9 Wh/kg), but poor rate ability. When silica "template" in RH is removed, a large amount of pores are formed. In the initial stage of activation, the activating agent preferentially congregates in these pores, where these pores are enlarged to larger mesopores along with activation. This gives the RHCB with high mesopores ratio (73.5%). So, the RHCB exhibits excellent rate capability with capacitance retention of 77% when the current density is increased from 0.5 A/g to 20 A/g. In summary, by removing the silica in RH before the activation process, a porous carbon with a large mesoporous ratio and high rate capability can be obtained. Further work will be carried out to design pseudocapacitor using RHCB as supporting materials to replace the extensively used graphene oxide (GO) [21, 22].
AcknowledgmentsThe financial support from the National Key Research and Development Program (No. 2016YFC1102802), National Natural Science Foundation of China (No. 21273097), the Science and Technology Development Project of Jilin Province of China (No. 20130204003GX), the Thirteen Fifth Science and Technology Project of the Ministry of Education of Jilin Province (No. JJKH20181293KJ), and the Graduate Innovation Fund of Jilin University (No. 2015141) are gratefully acknowledged.
Appendix A. Supplementary dataSupplementary material related to this article can be found, in the online version, at doi:https://doi.org/10.1016/j.cclet.2019.02.031.
| [1] |
J. Liu, N.P. Wickramaratne, S.Z. Qiao, M. Jaroniec, Nat. Mater. 14 (2015) 763-774. DOI:10.1038/nmat4317 |
| [2] |
Y. Song, T. Liu, F. Qian, et al., J. Colloid Interface Sci. 509 (2018) 529-545. DOI:10.1016/j.jcis.2017.07.081 |
| [3] |
J. Xu, W. Zhang, D. Hou, W. Huang, H. Lin, Chin. Chem. Lett. 28 (2017) 2295-2297. DOI:10.1016/j.cclet.2017.10.041 |
| [4] |
W. Zhang, N. Lin, D. Liu, et al., Energy 128 (2017) 618-625. DOI:10.1016/j.energy.2017.04.065 |
| [5] |
D. Liu, W. Zhang, H. Lin, et al., J. Clean. Prod. 112 (2016) 1190-1198. DOI:10.1016/j.jclepro.2015.07.005 |
| [6] |
D. Liu, W. Zhang, H. Lin, et al., RSC Adv. 5 (2015) 19294-19300. DOI:10.1039/C4RA15111A |
| [7] |
D. Xu, X. Xiao, J. Cai, J. Zhou, L. Zhang, J. Mater. Chem. A 3 (2015) 16424-16429. DOI:10.1039/C5TA03917G |
| [8] |
G. Zu, J. Shen, L. Zou, et al., Carbon 99 (2016) 203-211. DOI:10.1016/j.carbon.2015.11.079 |
| [9] |
W. Tian, Q. Gao, W. Qian, ACS Sustain. Chem. Eng. 5 (2017) 1297-1305. DOI:10.1021/acssuschemeng.6b01390 |
| [10] |
W. Zhang, M. Zhao, R. Liu, X. Wang, H. Lin, Colloids Surf. A:Physicochem. Eng. Asp. 484 (2015) 518-527. DOI:10.1016/j.colsurfa.2015.08.030 |
| [11] |
W. Zhang, H. Lin, Z. Lin, et al., ChemSusChem 8 (2015) 2114-2122. DOI:10.1002/cssc.201403486 |
| [12] |
Q. Wang, X. Zhu, Y. Liu, et al., Carbon 127 (2018) 658-666. DOI:10.1016/j.carbon.2017.11.054 |
| [13] |
Z. Wang, A.T. Smith, W. Wang, L. Sun, Angew. Chem. Int. Ed. 57 (2018) 13722-13734. DOI:10.1002/anie.201802050 |
| [14] |
W. Zhang, J. Xu, D. Hou, et al., J. Colloid Interf. Sci. 530 (2018) 338-344. DOI:10.1016/j.jcis.2018.06.076 |
| [15] |
L. Yao, Q. Wu, P. Zhang, et al., Adv. Mater. 30 (2018) 1706054. DOI:10.1002/adma.201706054 |
| [16] |
J. Wang, S. Kaskel, J. Mater. Chem. 22 (2012) 23710-23725. DOI:10.1039/c2jm34066f |
| [17] |
Y. Zhu, S. Murali, M.D. Stoller, et al., Science 332 (2011) 1537-1542. DOI:10.1126/science.1200770 |
| [18] |
W. Zhang, Y. Lei, Q. Jiang, et al., Small Methods (2019) 1900005. |
| [19] |
M. Gao, S.Y. Pan, W.C. Chen, P.C. Chiang, Mater. Today Energy 7 (2018) 58-79. DOI:10.1016/j.mtener.2017.12.005 |
| [20] |
F. Xu, Z. Tang, S. Huang, et al., Nat. Commun. 6 (2015) 7221. DOI:10.1038/ncomms8221 |
| [21] |
X. Meng, L. Lu, C. Sun, ACS Appl. Mater. Interfaces 10 (2018) 16474-16481. DOI:10.1021/acsami.8b02354 |
| [22] |
Z. Xiong, P. Hu, Y. Zhang, et al., J. Electron. Mater. 47 (2018) 5987-5992. DOI:10.1007/s11664-018-6479-z |