 2019, Vol. 30


Petroleum is the most widely used energy source worldwide. However, all of the refined oils contain a certain amount of sulfocompound, usually in the form of organic sulfur, varying from less than 0.1 wt% to over 5 wt% [1]. The sulfur contents have a damaging effect during the processing and utilisation of oils, corroding the equipment, polluting the living environment and posing risks to human health. Thus, there is an increasing need for desulfurization.
A variety of methods including hydrodesulfurization [2], adsorption [3], oxidation [4] and biodesulfurization [5] have been considered for desulfurization, among which hydrodesulfurization is the most mature and widely used one in the oil refining industry today. However, hydrodesulfurization has some disadvantages, such as reduction of the octane number, high temperature (300– 400 ℃) and pressure (10–200 atm) [6-8], consuming hydrogen, and does not show an effective removal of thiophene and its derivatives. Comparatively, adsorptive desulfurization has been more attractive because of its mild operating conditions and favourable effect on the removal of thiophene and its derivatives.
Recently, various porous materials, such as activated carbon [9], metal oxides [10], silicones [11], zeolites [12], and metal-organic frameworks (MOFs) [13], have been investigated for their applicability in the adsorptive removal of thiophenes. Among them, MOFs have attracted more attention because of the high porosities, varying pore sizes and shapes, and easy modification [14-17]. It has been reported that the MOF-199 with high specific surface area (950 cm2/g) and large pore volume (0.95 cm3/g) has a significant desulphurisation capacity for both thiophene [18] and BT [19]. The mechanism of adsorptive desulfurization has also been studied. The electrostatic interactions between the electric field generated by the MOFs and the dipole moment of thiophene [20], as well as the interactions of the central metal ions of the framework with the adsorbates [21] have been identified as plausible explanations for the adsorptive desulfurization mechanism. Particularly, in terms of Pearson's concept of hard and soft acids and bases, the soft bases BT and DBT are more attracted to the soft acids Cu+ and Ag+ [22].
However, aromatics in fuel oils have strong competition with sulfur-containing compounds in the process of adsorption desulfurization due to their similar structures, which limits the adsorption performances of the adsorbents [23-26]. For example, activated carbons have good adsorption capacities in model fuels, while the performances in real diesel fuels decreased by 10 times [27] due to the insufficient selectivity for sulphur-containing aromatic compounds. According to the study of Peralta [20], MOFs of HKUST-1 and CPO-27-Ni performed high selectivity for thiophene in comparison with other materials. Han et al. [28] applied a nanotubular MOF BUT-51 in selective dye adsorption. The result implied that the adsorption behaviour of BUT-51 follows not only a charge- but also size- and shape-exclusive effect. However, there have not been enough studies about the selective adsorption of MOFs in aromatics/thiophenics system yet. So, in order to apply the MOFs in adsorptive desulphurisation, it will be meaningful to investigate MOFs with high selectivity for thiophenics versus aromatics.
As reported, most of the MOFs appiled for adsorptive desulfurization needed to be synthesized at high temperature (110–220 ℃) [29-31], while MOF-101 (Cu2[o-Br-C6H3(CO2)2]2(- H2O)2·(DMF)8(H2O)2) [32] can be synthesised at room temperature and has not been studied for its adsorption capabilities. Therefore, in this study, MOF-101 was synthesised at a relatively low temperature (70 ℃), and modified by loading Ag+ on the surface of MOF-101. Model fuels were made by adding toluene and DBT into n-octane to investigate the adsorption capacity and sulfur/ aromatic selectivity of composite material Ag+/MOF-101 prepared.
The materials used in this work were as follow: 2-Bromoterephthalic acid (C8H5O4Br, 98%) was purchased from Nanjing Shengbicheng Chemical Technology Co., Ltd. Cupric nitrate trihydrate (Cu(NO3)2·3H2O, 99%) was purchased from Tanjin Yuanli Chemical Co., Ltd. Silver nitrate (AgNO3) was purchased from Aladdin. N-dimethylformamide (DMF; C3H7NO, > 99.8%) was purchased from Alfa Aesar. n-octane (C8H18, 99%), dibenzothiophene (DBT; C12H8S, 98%), and methanol (HPLC grade) were purchased from Shanghai Macklin Biochemical Co., Ltd. All reagents were of analytical grade and used without further purification.
MOF-101 was synthesised by a solvothermal method in the laboratory according to lecture [32]. Briefly, equimolar amounts of o-Br-BDC acid (0.41 g, 1.64 mmol) and Cu(NO3)2·3H2O (0.4 g, 1.64 mmol) were added into 40 mL DMF and reacted in a capped vial at 70 ℃ for 24 h. After the reaction, the blue crystals obtained were filtered and rinsed with DMF for at least five times, and then dried in a vacuum drying oven at 50 ℃ for 8 h.
Ag+/MOF-101 was further synthesised based on MOF-101. AgNO3 solutions with different concentration were prepared by dissolving 0.02 g, 0.05 g and 1.0 g AgNO3 salt in 20 mL DMF. 0.1 g MOF-101 and the AgNO3 solutions prepared were placed into a Teflon-lined autoclave (50 mL) and mixed well. The mixture reacted at 70 ℃ for 8 h. After the reaction, the solid product was filtered and rinsed with DMF at least five times, and then immersed in DMF for preservation. The composite adsorbents with different mass ratios of AgNO3/MOF-101 (0.02, 0.05, 0.1) were named Ag+/ MOF-101 (L), Ag+/MOF-101 (M) and Ag+/MOF-101 (H) respectively.
The model oil A was prepared by dissolving DBT in n-octane. Solutions of different concentration (50–1500 ppmS) were prepared by successive dilutions of the stock solution with n-octane. The model oil B was prepared by adding 5% toluene (mass ratios) on the basis of A.
The characterization methods and conditions were as follows. The crystal structures and phases of the samples were determined by X-ray diffraction (XRD) on a diffractometer using Cu Kα radiation (λ = 0.15405 nm) operated at 2000 W power (50 kV, 40 mA) and a scanning rate of 10°/min in the 2θ range from 5° to 70°. Fourier transform infrared (FT-IR) spectra were recorded on a Nicolet FTIR-170SX spectrometer with KBr pellets in the range of 400 - 4000 cm-1. Sample compositions were examined using fieldemission scanning electron microscopy and energy-dispersive Xray spectroscopy (SEM-EDS; S-4800, Hitachi) at an accelerating voltage of 3 kV. Element Ag in the synthesised composites was determined by X-ray fluorescence spectroscopy (XRF; S4 Pioneer, Bruker AXS) at 40 kW. Thermogravimetric analysis (TGA) curves were obtained with a simultaneous thermal analyser (STA449F3 Jupiter, Netzsch) from 35 ℃ to 800 ℃ under an air atmosphere at a heating rate of 10 ℃/min. The N2 adsorption-desorption isotherms of adsorbents were measured at 77 K on an ASAP-2020 (Micrometrics USA).
Adsorption tests were carried out as follow. Before adsorption, the adsorbents were activated under vacuum at 50 ℃ for 8 h. The concentration of DBT and toluene were determined by HPLC using a gradient elution program, and the mobile phase (methanolwater) was changed from 90% methanol to 100% over 10 min, with a flow rate of 1.0 mL/min.
In deep desulfurization experiments, adsorbents were used based on nearly the same mass of MOF-101. 5.0 g MOF-101, 5.1 g Ag+/MOF-101(L), 5.2 g Ag+/MOF-101(M) and 5.3 g Ag+/MOF-101(H) were respectively added into flasks filled with 10 g 50 ppmS model oil A, and then placed in a shaking table at atmospheric pressure and 30 ℃ for 24 h. The adsorbents used in experiments are sufficient to adsorb DBT in model oil A.
In adsorption selectivity experiments, 0.1 g adsorbents were added into flasks filled with 40 g model oil B, and then placed in a shaking table at atmospheric pressure and 30 ℃ for 24 h. The selectivity values (αi/j) were obtained to quantify the competitive adsorption capacity of DBT (i) versus toluene (j). The adsorption selectivity (αi/j) was calculated as follows:

|
(1) |
where Q (mg/g) is the quantity of i or j adsorbed and C (mg/L) is the concentration of compound i or j in solution at equilibrium.
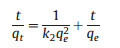
In adsorption capacity experiments, 0.1 g adsorbents were added into flasks filled with 40 g model oil A, and then placed in a shaking table at atmospheric pressure and 30 ℃ for 3 h. The kinetic progress of adsorption was calculated by the pseudo-second-order kinetic equation:
|
(2) |
where k2 (g mgS-1 h-1) is two class balance rateconstant; t (h) is adsorption time; qe (mgS/g) is the equilibrium adsorbing quantity; qt (mgS/g) is the adsorbing quantity at time t [33].
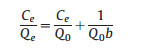
The maximum adsorption capacity (Q0) was calculated based on the Langmuir adsorption isotherm. The dates were obtained after adsorption for 24 h, which was considered to be an ample time for adsorption equilibrium. The adsorption isotherms for different adsorbents were plotted according to the Langmuir equation:
|
(3) |
where Q0 (mgS) is the Langmuir constant (maximum adsorption capacity); b (g/mg) is the Langmuir constant; Ce (ppmS) is the solution concentration at equilibrium [34].
The result and discussion for this work were presented in two parts. Firstly is the characterisation of adsorbents. The crystal structure of the synthesised MOF was confirmed to be MOF-101 by the XRD in Fig. 1. As shown in Fig. 1a, the relatively high-intensity diffraction peaks of the synthesised MOF-101 were in accordance with the simulated pattern previously reported [31]. Fig. 1b showed the XRD patterns from 2θ 35° to 70°. As shown in Fig. 1b, the characteristic peaks at 2θ = 38.6° marked with '*' corresponded to the {101} crystal surface of hexagonal Ag2O, suggesting the successful loading of Ag+.

|
Download:
|
| Fig. 1. XRD patterns of (a) MOF-101 (black, simulated; blue, synthesised) and synthesised Ag+/MOF-101 (red) and (b) various Ag+-adsorbent composites in the high 2θ region. Ag+(0), Ag+(L), Ag+(M), and Ag+(H) contained mass ratios of Ag+ to the supporting adsorbent of 0, 0.3, 0.6, and 1.2, respectively. | |
The IR spectrums of MOF-101 and Ag+/MOF-101 were shown in Fig. S1 (Supporting information). The IR spectrums of synthesized MOF-101 and Ag+/MOF-101 were almost the same, indicating that there were no new functional groups introduced by the loading of Ag+, and the composition and structure of functional group in MOF-101 have not been changed significantly. As shown in Fig. S1, the broad bands near 3440 cm-1 were ascribed to the vibration modes of hydroxyl groups and H - O–H in surface-adsorbed water. Meanwhile, the bands near 1681 -1550 cm-1 and 1430 -1340 cm-1 were ascribed to the asymmetric and symmetric stretching of the carboxylate groups of Br-BDC respectively, and the bending modes of C - Br appeared at 567 cm-1 [35].
In order to further verify the composition of the prepared materials, the as-synthesised MOF-101 and Ag+/MOF-101 were examined by TGA. As shown in Fig. S2 (Supporting information), rapid weight losses of approximately 48% (MOF-101) and 58% (Ag+/ MOF-101) were observed below 100 ℃, corresponding to the liberation of all eight DMF guests and two water guests per formula unit (expected loss was calculated to be 50.7%) [32]. The 10% greater weight loss observed in the first step in Ag+/MOF-101 as compared to that in MOF-101 was attributed to the evaporation of introduced Ag+ particles. Two other weight loss steps at 100– 280 ℃ and 280–310 ℃ were attributed to the loss of water ligands and decomposition of the framework, respectively.
The presence of Ag element and the surface characteristics of the as-synthesised MOF-101 and Ag+/MOF-101 were confirmed by XRF and SEM-EDS analyses. As shown in Fig. S3 (Supporting information) demonstrated a homogeneous distribution of the introduced Ag+ particals on the surface of MOF-101. In addition, as shown in Figs. S4a and b (Supporting information), the supporting material MOF-101 was a layered structure formed by stacking sheets with slit-like channels. It was presumed that the rough surface morphology was resulted from partial collapse of the crystal structures caused by the vacuum process. As shown in Fig. S4d (Supporting information), the lattice fringe m distance was found to be 0.246 nm, corresponding to the {002} crystal surface of Ag2O, which further proved the successful loading of Ag+ on MOF- 101.
The pore structure of MOF-101 and Ag+/MOF-101 materials was analyzed by N2 adsorption-desorption method. As shown in Fig. S5 (Supporting information), H3 hysteresis loops appeared in the N2 adsorption-desorption curves of MOF-101 and Ag+/MOF-101. The H3 hysteresis loops indicated that there were narrow slit-like channels formed by the accumulation of sheet particles in MOF- 101 and Ag+/MOF-101, which were basically consistent with the results of SEM. At the same time, the loading of Ag+ increased the specific surface area and pore volume of the compound material. The BET surface area and DFT pore volume was calculated to be 173.4 m2/g and 0.624 cm3/g for Ag+/MOF-101, and 41.6 m2/g and 0.112 cm3/g for bare MOF-101.
Meanwhile, the results of adsorption performance tests were discussed and listed in Table 1. As shown in Table 1, the deep desulfurization performance of Ag+/MOF-101 is better than that of MOF-101. Ag+/MOF-101(M) showed the best performance among the adsorbents tested, and the concentration of sulfur in model A was reduced from 50 ppm to 10.2 ppm. It can be inferred that a favorable interaction existed between the loaded Ag+ and the adsorbate DBT. The optimization impact of Ag+ loadings on the adsorbate was further studied in selective adsorption tests.
|
|
Table 1 Deep desulfurization experiments for DBT |

In order to investigate the sulphide/aromatic hydrocarbons selectivity of synthesized absorbents, adsorption experiment was carried out in simulated oil B which contains toluene, and the results were shown in Fig. 2. The adsorption selectivity (αi/j) was calculated by Eq. (1) and shown in Table S1 (Supporting information).

|
Download:
|
| Fig. 2. Adsorption amounts of DBT and toluene in model oil A and B over different adsorbents. Adsorption conditions: model oil 40 g; adsorbent 0.1 g; adsorption time 3 h; temperature 30 ℃. | |
As shown in Fig. 2, for DBT, the adsorptive capacity of Ag+/MOF- 101 was usually lower than that of MOF-101 in model oil A. The decrease of adsorptive capacity was caused by the blocking of loaded particles on the interlayer and surface of MOF-101. The result showed that the effective adsorption sites for DBT was mainly provided by MOF-101 in the composite material Ag+/MOF- 101, rather than the loaded Ag+ particles. The conclusion was consistent with the study of McKinley [36] that Ag+ ions in Ag+/ SBA-15 did not act as DBT or 4, 6-Me2DBT adsorption sites.
It also can be seen from Fig. 2 that for each adsorption material, the adsorption capacity for DBT in model oil B was lower than that in A, which was caused by the competitive adsorption between toluene and DBT. For MOF-101, the competition from toluene reduced the adsorption of DBT by 56.7%. But for Ag+/MOF-101(M), the adsorption of DBT decreased by only 4.5% under the same condition, which is much lower than that of MOF-101. It indicated that Ag+ loadings can significantly weaken the adsorption competitiveness of toluene. Moreover, as shown in Fig. 2 and Table S1, in model oil B, Ag+/MOF-101 achieved larger adsorption capacity and higher selectivity for DBT. Ag+/MOF-101(M) demonstrated the highest selectivity (α = 3.31) and the largest adsorption capacity (1.48 mmol DBT per g of adsorbent). It indicated that Ag+ played a role of picker to select more target adsorbate DBT.
In order to explain the enhancement of deep desulfurization and selective adsorption for DBT over Ag+/MOF-101, several factors can be invoked: (ⅰ) According to Pearson's concept of hard and soft acids and bases, the central ions Cu2+ in MOF-101 did not act as soft acid and behaved no special attractions for DBT, while Ag+, as a soft acid, was more attractive to soft base DBT than toluene. (ⅱ) The loading of Ag+ enhanced the electric field generated by the framework and strengthened the electrostatic interactions between the framework and DBT. (ⅲ) The polarizability of DBT is higher than that of toluene (23.9 × 10⁻²⁴ cm3 vs. 12.3 ×10⁻²⁴ cm3), so the pure dispersion forces also favored the adsorption of DBT.
For Ag+/MOF-101, the decrease of adsorption capacity was contrary to the result of the deep desulfurization, which was related with the DBT concentration in model oils. The deep desulfurization experiments were carried out at very low concentration, in which the MOF-101 was excessive and provided sufficient adsorption sites for DBT. So the loss of adsorption sites of Ag+/MOF-101 caused by Ag+ loadings did not influence the adsorption of DBT.
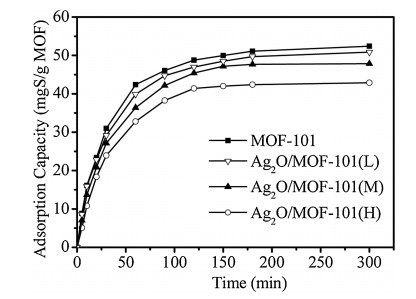
In addition, the adsorption capacity of synthesized adsorbents with various Ag+ loadings was investigated, and the results were shown in Fig. 3. As shown in Fig. 3, adsorptive desulfurization capacity of different adsorbents almost reached a plateau in 180 min, being 52.4, 50.9, 47.8 and 42.7 mgS/g for MOF-101, Ag+/ MOF-101(L), Ag+/MOF-101(M) and Ag+/MOF-101(H), respectively. The kinetic progress of adsorption can be calculated by the pseudosecond-order rate equation. Table S1 showed the adsorption kinetic constants calculated by the pseudo-second-order rate equation. As shown in Table S1, the adsorption constant k2 of Ag+/ MOF-101 decreased slightly with the growing loading of Ag+, which was related with the blocking of loaded particles on the interlayer and surface of MOF-101.

|
Download:
|
| Fig. 3. Effect of time on adsorptive desulfurization capacity for DBT of MOF-101 and Ag+/MOF-101. Adsorption conditions: model oil 40 g; adsorbent 0.1 g; [DBT] 1000 ppmwS; temperature 30 ℃. | |
For the Ag+-supported adsorbents, Ag+/MOF-101(M) showed the best adsorptive performance in deep desulfurization and selective adsorption. Therefore, the adsorption isotherms of Ag+/ MOF-101(M) and the virgin MOF-101 were studied (Fig. S6 in Supporting information). The adsorption isotherms have been plotted following the Langmuir equation, and the maximum adsorption capacities Q0 were summarized in Table S1: Q0 was 66.8 mgS/g for MOF-101 and 61.4 mgS/g for Ag+/MOF-101, which was consistent with the experimental results. It further indicated that the blocking of loaded particles would reduce the number of effective adsorption sites for DBT.
In summary, MOF-101 was successfully synthesized by solvothermal method at 70 ℃ and modified by loading Ag+ to improve the selective adsorption performance. The supporting material MOF-101 was a layered structure formed by stacking sheets with slit-like channels. For Ag+/MOF-101, Ag2O particles were uniformly loaded on the interlayer and surface of MOF-101, without new functions. Through the adsorption experiments, it was found that the supporting material MOF-101 provided effective adsorption sites for DBT. The loading of Ag+ enhanced the deep adsorptive desulfurization capacity of DBT at low concentration, and raised the selective adsorption of DBT versus toluene in the competitive system of sulphide/aromatic hydrocarbons. The adsorption performance was related with the introducing of soft acid Ag+ and the enhancement of electric field generated by the frameworks. Due to the loading of Ag+ particles, both of the adsorption capacities Q0 and the adsorption constant k2 of MOF-101 were larger than those of Ag+/MOF-101.
Appendix A. Supplementary dataSupplementary material related to this article canbefound, in the online version, at doi:https://doi.org/10.1016/j.cclet.2019.02.029.
| [1] |
M.F. Ali, Al-Malki A., El-Ali B., G. Martinie, M.N. Siddiqui, Fuel 85 (2006) 1354-1363. DOI:10.1016/j.fuel.2005.12.006 |
| [2] |
I. Mochida, K. Sakanishi, X.L. Ma, S. Nagao, T. Isoda, Catal. Today 29 (1996) 185-189. DOI:10.1016/0920-5861(95)00262-6 |
| [3] |
X.L. Tang, X. Meng, L. Shi, Ind. Eng. Chem. Res. 50 (2011) 7527-7533. DOI:10.1021/ie200475x |
| [4] |
S. Otsuki, T. Nonaka, N. Takashima, et al., Energy Fuels 14 (2000) 750-753. |
| [5] |
D.J. Monticello, Curr. Opin. Biotechnol. 11 (2000) 540-546. DOI:10.1016/S0958-1669(00)00154-3 |
| [6] |
van Looij F., van der Laan P., W.H.J. Stork, D.J. DiCamillo, J. Swain, Appl. Catal. A:Gen. 170 (1998) 1-12. DOI:10.1016/S0926-860X(98)00028-3 |
| [7] |
A.V. Spare, D.H. Broderick, D. Fraenkel, B.C. Gates, N.K. Nag, AIChE J. 26 (1980) 690-694. DOI:10.1002/(ISSN)1547-5905 |
| [8] |
X.L. Ma, K. Sakanishi, I. Mochida, Ind. Eng. Chem. Res. 33 (1994) 218-222. DOI:10.1021/ie00026a007 |
| [9] |
C.O. Ania, T.J. Bandosz, Langmuir 20 (2005) 7752. |
| [10] |
H.Y. Zhang, G.B. Shan, H.Z. Liu, J.M. Xing, Surf. Coat. Technol. 201 (2007) 6917-6921. DOI:10.1016/j.surfcoat.2006.11.043 |
| [11] |
S.G. Mckinley, R.J. Angelici, Chem. Commun. 21 (2003) 2620-2621. |
| [12] |
K. Tang, L.J. Song, L.H. Duan, et al., Acta Phys.-Chim. Sin. 22 (2006) 1116-1120. |
| [13] |
K.A. Cychosz, Wong-foy A.G., A.J. Matzger, J. Am. Chem. Soc. 130 (2008) 6938. DOI:10.1021/ja802121u |
| [14] |
S.H. Jhung, N.A. Khan, Z. Hasan, CrystEngComm 43 (2012) 7099-7109. |
| [15] |
van de Voorde B., B. Bueken, J. Denayer, de Vos D., Chem. Rev. 43 (2014) 5766-5788. |
| [16] |
J.R. Li, J. Sculley, H.C. Zhou, Chem. Rev. 112 (2012) 869-932. DOI:10.1021/cr200190s |
| [17] |
B. Wang, H. Yang, Y.B. Xie, et al., Chin. Chem. Lett. 27 (2016) 502-506. DOI:10.1016/j.cclet.2015.12.034 |
| [18] |
A. Sabine, H. Gunter, K. Jaroslaw, et al., Sensors 9 (2009) 1574-1589. DOI:10.3390/s90301574 |
| [19] |
Blanco-Brieva G., Campos-Martin J.M., Al-Zahrani S.M., J.L.G. Fierro, Fuel 90 (2011) 190-197. DOI:10.1016/j.fuel.2010.08.008 |
| [20] |
D. Peralta, G. Chaplais, Simon-Masseron A., K. Barthelet, Energy Fuels 26 (2012) 4953-4960. DOI:10.1021/ef300762z |
| [21] |
N.A. Khan, S.H. Jhung, J. Hazard. Mater. 260 (2013) 1050-1056. DOI:10.1016/j.jhazmat.2013.06.076 |
| [22] |
J. Xiao, Z. Li, B. Liu, Q.B. Xia, Energy Fuels 22 (2008) 3858-3863. DOI:10.1021/ef800437e |
| [23] |
J. Xiao, C.H. Song, X.L. Ma, L. Zhong, Ind. Eng. Chem. Res. 51 (2012) 3436-3443. DOI:10.1021/ie202440t |
| [24] |
Laborde-Boutet C., G. Joly, A. Nicolaos, M. Thomas, Ind. Eng. Chem. Res. 45 (2006) 6758-6764. DOI:10.1021/ie060168e |
| [25] |
M.L.M. Oliveira, A.A.L. Miranda, C.M.B. Barbosa, et al., Fuel 88 (2009) 1885-1892. DOI:10.1016/j.fuel.2009.04.011 |
| [26] |
W. Wardencki, R.J. Staszewski, J. Chromatogr. A. 91 (1974) 715-722. DOI:10.1016/S0021-9673(01)97952-X |
| [27] |
K.A. Cychosz, Wong-Foy A.G., A.J. Matzger, J. Am. Chem. Soc. 313 (2009) 14538-14543. |
| [28] |
Y. Han, S.N. Sheng, F. Yang, et al., Mater. Chem. A. 3 (2015) 12804-12809. DOI:10.1039/C5TA00963D |
| [29] |
N.A. Khan, C.M. Kim, S.H. Jhung, Chem. Eng. J. 311 (2017) 20-27. DOI:10.1016/j.cej.2016.11.067 |
| [30] |
L.B. Qin, Y.S. Zhou, D.Q. Li, et al., Ind. Eng. Chem. Res. 55 (2016) 7249-7258. DOI:10.1021/acs.iecr.6b01001 |
| [31] |
X.Q. Zhao, C.L. Xin, Y.C. Yin, et al., Adsorpt. Sci. Technol. 30 (2016) 483-490. |
| [32] |
E. Mohamed, K. Jaheon, O. Michael, Y. Omar, J. Am. Chem. Soc. 124 (2002) 376-377. DOI:10.1021/ja017154e |
| [33] |
Y.S. Ho, G. McKay, Process Biochem. 34 (1999) 451-465. DOI:10.1016/S0032-9592(98)00112-5 |
| [34] |
Z. Hasan, J. Jeon, S.H. Jhung, J. Hazard. Mater. 209 (2012) 151-157. |
| [35] |
H.R. Dong, Instrumental Analysis, 3rd Ed., Chemical Industry Press, Beijing, 2016, pp. 193-211.
|
| [36] |
S.G. Mckinley, R.J. Angelici, Chem. Commun. 20 (2003) 2620-2621. |