 2019, Vol. 30


b College of Materials Science and Optoelectronic Technology, University of Chinese Academy of Sciences, Beijing 100049, China
Protein is the foundation of living matters and plays a very vital role in various life activities. The structure of protein can be distinguished as primary structure, secondary structure, tertiary structure and quaternary structure, among which the secondary structure is of great significance. The secondary structure [1, 2] refers to the repeated conformation of the main chain in the polypeptide, including α-helix, β-sheet, β-turn, random coil, and the secondary structure of proteins was mainly maintained by hydrogen bonds between carbonyl oxygen atoms and amino hydrogen atoms in different amide bonds on the peptide chain. The polypeptide and protein repeating units have nine characteristic bands, in which amide Ⅰ and amide Ⅱ bands are the main vibrational bands of the protein secondary structure [3-5]. Amide I band is caused by C=O stretching vibrations and mainly located in 1600–1690 cm-1 region; amide Ⅱ band in 1480–1580 cm-1 region, is mainly derived from in-plane NH bending (40%–60%) and CN stretching vibration (18%–40%), showing much less conformational sensitivity than amide Ⅰ band [3].
The conformation of protein great influents on its physiological function and activity. Structural changes of protein often induce the changes of protein function, leading to a series of diseases or problems. Some neurodegenerative diseases [6, 7], such as bovine spongiform encephalopathy, transmissible spongiform encephalopathies and Creutzfeldt–Jakob disease have been found to be related to the prion conformation. The conformations misfolding plays an important role in the pathogenicity of the prion protein. Moreover, Lixin Peng [8] used FTIR-HATR to study the differences of hemoglobin between normal people and β-severe thalassemia patients, observed the difference of protein composition and structure in thalassemia. Zhihua Mao [9] utilized FTIR technologies to study normal and diseased cartilage tissue and found that the amide Ⅰ band intensity and position were different in their IR spectra, which indicated the changes of secondary structure of diseased cartilage tissue.
At present, many approaches have been applied to study protein secondary structure. Although X-ray crystal diffraction (XRD) [10], nuclear magnetic resonance technology (NMR) [11-13], circular dichroism (CD) [14, 15], UV [16] and fluorescence spectroscopy [17, 18] can provide a lot of protein structure information, it is still needed to develop a fast and non-destructive approach to collect information in aqueous environment.
Spectroscopy has been used for studying conformation of protein since past decades. FTIR is an ideal technology for rapid and non-destructive detection to biological samples, because it can give the information of biological samples in minutes, and does not require harmful reagent, kill the live cells, and break the chemical structures [19, 20]. Limited by the sensitivity of IR instrument and the interference of water to protein absorption band, the early studies focused on dry powder and heavy water state [21, 22]. Some methods had been developed to avoid water interference, such as introduction of N2 or dry air into the IR instrument [4], or development of infrared accessories that could detect proteins in aqueous solutions, such as, attenuated total reflection technology [23]. ATR is particularly suitable for in-situ sample measurements in the aqueous environment. When a beam of infrared light enters the ATR crystal from air, a kind of evanescent wave is produced on the outer surface of the crystal during the process of attenuating total reflection. When the sample is in contact with the outer surface of the crystal, evanescent wave can penetrate into the sample and the absorption information of the sample can be obtained from the attenuation energy of the evanescent wave [24].
BSA is a serum albumin protein derived from cows which is often used in lab experiments. BSA forms three similar domains with 583 amino acids, 17 pairs of disulfide bonds are formed on the molecular chain [25], which contains phosphoric acid-modified threonine, serine and tyrosine, and contains Ca2+ binding sites, the molecular weight is 66, 400 (Fig. S1 in Supporting information).
The in-situ ATR-FTIR spectra had minor differences in band shape and position with the increase of the time, but the band intensity gradually increased, indicating that the adhesion of BSA on the ZnSe IRE surface slightly increased with time (Fig. 1A). The water showed broad negative bands (3000–3600 cm-1), indicating that the displacement of water from the surface of ZnSe IRE due to BSA adsorption [26]. If need for quantitative analysis of the secondary structural components of the BSA solution, it was critical that the absorption by water accurately compensated.

|
Download:
|
| Fig. 1. FTIR spectra of BSA. A: in-situ ATR mode for BSA aqueous solution in 0–5 h, the interval of spectra was 1 h. B: the black spectrum was collected in transmittance mode for dry BSA powder, the red one was collected in ATR mode for BSA aqueous solution, two spectra were normalized to the same intensity scale for ease of comparison. | |
In Fig. 2B, the spectrum of BSA dry powder showed strong bands in 3600-3000 cm-1 which indicated stretch vibrational mode of N-H and O-H functional groups, and the amide Ⅰ and amide Ⅱ bands appeared at 1654.6 cm-1 and 1540.9 cm-1, respectively. The ATR-FTIR spectrum of BSA in aqueous environment showed amide Ⅰ and amide Ⅱ bands appeared at 1652.8 cm-1 and 1545.7 cm-1, respectively. The amide bands shift indicated the backbone structural change of the BSA. 2920-2870 cm-1 regions were the C-H stretching vibration of CH3 and CH2, and these peaks were present in both spectra.

|
Download:
|
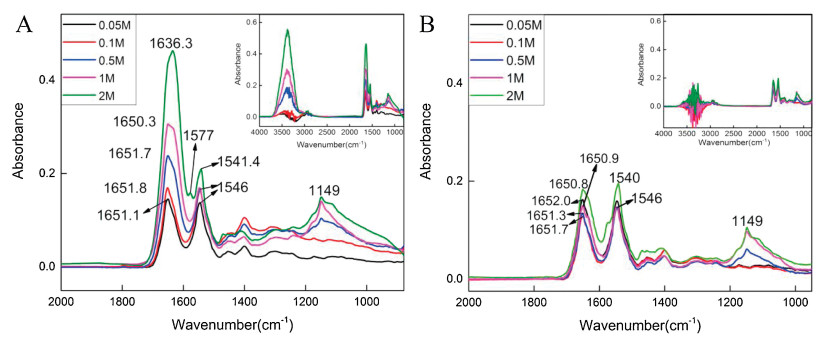
| Fig. 2. The FTIR spectra of BSA with different concentration of calcium cations at 2 h after the samples were added into the ATR trough. A: water as background; B: The same concentration of calcium cations as background. | |
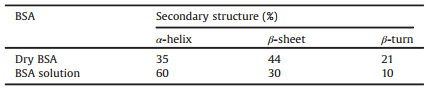
The amide Ⅰ band of BSA in aqueous solution red shifted 1.8 cm-1 to lower wavenumber and the amide Ⅱ band blue shifted 4.8 cm-1 toward higher wavenumber when compared with the spectrum of dry BSA powder. After BSA was dispersed into water, new hydrogen bonds formed between amide groups and water molecules, which led to the decrease of electron cloud density of the C=O, and the increase of electron cloud density of C-N. As a result, the amide Ⅰ band red shifted and the amide Ⅱ band blue shifted. The part of the secondary structure of BSA had been calculated by processing their spectra by curve fitting method (Fig. S2 in Supporting information), and the results were listed in Table 1.
|
|
Table 1 Calculated secondary structure of BSA in two conditions. |
Calcium cations were introduced into BSA solution to further figure out the effect of hydrogen bonds. Calcium cations were hydrated with a lot of water molecules, and the higher concentration of calcium cations, the more intensity of water in the IR spectra (Fig. S3 in Supporting information).
Comparing different concentrations of calcium cations in BSA aqueous solution, it was found that the higher concentration of calcium cations, the greater influence on amide Ⅰ band and the more water was detected on the ZnSe IRE surface, which indicated that more hydrated calcium cations were captured by BSA on the surface in Fig. 2. Fig. 2A used water as background, and Fig. 2B used the solution of the same concentration of calcium cations as background.
In Fig. 2, the spectra obtained using different backgrounds showed water effect at 3600–3000 cm-1. Apparently, the hydrated calcium cations carried a large number of water molecules. In Fig. 2A, with the increase of calcium cations concentration, amide Ⅰ bands were gradually red shift from 1651.1 cm-1 to 1636.3 cm-1, and the band area increased significantly, while amide Ⅱ bands were blue shift from 1546 cm-1 to 1541.4 cm-1, and the band area gradually decreased. The hydrated calcium cations was captured by BSA and brought a lot of water molecules to the polypeptide chain, which allowed C=O to interact with more water molecules and resulted amide Ⅰ band shift due to the rearrangement of the amide electron cloud density. In Fig. 2B, amide Ⅰ bands were gradually red shift from 1652 cm-1 to 1650.9 cm-1, and amide Ⅱ bands were blue shift from 1546 cm-1 to 1540 cm-1 with the increase of the concentration of calcium cations. The effect of water was significantly smaller in amide Ⅰ band than in Fig. 2A. When calcium cations concentration was less than 0.5 mol/L, the spectra obtained by the two methods showed little differentia, which indicated that the effect of low concentration of calcium cation was very small and it was hard to be distinguished from the spectra. When calcium cation concentration rose greater than 0.5 mol/L, the intensity of the bands increased not only the amide Ⅰ band, but also at 1149 cm-1 which was assigned to the P=O group stretching mode. It indicated that the change of conformation of BSA mainly occurred at the backbone of the protein with the concentration of calcium cations below 0.5 mol/L, and both the backbone and side chain of the protein contributed to the conformation change with the concentration of calcium cations above 0.5 mol/L.
Three types of amino acids in BSA had hydrophilic phosphate groups, as showed in Fig. S1. Therefore, there was phosphate in the BSA aqueous solution. The addition of higher concentration of calcium cations caused precipitation with phosphate could be observed. Z-average size of BSA in aqueous environment with different concentrations of calcium cations was shown in Fig. 3, apparently, the BSA was aggregated fast with the increase of calcium cation concentration. The sample was not qualified for Zaverage measurement due to the aggregation above 1 mol/L. When the concentration of calcium cations reached 2 mol/L, a band at 1577 cm-1 appeared in the spectrum and it was assigned to the COO- asymmetric stretching mode. The amide Ⅱ band red shifted about 6 cm-1 to lower wavenumber (Fig. 2). The high concentration calcium cations induced the COO- groups facing outward and allowed them to be detected with IR, and the calcium cations further interacted with the amide groups, thereby changing the position of the amide Ⅱ band.

|
Download:
|
| Fig. 3. The curve of Z-average size of BSA aqueous solution with different concentrations of Ca2+, the BSA solution concentration was about 1.2 ×10⁻⁴ mol/L, using a Zetasizer Nano ZS instrument, the error bars represent the standard deviation of the measurement. | |
The second derivative and curve fitting process had been applied to analyze the spectra in Fig. 2, and the calculated results were present in Tables 2 and 3. Fig. 4 showed the example of mathematical analysis of BSA spectra in 1710–1600 cm-1, and the components of secondary structure had been demonstrated.
|
|
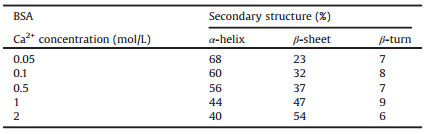
Table 2 Calculated secondary structure of BSA, spectra used in Fig. 2A. |
|
|
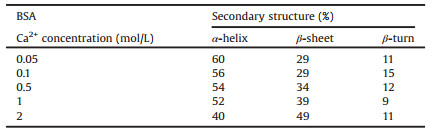
Table 3 Calculated secondary structure of BSA, spectra used in Fig. 2B. |

|
Download:
|
| Fig. 4. Mathematical analysis of secondary structure of BSA. A: "Fig. 2A, 1 mol/L Ca2+" and B: "Fig. 2B, 1 mol/L Ca2+". | |
The percentage of α-helix were calculated by the relative area of 1660–1650 cm-1 region, the percentage of β-sheet were calculated by adding all the β-sheet bands between the 1698–1690 cm-1 and 1642–1623 cm-1 regions, the band area at 1687-1666 cm-1 regions were assigned to β-turn [3]. Table 2 showed that with the increased of calcium cation concentration, the percentage of α-helix decreased, while β-sheet gradually increased, and the percentage of β-turn kept constant with the concentration of calcium cations. The results showed that the α-helix element was gradually transformed into β-sheet by increasing the concentration of calcium cation in BSA aqueous solution. The trend of the secondary structure in Table 3 gave similar information to Table 2, which indicated that water played a minor role in calculating secondary structure changes of BSA. It provided a convenient method for calculating the change trend of the secondary structure of protein in aqueous solution using FTIR. Whether or not consideration of water, the calculation gave the same result of the secondary structure changes of BSA.
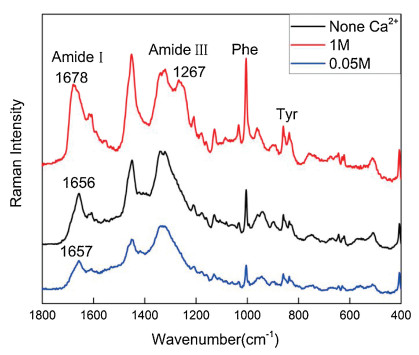
Raman spectroscopy was also a rapid and sensitive detection approach for chemical and biological reagents [27, 28], and it was used to further confirm the change trend of secondary structure of BSA aqueous solution at different calcium cation concentrations. The samples were prepared by freeze-drying the samples containing 0.05 mol/L and 1 mol/L calcium cation in BSA aqueous solution and pure BSA aqueous solution. In Fig. 5, when the concentration of calcium cations increased from 0.05 mol/L to 1 mol/L, the amide Ⅰ band showed a significant shift towards high wavenumber (from 1657 cm-1 to 1678 cm-1) and the amide Ⅲ band at 1267 cm-1 emergent in the spectrum, indicating that β- sheet gave high contribution to the secondary structure of BSA [29, 30]. In addition, the band at ~940 cm-1 was attribute to the skeletal C-C vibration of α-helix conformation, and the band area ratio of none Ca2+:0.05 mol/L Ca2+:1 mol/L Ca2+ was 1:0.53:0.47, further confirming the decrease of α-helix element, in agreement with the data of Tables 2 and 3.

|
Download:
|
| Fig. 5. Raman spectra of BSA solution in different Ca2+ concentrations. | |
ATR-FTIR was utilized to study the secondary structure changes of BSA aqueous solution with different concentrations of calcium cation. Compared with dry BSA powder, the amide Ⅰ band was red shift and the amide Ⅱ band was blue shift in aqueous environment, and the addition of different concentrations of calcium cations in BSA solution further changed the amide Ⅰ and amide Ⅱ bands position and made the aggregation of BSA in aqueous solution due to the electrostatic interactions. We proposed that the hydrogen bonds between water and BSA might lead to the protein secondary structure changes, and then caused the amide bands shift. The α- helix element was gradually transformed into β-sheet by increasing the concentration of calcium cations in BSA aqueous solution, and water could be ignored in calculating secondary structure changes of proteins. Raman data further confirmed the conclusion obtained by FTIR spectra.
AcknowledgmentThe authors are grateful for the financial support by the National Natural Science Foundation of China (No. 21675165).
Appendix A. Supplementary dataSupplementary material related to this article can be found, in the online version, at doi:https://doi.org/10.1016/j.cclet.2019.02.023.
| [1] |
L. Yan, Z. Sun, Structure of Protein Molecular, Molecular Structure of Protein. Beijing: Tsinghua University Press, 1999.
|
| [2] |
J. He, Y. Shao, B. Zhang, Chem. Res. Appl. 24 (2012) 1176-1180. |
| [3] |
J. Kong, S. Yu, Chin. J. Biochem. Biophys. 39 (2007) 549-559. |
| [4] |
H. Yang, S. Yang, J. Kong, A. Dong, S. Yu, Nat. Protoc. 10 (2015) 382-396. DOI:10.1038/nprot.2015.024 |
| [5] |
D. Naumann, C. Schultz, U. Gornetschelnokow, F. Hucho, Biochemistry. 32 (1993) 3162-3168. DOI:10.1021/bi00063a031 |
| [6] |
S.B. Prusiner, Proc. Natl. Acad. Sci. U. S. A. 95 (1998) 13363-13383. DOI:10.1073/pnas.95.23.13363 |
| [7] |
C. Petchanikow, G.P. Saborio, L. Anderes, et al., FEBS Lett. 509 (2001) 451-456. DOI:10.1016/S0014-5793(01)03147-7 |
| [8] |
L. Peng, G. Wang, H. Yao, Y. Wang, Chin. J. Anal. Chem. 36 (2008) 1369-1374. |
| [9] |
Z. Mao, X. Zhang, R. Wu, J. Yin, Chin. J. Anal. Chem. 43 (2015) 518-522. DOI:10.1016/S1872-2040(15)60816-7 |
| [10] |
M. Sunde, L.C. Serpell, M. Bartlam, et al., J. Mol. Bio. 273 (1997) 729-739. DOI:10.1006/jmbi.1997.1348 |
| [11] |
X. Chen, A. Smelter, H.N.B. Moseley, J. Biomol. NMR 72 (2018) 11-28. DOI:10.1007/s10858-018-0202-5 |
| [12] |
N. Jaiswal, N. Raikwal, H. Pandey, etal., Magn. Reson. Chem. 56 (2018) 285-299. DOI:10.1002/mrc.v56.4 |
| [13] |
M. Mechelke, M. Habeck, Proteins 81 (2013) 984-993. DOI:10.1002/prot.v81.6 |
| [14] |
A. Micsonai, F. Wien, L. Kernya, et al., Proc. Natl. Acad. Sci. U. S. A. 112 (2015) 3095-3103. DOI:10.1073/pnas.1500851112 |
| [15] |
L. Momeni, B. Shareghi, S. Farhadian, et al., Int. J. Biol. Macromol. 119 (2018) 477-485. DOI:10.1016/j.ijbiomac.2018.07.162 |
| [16] |
C. Consani, G. Auboeck, van Mourik F., M. Chergui, Science 339 (2013) 1586-1589. DOI:10.1126/science.1230758 |
| [17] |
P.X. Qi, D. Ren, Y. Xiao, P.M. Tomasula, J. Dairy Sci. 98 (2015) 2884-2897. DOI:10.3168/jds.2014-8920 |
| [18] |
Arroyo-Maya I.J., Campos-Teran J., Hernandez-Arana A., D.J. McClements, Food Chem. 213 (2016) 431-439. DOI:10.1016/j.foodchem.2016.06.105 |
| [19] |
H. Li, L.D. Doucette, D. Bousfield, C.P. Tripp, Anal. Chem. 82 (2010) 5053-5059. DOI:10.1021/ac902984s |
| [20] |
H. Li, C.P. Tripp, Appl. Spectrosc. 62 (2008) 963-967. DOI:10.1366/000370208785793317 |
| [21] |
H. Susi, S. Timashef, L. Stevens, J. Biol. Chem. 242 (1967) 5460-5467. |
| [22] |
S.N. Timashef, H. Susi, L. Stevens, J. Biol. Chem. 242 (1967) 5467-5473. |
| [23] |
D.T. Tan, X. Shao, S.F. Pang, Y.H. Zhang, Chin. Chem. Lett. 27 (2016) 1073-1076. DOI:10.1016/j.cclet.2016.02.019 |
| [24] |
S. Weng, Y. Xu, Fourier Transform Infrared Spectroscopy Analysis. Beijing: Chemical Industry Press,, 2010.
|
| [25] |
L. Wu, B. Ma, D. Zou, et al., J. Mol. Struct. 877 (2008) 44-49. DOI:10.1016/j.molstruc.2007.07.013 |
| [26] |
A. Bouhekka, T. Bürgi, Appl. Surf. Sci. 261 (2012) 369-374. DOI:10.1016/j.apsusc.2012.08.017 |
| [27] |
K.M. Koo, B. McNamara, E.J.H. Wee, Y.L. Wang, M. Trau, J. Biomed. Nanotechnol. 12 (2016) 1798-1805. DOI:10.1166/jbn.2016.2294 |
| [28] |
T. Wu, H.T. Wang, B. Shen, et al., Chin. Chem. Lett. 27 (2016) 745-748. DOI:10.1016/j.cclet.2016.01.059 |
| [29] |
G. Navarra, A. Tinti, M. Leone, V. Militello, A. Torreggiani, J. Inorg. Biochem. 103 (2009) 1729-1738. DOI:10.1016/j.jinorgbio.2009.09.023 |
| [30] |
A. Rygula, K. Majzner, K.M. Marzec, et al., J. Raman Spectrosc. 44 (2013) 1061-1076. DOI:10.1002/jrs.v44.8 |