 2019, Vol. 30


b College of Chemistry and Chemical Engineering, Northwest Normal University, Lanzhou 730070, China
Hydrogen is regarded as a promising to substitute fossil fuels for a sustainable green energy [12]. So, the electrochemical water splitting to produce hydrogen (hydrogen evolution reaction HER) has presented a great attention. However, the process of water splitting to produce hydrogen requires high activity and stable electrocatalysts to reduce the overpotential [3-6]. Currently, platinum (Pt) group metals are considered as the best catalysts for the HER in acidic media, but the limited resources and the high cost of Pt noble metals have hampered the viability of large-scale commercialization [7]. Therefore, the remedy is to develop a cheap, efficient catalyst to substitute Pt-based.
Nowadays, earth-abundant transition metal-based compounds, e.g., non-noblemetal alloys [8], phosphides [9], chalcogenides [10], borides [11], carbides [12], nitrides [13], and oxides [14] have been demonstrated as promising electrocatalysts for HER. Among them, MoS2 has received a great deal of attentions due to the high catalytic activity derived from its sulfur edge and two-dimensional (2D) permeable ion transport channels [15]. However, MoS2 have an apparent tendency to aggregate irreversibly due to van der Waals attractions among sheets, resulting in decreasing of the edges active cites. Moreover, the electroactivity of MoS2 are severely diminished because of their intrinsic poor conductivity. Therefore, electrocatalytic activity of MoS2 catalyst can be improved via increasing active sites and enhancing the conductivity [16]. Taking these factors into account, many works have been proposed focusing on incorporating MoS2 with conductive agent (e.g., graphene [17], graphene aerogels [18], CNTs aerogel [19], N-doped carbon nanofibers [20], GQDs [21], carbon cloth [22], and carbon nanotubes (CNTs) [23-26]) to improve its conductivity and expose more active sites. Especially, graphene (GR) as an ideal material for supporting of MoS2 is widely reported because of superior advantages, such as large specific surface area, high charge mobility, superior conductivity and good flexibility [27]. For example, Zhang et al. obtained MoS2/RGO by the incorporation of the graphene oxide into the MoS2 and the composite exhibit enhanced catalytic activity for HER [28]. This result was further validated by Zhou's group recently [29], where the HER efficiency of the amorphous MoS2 materials is related to the presence of graphene oxide. Moreover, Zhao's group designed a Three-dimensional (3D) MoS2/N-rGO hydrogels and the material showed enhanced catalytic activity towards HER because of abundant active edge sites as well as superior electrical conductivity [30]. However, these strategies tend to use graphene oxide, which break the structure of GR thus compromising its electrical conductivity performance. Based on above discussion, graphene is usually functionalized with poly (diallyldimethylammonium chloride) (PDDA) [31], Tryptophan (Trp) [32], Graphene oxide [33] and graphene quantum dots (GQDs) [34] etc., which without destroying the structure of GR.
Graphene quantum dots (GQDs), a type of zero-dimensional graphene sheets, have attracted increasing attention in the field of HER owing to its special features, such as easy and cost-effective preparation, good biocompatibility, good water-solubility and excellent electron transportation property [35]. In addition, GQDs possess some excellent characteristics, such as better surface grafting using the π-π conjugated network or various oxygencontaining functional groups [36], good conductivity and abundant edge active sites owing to the small size and good crystal structure [37]. Besides, the doping of abundant N species can offer more electrocatalytic active sites [38]. Recently, the effort has been devoted to the synthesis of GR-GQDs composites [39], which demonstrated high performance in supercapacitors. Moreover, Guo and his co-workers designed and prepared a coral-shaped MoS2 decorated with GQDs, which enhanced the H adsorption ability of in-plane S atoms by GQDs doping into MoS2 nanosheets [21]. Therefore, the graphene surface decorated with GQDs has various oxygen-containing functional groups [40]. It can further boost the growth of MoS2 sheets on GR-GQDs [41].
Herein, we constructed a novel three-dimensional (3D) layered MoS2@graphene functionalized with nitrogen-doped graphene quantum dots (MoS2@N-GQDs-GR) composites which were fabricated by solvothermal method based upon in situ reduction of MoS2 on N-GQDs-GR. The incorporation of N-GQDs-GR significantly improved the conductivity, it also helps the formation of lamellar MoS2 nanosheets which grow on the N-GQDs-GR, as shown in Scheme 1.

|
Download:
|
| Scheme 1. Preparation of a three-dimensional (3D) like MoS2@N-GQDS-GR (2.5:1) hybrid by solvothermal method. | |
GR (prepared by chemical vapor deposition, CVD) was purchased from XF Nano Inc. (Nanjing, China). Citric acid (C6H807·H2O) was obtained from Yantai double chemical industry Co., Ltd. Urea (CH4N2O) was purchased from China pharmaceutical group chemical reagent Co., Ltd. Anhydrous ethanol was purchased from Tianjin Chemical Reagent factory. Thiourea (CH4N2S, 99%) and sodium molybdate dihydrate (Na2MoO4·2H2O, 99%) were purchased from Aladdin. Nafion solution (5 wt%), 20% Pt/C and Sulfuric acid (H2SO4, 98%), in highest quality, were obtained from Dupont, Shanghai Macklin Biochemical Co., Ltd., and Beijing Chemical Works, respectively. All reagents were used without further purification. Nitrogen gas (99.99%) and deionized water were used throughout the experiment.
Electrochemical measurements were conducted with a CHI660B electrochemical analyzer (Shanghai Chenhua Co., China). The morphology and size were observed by SEM using JSM-5600LV. The crystal structures were characterized by an X-ray diffractometer (Rigaku D/max-2400) and Raman (LabRAMHR-800). The morphology and element distributions were analyzed by TEM and EDS using FEI-Tecnai G2 TF20 electron microscope (America). The chemical states of this material were analyzed by X-ray photoelectron spectroscopy (XPS) (PHI-5702). Electrode kinetics dynamics were tested by EIS using Princeton Applied Researcher (PHI-5702).
N-GQDs were synthesized by a facile hydrothermal method as reported in references [42]. Briefly, 0.72 g urea (N source) and 0.84 g citric acid (carbon source) were dissolved in 20 mL DI water under stirring for 10 min. Subsequently, the solution was transferred into a 100 mL Teflon-lined stainless steel autoclave at 160 ℃ for 4 h. Finally, the upper aqueous solution is collected through centrifuging, dialyzed all night inside 3500 MWCO dialysis membrane, and obtained N-GQDs solution.
The 3D MoS2@N-GQDs-GR catalyst composites were synthesized through a facile hydrothermal method [26]. Typically, 20 mg of graphene and 8 ml (1 mg/mL) of N-GQDs were dissolved in 20 mL of water and ultrasonicated for 24 h, forming homogeneous GR and N-doped GQDs suspension. After that, 50 mg Na2MoO4·2H2O (0.2 mmol) and 76 mg CH4N2S (1.0 mmol) were added into the suspension in sequence. The mixture was continuously ultrasonic at room temperature for 30 min, sealed tightly in a Teflon-lined autoclave (100 mL) at 200 ℃ for 24 h, and washed with water and ethanol. Finally the catalyst composites were collected by drying at 80 ℃ in a vacuum oven overnight.
Fig. 1b displays the photographs of 1 mg/mL GR, N-GQDs and N-GQDs/GR taken at 24 h after ultrasonication. After analysis, it is found that: (1) Where without adding N-GQD, the GR nanosheets suspended in water tended to be stable after a period of time; (2) The N-GQDs solution is uniformly yellow and has excellent water solubility. Uniformity is observed by the obtained TEM image having a spherical shape distribution of a uniform size of 3.2 ± 0.7 nm in diameter (Fig. 1a), it can be clearly observe the size distribution of the particles from the corresponding particle size statistical image of the prepared N-GQDs (Fig. S6 in Supporting information); (3) When adding N-GQD, the homogeneous colloidal dispersion generated, and after a few months, it can exist stably. This is mainly attributed to N-GQD as a dispersant for GR materials. GR can be well dispersed in water by π-π interaction and by means of N-GQDs, so the final composite has a clean, electrically addressable carbon-carbon interface.

|
Download:
|
| Fig. 1. (a) TEM image of the prepared N-GQDs, (b) Photographs of GR (1), N-GQDs (2) and N-GQDs/GR (3) solution. | |
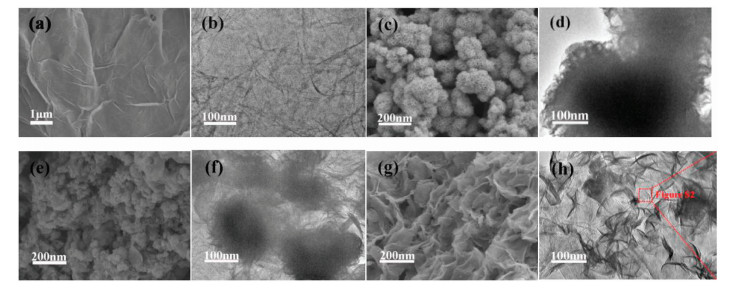
The SEM and TEM images of N-GQDs-GR, MoS2, MoS2/GR hybrid and MoS2@N-GQDs-GR hybrid is shown in Fig. 2, as observed in Figs. 2a and b, the N-GQDs-GR contains a large amount of 3D-interconnected folding structure. The large surface area provides conditions for the loading of MoS2 nanoflowers, TEM exhibits flake-like and transparent N-GQDs-GR sheets. As shown in Figs. 2c and d, the MoS2 nanoflowers assembled from layered nanosheet have obvious ripples. The pristine MoS2 shows a spherical structure, and the TEM shows that the pure MoS2 is in a state of serious accumulation. From Figs. 2e and f, SEM images of MoS2/GR hybrid display a new morphology. The MoS2 nanoflowers distribute on the surface of GR are in unevenly state, and the TEM exhibites the MoS2 nanoflowers are stacked together and aggregated into nanospheres with the GR nanosheets. The final composite, MoS2@N-GQDs-GR, shows the numerous delayered MoS2 nanosheets are homogenously anchored on the N-GQDs-GR surface introduced by hydrothermal method, as shown in Figs. 2g and h and Fig. S1 (Supporting information), while the pure MoS2 and the mixture MoS2/GR are significantly different from that. Furthermore, Fig. S2 (Supporting information) shows the HRTEM image of MoS2@N-GQDs-GR, MoS2 nanosheets are composed of a small number of layers, which the spacing of MoS2 nanosheets that between two adjacent S-Mo-S layers is about 0.95 nm. The supported MoS2 sheets expose a lot of efficient active sites due to the large surface area of the N-GQDs-GR substrate, leading to the enhancement of HER efficiency. Meanwhile, the energy-dispersive X-ray (EDX) mappings (Fig. S3 in Supporting information) of C, N, O, Mo and S further demonstrate that MoS2 nanosheets are uniformly distributed on the surface of the N-GQDs-GR.

|
Download:
|
| Fig. 2. The SEM and TEM images of N-GQDs-GR (a, b), MoS2 (c, d), MoS2-GR (e, f) and MoS2@N-GQDs-GR (2.5:1) (g, h). | |
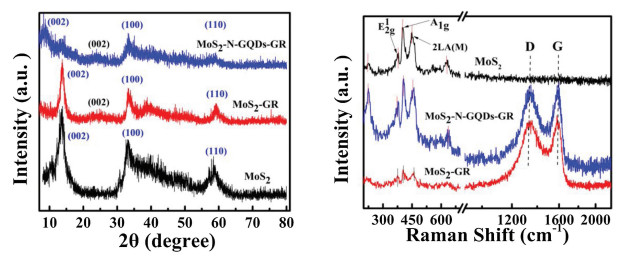
The structural information of different catalysts is analyzed by XRD. As shown in Fig. 3, the pristine MoS2 sample displays three obvious peaks at around 2θ = 14.4°, 32.8° and 58.5°, which are corresponded to the (002), (100) and (110) plane of 2H-MoS2 (JCPDS No. 73-1508), respectively. The strong (002) peak signifies a well-stacked layered structure with interlayer spacing of ~0.61 nm, which calculates by using the Bragg's law. In Fig. 3, the MoS2/GR composite shows three poor and broad peaks at 2θ = 14.4°, 32.8° and 58.5°, respectively. In addition, 2θ = 25° can be attributed to (002) crystal plane of the GR [18]. XRD patterns of MoS2@N-GQDs-GR composites are displayed in Fig. 3. Three peaks centering at 2θ = 32.8°, 9.2° and 58.5° assigned with (100), (002) and (110) crystal plane of MoS2. Compared with standard (002) peak of 2H-MoS2 (2θ = 14.4°), the (002) diffraction peak of 14.4° (d = 0.61 nm) changes to 9.2° (d = 0.95 nm), which marking the interlayer spacing increases, indicating that a new layered structure has been formed. The change of the (002) reflection indicates that the MoS2 hardly do reunion, which is consistent with HRTEM images (Fig. S2). Compared with the pure MoS2 and MoS2-GR, their diffraction density is weakened. The above results show that there is low grain structure and expand the interlayer spacing [43].

|
Download:
|
| Fig. 3. XRD pattern and Raman shift of the MoS2, MoS2-GR hybrid and MoS2@N-GQDs-GR (2.5:1) hybrid. | |
Raman spectroscopy can effectively characterize MoS2 nanosheets and GR in Fig. 3, where the peaks shown at 403.8 cm-1 and 374.3 cm-1 are the two main Raman peaks of the pristine MoS2, which are corresponded to A1g and E2g1 mode of the MoS2 crystal. Furthermore, the E2g1 peak originated from the opposite vibration of two S atoms with one Mo atom, and the A1g peak is related to the outer plane vibration of only S atoms [44]. At the same time, the weak peaks are observed to be about 221.2 cm-1 and 628.5 cm-1, which are consistent with the resonance Raman (RR) peaks. Compared with the pristine MoS2, the MoS2/GR's E2g1 and A1g mode peaks are greatly reduced [45]. In addition, compared to MoS2 and MoS2-GR composites, the MoS2@N-GQDs-GR's E2g1 and A1g mode peaks are greatly improved, which owing to their being anchored on N-GQDs-GR surface [46]. Meanwhile, in MoS2/GR, the positions of the two peak modes E2g1 and A1g of MoS2 transfer to 375.9 and 403.8 cm-1. However, in MoS2@N-GQDs-GR, both of them are further transferred to 379 cm-1 and 403.1 cm-1. And the frequency difference between E2g1 and A1g can reveal the influence quantity of crystal-plane layers, which are determined by previous studies. Then, the differences are 24.1 cm-1, 27.9 cm-1 and 29.5 cm-1 for MoS2@N-GQDs-GR, MoS2-GR and MoS2 in our research, respectively, due to the addition of GR and N-GQDs-GR in hydrothermal processes to effectively prevent the accumulation of MoS2 nanosheets in synthesis [47]. This is coincided with the results of the XRD analysis. By analyzing the Fig. 3, graphene also shows characteristic Raman bands appearing at ~1344 cm-1 (D-band) and ~1586 cm-1 (G-band). The D-band is attributing to vibrations of sp3 carbon atoms located at the defective edge sites from graphene, whereas the G band is known for its first-order scattering of the Eg2 mode arising from sp2 carbon network [48]. The strong three characteristic peaks of MoS2 and two strong D and G bands of graphene can be seen in the MoS2@N-GQDs-GR shown in the Fig. 3, indicating that MoS2 is successfully anchored uniformly on the N-GQDs-GR through the hydrothermal process.
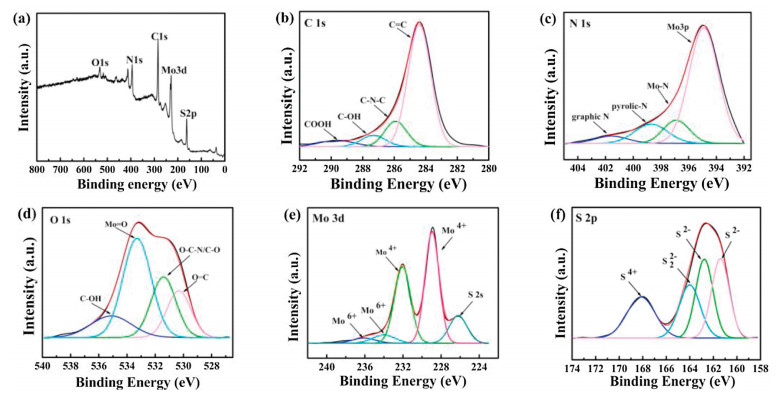
The chemical compositions of nanocomposites are further evaluated by XPS technique. The high-resolution XPS (Fig. 4a) of the resulting MoS2@N-GQDs-GR nanocomposites exhibits the existence of C, N, O, Mo and S elements. The result is consistent with the EDX mapping in Fig. S3. The element N derives from N-GQDs, while element O comes from surplus oxygen-containing functional group that belong to GR and N-GQDs. Figs. 4b-f represent the high-resolution scan of C 1s, N 1s, O 1s, Mo 3d and S 2s spectra. Then, the four peaks decomposed by C 1s spectrum can be observed in Fig. 4b. In general, the peaks centered at 289.7 eV, 287.3 eV and 284.4 eV are assigned to COOH bond, C—OH bond and sp2 C=C bond, respectively, and the peak of 285.9 eV is assigned to C—N—C coordination, which demonstrate the heteroatom (N atom) doping from urea and thiourea [49]. As shown in Fig. 4c, the high-resolution N 1s spectrum can be split into four characteristic peaks at 394.9 eV, 396.8 eV, 398.7 eV and 401.5 eV, which are consistent with the binding energy of Mo 3p, Mo-N, pyrrolic-N and graphitic-N, respectively. Based on other report, it can be determined that graphitic N is very favorable for improving the HER performance of materials [50]. It is worth noticing that the Mo—N bond indicates the hydrothermal processes of MoS2 and N-GQDs-GR are not simple physical mixtures, but have strong adhesion. The reason might be that the p-orbitals of the N-dopants interact with the vestibule of the transition metal Mo to form strong Mo—N bonds through strong coordination bond. As illustrated in Scheme 1, the protonation of lone-pair electrons at pyridinic N-doping sites can attract thiomolybdate anions by straightforward electrostatic attraction. The attracted thiomolybdate anions can be subsequently decomposed into amorphous MoSx [51]. The four peaks at 535.2 eV, 533.3 eV, 531.4 eV and 530.3 eV in Fig. 4d are allocated to C — OH bond, Mo=O bond, C—O/O—C—N bond, and C=O bond, respectively. The Mo 3d region (Fig. 4e) can be divided into five peaks. The peaks centered at 232 eV (Mo 3d3/2) and 228.9 eV (Mo 3d5/2) correspond to characteristic features of Mo4+, two signals at 236.2 eV and 233.9 eV are attributed to the presence of a small amount of MoO3, the peak at 226.2 eV is assigned to the S 2s binding energy in MoS2 [52]. Moreover, the XPS spectrum of S 2p in Fig. 4f can be deconvoluted into four peaks. The 168.1 eV may be attributed to S4+, generated by not complete oxidation of S2- in the natural, and the shoulder at 164 eV is subordinate to bridging disulfides S22- and/or the apical S2- ligands. In particular, the strong peaks of S 2p1/2 and S 2p3/2 for MoS2 can be observed at 162.8 eV and 161.4 eV, respectively.

|
Download:
|
| Fig. 4. (a) XPS survey spectrum of MoS2@N-GQDs-GR (2.5:1). (b–f) High-resolution XPS spectra of C 1s, N 1s, O 1s, Mo 3d, and S 2p of MoS2@N-GQDs-GR (2.5:1), respectively. | |
The electrochemical characterization is performed in a three-electrode system using a CH Instrument electrochemical analyzer (model CHI660B), The L glassy carbon electrode (GCE, area = 0.07 cm2) is the working electrode, whereas the graphite rod and saturated calomel electrode (SCE) are applied as the counter and reference electrodes, respectively. All three electrodes are placed in the cell containing 0.5 mol/L H2SO4 solution (electrolyte). Typically, 4 mg of MoS2@N-GQDs-GR and 0.08 mLof5 wt% Nafionsolutions are dispersed in 1 mL of 4:1 v/v water/ethanol mixed solvent by sonicationfor1 h.Nest, 5.0 μL of the as-prepared material is dropped onto the GCE (diameter = 3 mm) and usually dry overnight (0.285 mg/cm2). Linear sweep voltammetry (LSV) is swept from -0.9 V to -0.1 V (vs. SCE) at a 5 mV/s. The electrochemical capacitance is carried at the potential that range from 0.322 V to 0.422 V and return to 0.322 V at each of seven different scan rates (15, 20, 25, 40, 60, 80 and 100 mV/s). Electrochemical impedance spectroscopy is used to examine the electrode-transfer kinetics, which the frequencies range from 100 kHz to 0.1 Hz at perturbation voltage amplitude of 5.0 mV, the impedance date can be fitted by an equivalent circuit. As shown in Fig. S4 (Supporting information), we perform IR correction before test the data. If no special emphasis, all the potentials are here referenced to the reversible hydrogen electrode (RHE) using the following equation: E (RHE) = E (SCE) + 0.284 V. The turnover frequencies are illustrated according to the equation [53]: TOF (s-1) = (j0, A/cm2)/[(1.5 × 1015 sites/cm2) (1.602 × 10⁻¹⁹ C/e-) (2e-/H2)].
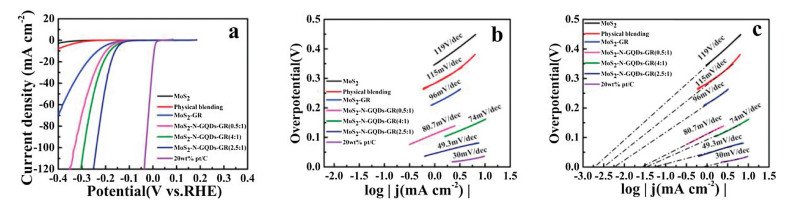
A traditional three-electrode system is served in all electrochemical tests in 0.5 mol/L H2SO4 solution. The commercial Pt/C (20 wt%) is also measured under the same condition for comparison. Figs. 5a and b show HER polarization curves and corresponding Tafel slopes of the as-prepared samples. The polarization curve of Pt is also shown as a reference. As shown in Fig. 5a and Table 1, Pt/C noble electrocatalysts exhibits the best electrocatalytic activity for HER with onset overpotential of close to zero. In addition, the pure MoS2, Physical blending and MoS2-GR display an unsatisfactory HER electrocatalytic performance with a high onset potential of 340, 283 and 220 mV, respectively. For comparison, MoS2@N-GQDs-GR (2.5:1) shows an enhanced HER performance, due to special structure and synergistic effect more active sites are exposed for HER between MoS2 and N-GQDs-GR.

|
Download:
|
| Fig. 5. Polarization curves obtained with (a) pristine MoS2, physical blending, MoS2-GR, MoS2-N-GQDs-GR (0.5:1), MoS2-N-GQDs-GR (4:1), MoS2-N-GQDs-GR (2.5:1) and 20 wt% Pt/C at 5 mV/s in H2SO4 (0.5 mol/L) and (b) Tafel plots. (c) Calculated exchange current densities (j0) of various samples by using extrapolation methods. | |
|
|
Table 1 Comparsion of HER performance of various MoS2 catalysts. |

Therefore, the onset potential of MoS2@N-GQDs-GR (2.5:1) obviously decreases down to 99 mV. Meanwhile, the Mo/C molar weight ratio in MoS2@N-GQDs-GR is optimized for hydrogen evolution. In sharp contrasts, all of MoS2@N-GQDs-GR nanocomposites exhibit prominent electrocatalytic performance towards HER. Among them, the onset overpotential of MoS2@N-GQDs-GR (2.5:1) (99 mV) is obviously smaller than that of MoS2@N-GQDs-GR (4:1) (111 mV) and MoS2@N-GQDs-GR (0.5:1) (127 mV). Moreover, the applied overpotential of MoS2@N-GQDs-GR (2.5:1) is about 160 mV atcurrent density of 10 mA/cm2, lower than that of MoS2@N-GQDs-GR(4:1)(182 mV)andMoS2@N-GQDs-GR(0.5:1)(198 mV).As shown in Fig. 5a, MoS2-N-GQDs-GR (2.5:1) also exhibits the largest cathodic current density (118 mA/cm2) at an onset potential of 250 mV in comparison to those of MoS2-N-GQDs-GR (4:1) (49.84 mA/cm2) and MoS2-N-GQDs-GR (0.5:1) (32.11 mA/cm2), indicating that the density ratio order is MoS2@N-GQDs-GR (2.5:1) > MoS2@N-GQDs-GR (4:1) > MoS2@N-GQDs-GR (0.5:1) at the same potential. The above experiments prove that the Mo/C ratio in MoS2@N-GQDs-GR (2.5:1) is the best condition for the generation and evolution of hydrogen, which is consistent with the subsequent experimental results. Besides, the catalytic current densities of state of-the-art MoS2 based catalysts and the present MoS2@N-GQDs-GR (2.5:1) are summarized in Table S2 (Supporting information).
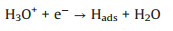
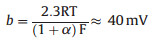
Tafel slope is the slope by fitting line. For the Tafel curve, the relevant current density (j) and the overpotential (η) are obtained from the LSV curves (Fig. 5a). All Tafel plots are adopted from the linear portions of the semi-logarithmic curves which fitted to the Tafel equation (η = blog(j0) + a, where b is the Tafel slope and j0 is the exchange current density), which reveals the intrinsic properties of the electrocatalyst materials. It should be noted that in an acidic medium, three principal steps have been proposed for the conversion of H+ to H2, commonly referred to as the Volmer, Heyrovsky, and Tafel reactions with the corresponding Tafel slopes of 120, 40, 30 mV/dec, respectively [54].
First, the discharge reaction (Volmer reaction):
|
(1) |
|
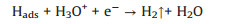
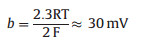
where b = 2.3RT/α, F ≈ 120 mV/decade, R represents the universal gas constant, T is the absolute temperature, α = 0.5 is the symmetry coefficient, and F is the Faraday constant. The second step is the electrochemical desorption step (Heyrovsky reaction).
|
(2) |
|
The third step is the combination step (Tafel reaction).
|
(3) |
|
Tafel slope is usually used to assess the reaction kinetics for HER. The smaller of the value of the Tafel slope, the faster of the increment of HER rate with increasing overpotential. In Fig. 5b, Tafel slope of Pt/C, MoS2@N-GQDs-GR (2.5:1), MoS2@N-GQDs-GR (4:1), MoS2@N-GQDs-GR (0.5:1), MoS2-GR, physical blending and pure MoS2 is 30, 49.3, 74, 80.7, 96, 115, 119 mV/dec, respectively. The Tafel slopes of MoS2@N-GQDs-GR (2.5:1) nanocomposites ranges of 40-60 mV/dec, indicating that it possibly catalyzed through a Volmere-Heyrovsky mechanism. Obviously, MoS2@N-GQDs-GR (2.5:1) shows the better electrocatalytic activity with a lower overpotential and Tafel slope, which may be attributed to very large 2D conductivity and large surface area of the N-GQDs-GR.
The exchange current density (j0), which is determined by fitting j-E data to the Tafel equation is the most inherent measure of activity for the HER (Fig. 5c and Table S1). The obtained j0 of MoS2@N-GQDs-GR (2.5:1) is 42.7 μA/cm2, higher than those of pure MoS2 (1.26 μA/cm2), Physical blending (3.47 μA/cm2), MoS2- GR (5.88 μA/cm2), MoS2@N-GQDs-GR (0.5:1) (27.5 μA/cm2), MoS2@N-GQDs-GR (4:1) (32.3 μA/cm2), indicating the fastest reaction rate per surface area. In order to obtain a direct field comparison of the activity of various MoS2-based catalysts materials, we made a rough estimation calculation of TOFs [55], where the TOFs value of MoS2@N-GQDs-GR (2.5:1) is relatively high, as shown in Table 1, which is 0.089 s-1. The good HER catalytic activity of MoS2@N-GQDs-GR, owning to N-GQDs-GR with highly continuous multiwall and large specific surface area, not only provides 3D conductive pathway for fast transportation of electrons and ions, but also is used as a matrix material for construction of hierarchical MoS2@N-GQDs-GR hybrids where few-layered MoS2 nanoflowers are homogenous covered on N-GQDs-GR surface.
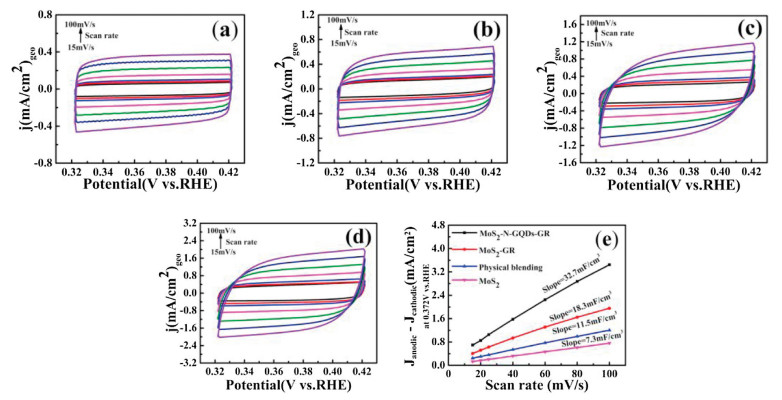
The double-layer capacitance is measured to reflect the electrochemical surface area (ECSA) [56]. The double Cdl value for each sample is extracted by plotting Δj = ja - jc at a given potential (0.372 V versus reversible hydrogen electrode, RHE) against the CV scan rates (15~100 mV/s) in Figs. 6a-d, where ja and jc are anode current density and cathode current density, respectively. It is shown that the MoS2@N-GQDs-GR (2.5:1) exhibits the largest slopes (CdI = 32.7 mF/cm2) than other MoS2- GR (CdI = 18.3 mF/cm2), Physical blending (CdI = 11.5 mF/cm2) and MoS2 (CdI = 7.3 mF/cm2) (Fig. 6e), demonstrating MoS2@N-GQDsGR (2.5:1) possessed more excellent conductivity and superior electronic transport properties.

|
Download:
|
| Fig. 6. CV measurements of (a) pristine MoS2, (b) Physical blending, (c) MoS2-GR and (d) MoS2@N-GQDs-GR (2.5:1) at the scan rate of 15, 20, 25, 40, 60, 80 and 100 mV/s. (e) The differences in the current density (Janodic - Jcathodic)geo at 0.372V (vs. RHE) plotted against scan rate fitted to a linear regression allows for the estimation of Cdl. | |
We analyze electron-transfer kinetics in HER using EIS in Fig. 7a for all electrocatalysts. More detailed analyses are exhibited by fitting the impedance data to an equivalent circuit, where a constant phase element (CPE) and the charge transfer resistance (Rct) are employed. It is found that the Rct of MoS2@N-GQDs-GR (2.5:1) (99.35 Ω) is much lower than these of pristine MoS2 (2989 Ω), Physical blending (1390 Ω), and MoS2-GR (741.7 Ω). The improved performance of MoS2@N-GQDs-GR (2.5:1) could be attributed to shorten the diffusion pathway of elections by NGQDs-GR, which promotes the charge transfer.

|
Download:
|
| Fig. 7. (a) Nyquist plots of the corresponding catalysts of MoS2, Physical blending, MoS2-GR, MoS2@N-GQDs-GR (2.5:1) and 20 wt% Pt/C, (b) Durability measurement of MoS2@N-GQDs-GR (2.5:1) sample. The blackline and redline arethe polarization curves recorded initially and after 3000 cycles (scan rate: 5 mV/s), respectively. | |
By analyzing the cycling stability of the MoS2@N-GQDs-GR (2.5:1) catalyst using successive CVs between -0.9 V and -0.1 V (vs. RHE) at a scan rate of 5 mV/s for 3000 cycles. In Fig. 7b, the current density of the final polarization curve only exhibits little reduction as contested with the initial one, demonstrating outstanding stability of the MoS2@N-GQDs-GR (2.5:1) sample in the continuous electrolysis reaction. Fig. S7 (Supporting information) presents the timedependent current density curve of MoS2@N-GQDs-GR (2.5:1) at the overpotential of 0.155 V, after along HER testing period (30, 000 s), the current densities only show slight degradation. Furthermore, the structure stability is determined from the MoS2@N-GQDs-GR (2.5:1) TEM and XPS images, which shows no visible morphology distortion after 3000 CV sweeps (Fig. S5 in Supporting information) and along HER testing period about 8 h (Fig. S8 in Supporting information). All these results confirm the better stability of our intentionally designed electrocatalyst, the N-GQDs-GR with highly continuous multiwall and large specific surface area, which is used as a matrix material for construction of hierarchical MoS2@N-GQDs-GR hybrids. Because N-GQDs-GR supports robust integration with MoS2 on its surface, inhibits the aggregation of MoS2 nanometers, exposes more active surfaces, and allows ions and electrons to diffuse rapidly on the MoS2@N-GQDs-GR surface.
In conclusion, we have synthesized a novel 3D MoS2@N-GQDs-GR (2.5:1) hybrid using a simple hydrothermal process. MoS2 and N-GQDs-GR coordination has been fabricated to understand the fundamental relationship between the nanostructure and the electrocatalytic activity toward HER. Our results suggest that MoS2@N-GQDs-GR (2.5:1) exhibits superior electrochemical activity toward HER with a Tafel slope of 49.3 mV/dec, an onset potential of 99 mV, an exchange current density of 42.7 μA/cm2, a double layer capacitance of 32.7 mF/cm2 and a superior stability even after 3000 continuous scans. All of these were under acidic conditions. The superior electrocatalytic activity could be assigned a mass of active sites from the sulfur edges of MoS2 and the conductive channels of N-GQDs-GR to accelerate electron transfer. As a consequence, in this study, the 3D MoS2@N-GQDs-GR (2.5:1) nanocomposite was synthesized by using environmentally friendly methods. This nanocomposite is a cheap and highly active HER electrocatalyst and has a great application prospect.
AcknowledgmentsThis work was financially supported by the National Natural Science Foundation of China (Nos. 21165016, 21175108, 21265018) and the Science and Technology Support Projects of Gansu Province (Nos. 1011GKCA025, 090GKCA036, 1208RJZM289).
Appendix A. Supplementary dataSupplementary material related to this article can be found, in the online version, at doi:https://doi.org/10.1016/j.cclet.2019.02.009.
| [1] |
J.A. Turner, Science 305 (2004) 972-974. DOI:10.1126/science.1103197 |
| [2] |
J.K. Norskov, C.H. Christensen, Science 312 (2006) 1322-1323. DOI:10.1126/science.1127180 |
| [3] |
F.E. Osterloh, Chem. Soc. Rev. 42 (2013) 2294-2320. DOI:10.1039/C2CS35266D |
| [4] |
J.X. Feng, H. Xu, Y.T. Dong, et al., Angew. Chem. Int. Ed. 56 (2017) 2960-2964. DOI:10.1002/anie.201611767 |
| [5] |
J.X. Feng, J.Q. Wu, Y.X. Tong, et al., J. Am. Chem. Soc. 140 (2018) 610-617. DOI:10.1021/jacs.7b08521 |
| [6] |
J.X. Feng, S.Y. Tong, Y.X. Tong, et al., J. Am. Chem. Soc. 140 (2018) 5118-5126. DOI:10.1021/jacs.7b12968 |
| [7] |
M.A. Abbas, J.H. Bang, Chem. Mater. 27 (2015) 7218-7235. DOI:10.1021/acs.chemmater.5b03331 |
| [8] |
M.S. Faber, S. Jin, Energy Environ. Sci. 7 (2014) 3519-3542. DOI:10.1039/C4EE01760A |
| [9] |
N.P. Sweeny, C.S. Rohrer, O.W. Brown, J. Am. Chem. Soc. 80 (1958) 799-800. DOI:10.1021/ja01537a012 |
| [10] |
J. Wang, F. Xu, H. Jin, et al., Adv. Mater. 29 (2017) 1605838. DOI:10.1002/adma.v29.14 |
| [11] |
H. Vrubel, X. Hu, Angew. Chem. 124 (2012) 12875-12878. DOI:10.1002/ange.v124.51 |
| [12] |
W.F. Chen, J.T. Muckerman, E. Fujita, Chem. Commun. 49 (2013) 8896-8909. DOI:10.1039/c3cc44076a |
| [13] |
Z. Chen, D. Higgins, A. Yu, et al., Energy Environ. Sci. 4 (2011) 3167-3192. DOI:10.1039/c0ee00558d |
| [14] |
X. Zou, Y. Zhang, Chem. Soc. Rev. 44 (2015) 5148-5180. DOI:10.1039/C4CS00448E |
| [15] |
J. Xie, H. Zhang, S. Li, et al., Adv. Mater. 25 (2013) 5807-5813. DOI:10.1002/adma.v25.40 |
| [16] |
A.B. Laursen, S. Kegnæs, S. Dahl, et al., Energy Environ. Sci. 5 (2012) 5577-5591. DOI:10.1039/c2ee02618j |
| [17] |
L. Ma, Y. Hu, G. Zhu, et al., Chem. Mater. 28 (2016) 5733-5742. DOI:10.1021/acs.chemmater.6b01980 |
| [18] |
X. Xu, Y. Sun, W. Qiao, et al., Appl. Surf. Sci. 396 (2017) 1520-1527. DOI:10.1016/j.apsusc.2016.11.201 |
| [19] |
S. Reddy, R. Du, L. Kang, et al., Appl. Catal. B: Environ. 194 (2016) 16-21. DOI:10.1016/j.apcatb.2016.04.007 |
| [20] |
H. Zhu, M.L. Du, M. Zhang, et al., Chem. Commun. 50 (2014) 015435-015438. DOI:10.1039/C4CC06480A |
| [21] |
B. Guo, K. Yu, H. Li, et al., ACS Appl. Mater. Interfaces 9 (2017) 3653-3660. DOI:10.1021/acsami.6b14035 |
| [22] |
Z.C. Xiang, Z. Zhang, X.J. Xu, et al., Carbon 98 (2016) 84-89. DOI:10.1016/j.carbon.2015.10.071 |
| [23] |
I.S. Amiinu, Z. Pu, X. Liu, et al., Adv. Func. Mater. 27 (2017) 1702300. DOI:10.1002/adfm.v27.44 |
| [24] |
D. He, Y. Xiong, J. Yang, et al., J. Mater. Chem. A 5 (2017) 1930-1934. DOI:10.1039/C5TA09232A |
| [25] |
V.N. Patel, N. Tandon, R.K. Pandey, Procedia Technol. 14 (2014) 312-319. DOI:10.1016/j.protcy.2014.08.041 |
| [26] |
D.J. Li, U.N. Maiti, J. Lim, et al., Nano Lett. 14 (2014) 1228-1233. DOI:10.1021/nl404108a |
| [27] |
K.J. Huang, L. Wang, Y.J. Liu, et al., Inter. J. Hydrogen Energy 38 (2013) 14027-14034. DOI:10.1016/j.ijhydene.2013.08.112 |
| [28] |
J. Zhang, L. Zhao, A. Liu, et al., Electrochim. Acta 182 (2015) 652-658. DOI:10.1016/j.electacta.2015.09.147 |
| [29] |
W. Zhou, K. Zhou, D. Hou, et al., ACS Appl. Mater. Interfaces 6 (2014) 21534-21540. DOI:10.1021/am506545g |
| [30] |
L. Zhao, C. Hong, L. Lin, et al., Carbon 116 (2017) 223-231. DOI:10.1016/j.carbon.2017.02.010 |
| [31] |
J. Sun, L. Li, X. Zhang, et al., RSC Adv. 5 (2015) 11925-11932. DOI:10.1039/C4RA13857K |
| [32] |
Q. Lian, Z. He, Q. He, et al., Anal. Chim. Acta 823 (2014) 32-39. DOI:10.1016/j.aca.2014.03.032 |
| [33] |
X. Zhou, Z. He, Q. Lian, et al., Sensor. Actuat. B-Chem. 193 (2014) 198-204. DOI:10.1016/j.snb.2013.11.085 |
| [34] |
Y. Duan, T. Zeng, T. Sun, et al., Nano 13 (2018) 1830003. DOI:10.1142/S1793292018300037 |
| [35] |
L.A. Ponomarenko, F. Schedin, M.I. Katsnelson, et al., Science 320 (2008) 356-358. DOI:10.1126/science.1154663 |
| [36] |
S. Zhu, Y. Song, J. Wang, et al., Nano Today 13 (2017) 10-14. DOI:10.1016/j.nantod.2016.12.006 |
| [37] |
W.S. Kuo, Y.T. Shao, K.S. Huang, et al., ACS Appl. Mater. Interfaces 10 (2018) 14438-14446. DOI:10.1021/acsami.8b01429 |
| [38] |
W.A. Saidi, J. Phys. Chem. Lett. 4 (2013) 4160-4165. DOI:10.1021/jz402090d |
| [39] |
Q. Chen, Y. Hu, C. Hu, et al., Phys. Chem. Chem. Phys. 16 (2014) 19307-19313. DOI:10.1039/C4CP02761B |
| [40] |
K. Lee, H. Lee, Y. Shin, et al., Nano Energy 26 (2016) 746-754. DOI:10.1016/j.nanoen.2016.06.030 |
| [41] |
R. Vinoth, I.M. Patil, A. Pandikumar, et al., ACS Omega 1 (2016) 971-980. DOI:10.1021/acsomega.6b00275 |
| [42] |
D. Qu, M. Zheng, J. Li, et al., Light-Sci. Appl. 4 (2015) e364. DOI:10.1038/lsa.2015.137 |
| [43] |
X. Zheng, J. Xu, K. Yan, et al., Chem. Mater. 26 (2014) 2344-2353. DOI:10.1021/cm500347r |
| [44] |
L. Ma, J. Ye, W. Chen, et al., Nano Energy 10 (2014) 144-152. DOI:10.1016/j.nanoen.2014.09.006 |
| [45] |
S.Y. Tai, C.J. Liu, S.W. Chou, et al., J. Mater. Chem. 22 (2012) 24753-24759. DOI:10.1039/c2jm35447k |
| [46] |
D. Kong, H. Wang, J.J. Cha, et al., Nano Lett. 13 (2013) 1341-1347. DOI:10.1021/nl400258t |
| [47] |
K.K. Liu, W. Zhang, Y.H. Lee, et al., Nano Lett. 12 (2012) 1538-1544. DOI:10.1021/nl2043612 |
| [48] |
Y. Zhai, Y. Dou, D. Zhao, et al., Adv. Mater. 23 (2011) 4828-4850. DOI:10.1002/adma.201100984 |
| [49] |
A. Thomas, A. Fischer, F. Goettmann, et al., J. Mater. Chem. 18 (2008) 4893-4908. DOI:10.1039/b800274f |
| [50] |
H. Zhu, M.L. Du, M. Zhang, et al., Chem. Commun. 50 (2014) 15435-15438. DOI:10.1039/C4CC06480A |
| [51] |
J. Kibsgaard, Z. Chen, B.N. Reinecke, et al., Nat. Mater. 11 (2012) 963-969. DOI:10.1038/nmat3439 |
| [52] |
J.D. Benck, Z. Chen, L.Y. Kuritzky, et al., ACS Catal. 2 (2012) 1916-1923. DOI:10.1021/cs300451q |
| [53] |
Z. Xing, Q. Liu, A.M. Asiri, et al., ACS Catal. 5 (2014) 145-149. |
| [54] |
Z. Huang, W. Luo, L. Ma, et al., Angew. Chem. 127 (2015) 15396-15400. DOI:10.1002/ange.201507529 |
| [55] |
J. Bonde, P.G. Moses, T.F. Jaramillo, et al., Faraday Discuss. 140 (2009) 219-231. DOI:10.1039/B803857K |
| [56] |
M.A. Lukowski, A.S. Daniel, F. Meng, et al., J. Am. Chem. Soc. 135 (2013) 10274-10277. DOI:10.1021/ja404523s |