 2019, Vol. 30


Traditional research methods of virus spread include one-step growth curve for judging its replication cycle and virus infectivity, virus induced plaque for measuring its spread rate [1, 2], labeling virus for tracking its transport within cells [3, 4]. Cell-to-cell connections are exploited for virus infection widely, by which virus can escape the immune system of host cells and spread more rapidly and efficiently than virus diffusion through the extracellular space, namely cell-free spread [5-7]. It has been reported that vaccinia virus induced the formation of actin projections to propel virus toward uninfected cells [1]. The US3 kinase of alphaherpesvirus facilitated the extension of cell projections to promote cell-to-cell spread of virus [8]. Plant virus exploited cell-to-cell connections to transport genomes and replication complexes [9, 10]. However, all these studies of virus spread were carried out in traditional dishes, in which virus cell-to-cell spread was not distinguished from cell-free spread. Therefore, it is necessary to develop a new platform to individually study virus cell-to-cell spread.
The randomness of virus spread directions makes it difficult to count the rate of virus spread. Virus can spread in a particular direction under premise of fixed cellular spatial distributions. Cellular networks provide a novel microenvironment for the study of various cytobiological processes, in which the location of cells is fixed. Common methods for constructing cellular networks are based on external field force [11-16] and matrix modification [17-21]. External field force has absolute advantages in cell manipulation, while modification of the substrate has less damage to cell adherence ability. Therefore, modification of the substrate is in favor of cellular network construction, which consists of positive enhancement and negative weakening. In particular, positive enhancement reagents include poriferous extracellular matrix and cationic polymer [17, 18], while negative weakening regents include some polyethylene glycol (PEG) derivatives [20, 21]. PEG derivatives are more stable and cheaper than the former ones.
The uncertainty of virus induced plaque brings inconvenience to tracking virus spread in situ. A micro-injector can realize microinjection of fluids [22], which can be used for cell culture and virus infection [23, 24]. It has been reported that a micro-injector was used for the open access cell analysis, in which micro-channels were adopted to obtain steady gradients of molecule concentration on the fixed point [23]. Virus induced plaque can also be controlled by a micro-injector [24]. It is significant to combine cellular networks with micro-injector to study virus spread.
Herein, a PEG pattern was fabricated on the glass to construct a cellular network, which consists of PEG-ylated region and nonPEG-ylated region (Fig. S1 in Supporting information). Furthermore, a micro-injector was combined with the cellular network to investigate virus cell-to-cell spread on the fixed point. Cellular growth state on the PEG pattern was tracked to investigate the formation of cellular networks. Microtubule and nucleus of cells on the PEG pattern were imaged by laser scanning confocal microscope to determine the rearrangement of cytoskeleton in cellular networks. Different PEG patterns were designed to test the controllability and flexibility of cellular networks. Virus spread in one dimension was tracked in situ to measure its spread rate. With this platform, a controllable and flexible cellular network can be fabricated, virus cell-to-cell spread can be distinguished from virus cell-free spread in a specified period of time.
Modification of PEG can be used to reduce adherence ability to cells due to large steric hindrance between its long hydrophilic chain and proteins of cells [20, 21]. The amido bond connecting CH3O-PEG-NHS and hydroxyl group of glass can be broken by free radicals, which can lead to the exposure of hydroxyl group on the glass. Therefore, the PEG-ylated glass can regain the adherence ability to cells with oxygen plasma treating. PK15 cells were loaded on these two types of glasses. It showed that cells can hardly adhere to the PEG-ylated glass (Figs. 1A and B). However, cells grew well on PEG-ylated glass treated by oxygen plasma (Figs. 1C and D). The contact angle of glass modified with different groups was measured, which verified that the adherence ability to cells depended on the interaction between substrate and cells to a great extent (Fig. S2 in Supporting information).

|
Download:
|
| Fig. 1. Fabrication of the PEG pattern on the substrate. Cellular growth state on PEG-ylated glass (A, B) and PEG-ylated glass treated with oxygen plasma (C, D). (A, C) Bright field. (B, D) Fluorescence field. Pattern of photoresist AZ 4620 (E), PVA (F), PEG (G) and poly-lysine-FITC (H). | |
PEG pattern was composed of PEG-ylated region and non-PEGylated region (Fig. S1). Firstly, PVA was spin-coated on the PEGylated glass to protect it from photoresist erosion. Next, AZ 4620 was deposited and patterned by UV-light. A pattern of AZ 4620 appeared (Fig. 1E), which was consistent with the mask designed. Subsequently, AZ 4620 pattern was treated by oxygen plasma to etch PVA and PEG not covered by photoresist, followed by the dissolution of photoresist with ethyl alcohol. A pattern of PVA exposed (Fig. 1F). Finally, PVA pattern was removed by ultrasound to expose the PEG pattern (Fig. 1G). As the PEG pattern was not clear in bright field, it was incubated with poly-lysine-FITC (PLL-FITC) labeled. Due to the hydrogen bond between amino group of PLL-FITC labeled and hydroxyl group of glass, non-PEG-ylated area could link to PLL-FITC labeled and presented green fluorescence, while no fluorescence was observed on PEG-ylated areas (Fig. 1H). It suggested that the PEG pattern could be fabricated by combination of matrix modification, soft lithography and oxygen plasma etching, which had a selective adherence ability to cells.
In order to determine the formation of cellular networks, cellular growth state on the PEG pattern was investigated. It showed that cells did not adhere to PEG-ylated region. However, cells adhered to non-PEG-ylated region one hour later. In particular, adherent cells did not fully spread out and tended to grow into independent "islands". A cell pattern was formed as a result (Figs. 2A and D). In order to control cell numbers in cell pattern, PEG patterns with different size were constructed for cell culture. The results showed that a single-cell pattern was formed on the PEG pattern with size of 18 μm × 18 μm (Fig. 2A), in which single-cell ratio was 92% (Fig. 2C). A multi-cell pattern was formed on the PEG pattern with size of 30 μm × 30 μm (Fig. 2D), in which multi-cell ratio was 92.6% (Fig. 2F). It suggested that cell pattern could be formed on the PEG pattern, in which cell numbers and spatial distributions were correlated to the PEG pattern. Single-cell pattern can be achieved by controlling the size of PEG pattern near to cells. Furthermore, cells were cultured continuously to determine the deformation of the pattern. It showed that cells stretched obviously along the PEG pattern, which was accompanied by the formation of cell-to-cell connections. Corresponding single-cell networks (Fig. 2B) and multi-cell networks (Fig. 2E) were formed on the substrate. The results suggested that cells grew into cell patterns on the PEG pattern, which could develop into cellular networks in later culture.

|
Download:
|
| Fig. 2. Micro-images of cellular networks. (A) Single-cell pattern (18 μm × 18 μm PEG pattern) and (D) multi-cell pattern (30 μm × 30 μm PEG pattern) on the glass. (B) Single-cell network and (E) multi-cell network on the glass. Statistical results of cell ratio in single-cell pattern (C) and multi-cell pattern (F). | |
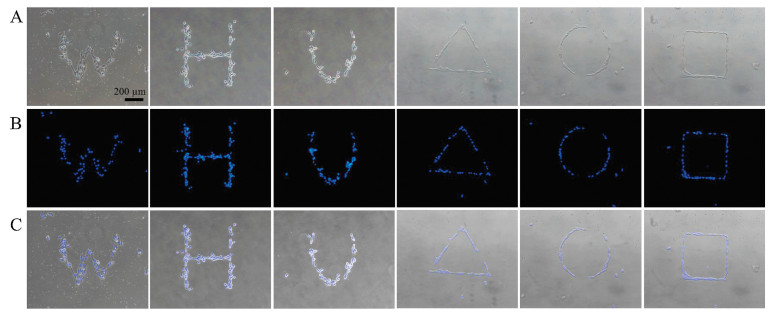
To estimate the controllability and flexibility of cellular networks, PK15 cells were loaded on different PEG patterns such as "WHU" and cultured continuously. It showed that cells could grow into different patterns complementary with PEG patterns. Then, cell patterns developed into corresponding cellular networks with continuous culture (Figs. 3A-C). It suggested that controllable and flexible cellular networks could be constructed on PEG pattern. Microtubules have a fundamental effect on the construction of cytoskeleton [25]. Virus spread is closely related to cytoskeleton [1, 8, 26-29]. In order to explore the arrangement of cytoskeleton on PEG pattern, nucleus and microtubules were stained. It showed that microtubules and nucleus stretched along PEG pattern obviously, which induced cells in adjacent islands connected to each other and grew into cellular networks (Figs. S3A-D in Supporting information).

|
Download:
|
| Fig. 3. Micro-images of different cellular networks. (A) Bright field. (B) Fluorescence field. (C) Merged micrographs. | |
Traditional studies do not distinguish two types of virus spread. Herein, a micro-injector was used to fix the site of virus induced plaque. Cellular networks were combined with a microinjector to explore virus cell-to-cell spread. The injection condition was explored by rhodamine (Fig. S4 in Supporting information). The rate of virus spread was counted by the number of cells infected along a particular direction per hour. This calculation method not only overcome the uncertainty of virus induced plaque, but also limit virus infection in one-dimension, which is more accurate and concise than traditional methods. PRV spread along cellular networks was tracked in situ. It showed that cells began to express green fluorescent proteins at 12 hpi (hours postinfection). Due to the diffusion radius of the virus at the nozzle was about 300 μm, cells in this semicircle region can be infected at the same time. After then, cells were infected one by one along cellular networks from 12 hpi to 28 hpi, which suggested that there was almost no virion in supernatant during this period. However, cells expressed green fluorescent proteins irregularly from 28 hpi to 36 hpi, which indicated that mature virions began to egress and infected cells by cell free diffusion at 28 hpi. After which, the other cells expressed green fluorescent proteins synchronously (Fig. 4A). Notably, cellular networks without connection of nozzles were set up as the control group (Fig. S5 in Supporting information) to explore the time point of virus egress. It showed that virus began to egress outside at 28 hpi nearly, which was consistent with the experiment group.

|
Download:
|
| Fig. 4. (A) Time-lapse images of virus cell-to-cell spread along cellular networks (cellular networks were marked by white dotted lines). Statistical results of (B) virus spread rate and (C) viral titer in supernatant. | |
In order to determine the type of virus spread in different time periods, virus spread rate and titer were measured. The statistics results showed that the average rate of virus spread was nearly 0.5 cell/h from 12 hpi to 28 hpi, while the rate increased to 2.4 cell/h from 28 hpi to 36 hpi (Fig. 4B). It suggested that the rate quickened rapidly 28 h later. It can be speculated that virus spread by cell-to-cell connections before 28 h. Afterwards, virus cell-free spread and virus cell-to-cell spread existed simultaneously due to the egress of assembled mature virions. The titer of extracellular virions was measured to determine the amount of virion in supernatant. The statistics results showed that virus titer was approximately 0 in the initial 18 h, which increased to 2.65 from 18 hpi to 28 hpi (Fig. 4C). It was verified that there were few virions in the supernatant. Therefore, virus spread by cell-to-cell connections predominantly in this period of time. Afterwards, the titer increased to 3.8 from 28 hpi to 36 hpi since assembled mature virions began to release outside at 28 hpi. Virus spread by cell-to-cell connections and cell free diffusion concurrently. Finally, cells were infected altogether due to the release of most assembled mature virions. Virus cell-free spread was the dominant way of spread. The titer of extracellular virions was positively correlated with the rate of virus spread, which demonstrated that virus induced plaque and spread direction could be controlled by combining cellular networks with a microinjector, in which virus cell-to-cell spread can be distinguished from cell-free spread.
In summary, cell patterns were built on the basis of PEG modification and soft lithography, which can develop into cellular networks with continuous culture. Cell numbers and spatial distributions can be precisely controlled in cellular networks. A micro-injector was combined with cellular networks to study PRV cell-to-cell spread on the fixed point, by which the direction of virus spread can be limited in one dimension. Virus cell-to-cell spread could be distinguished from cell-free spread in a specified period of time. This platform can be used to investigate virus cellto-cell spread at the initial infection stage. The spread rate and infection ability of different virus subtypes with gene modification can be compared, which is more time-saving and labor-saving than the complicated one-step growth curve.
AcknowledgmentsThis work was supported by the National Science and Technology Major Project of China (No. 2018ZX10301405) and the National Natural Science Foundation of China (Nos. 21775111, 21475099).
Appendix A. Supplementary dataSupplementary material related to this article can be found, inthe online version, at doi:https://doi.org/10.1016/j.cclet.2019.03.028.
| [1] |
V. Doceul, M. Hollinshead, L.V.D. Linden, et al., Science 327 (2010) 873-876. DOI:10.1126/science.1183173 |
| [2] |
M. Vignuzzi, E. Wendt, R. Andino, Nat. Med. 14 (2008) 154-161. DOI:10.1038/nm1726 |
| [3] |
L.J. Zhang, L. Xia, S.L. Liu, et al., ACS Nano 12 (2018) 474-484. DOI:10.1021/acsnano.7b06926 |
| [4] |
C. Lv, Y. Lin, A.A. Liu, et al., Biomaterials 106 (2016) 69-77. DOI:10.1016/j.biomaterials.2016.08.013 |
| [5] |
P. Zhong, L.M. Agosto, J.B. Munro, et al., Curr. Opin. Virol. 3 (2013) 44-50. DOI:10.1016/j.coviro.2012.11.004 |
| [6] |
W. Mothes, N.M. Sherer, J. Jin, et al., J. Virol. 84 (2010) 8360-8368. DOI:10.1128/JVI.00443-10 |
| [7] |
Q. Sattentau, Nat. Rev. Microbiol. 6 (2008) 815-826. DOI:10.1038/nrmicro1972 |
| [8] |
H.W. Favoreel, G. van Minnebruggen, D. Adriaensen, Proc. Natl. Acad. Sci. U. S. A. 102 (2005) 8990-8995. DOI:10.1073/pnas.0409099102 |
| [9] |
W.J. Lucas, Virology 344 (2006) 169-184. DOI:10.1016/j.virol.2005.09.026 |
| [10] |
S. Kawakami, Y. Watanabe, R.N. Beachy, Proc. Natl. Acad. Sci. U. S. A. 101 (2004) 6291-6296. DOI:10.1073/pnas.0401221101 |
| [11] |
M. Deutsch, A. Deutsch, O. Shirihai, Lab Chip 6 (2006) 995-1000. DOI:10.1039/b603961h |
| [12] |
D.D. Carlo, N. Aghdam, L.P. Lee, Anal. Chem. 78 (2006) 4925-4930. DOI:10.1021/ac060541s |
| [13] |
J. Gao, X.F. Yin, Z.L. Fang, Lab Chip 4 (2004) 47-52. DOI:10.1039/b310552k |
| [14] |
K. Ino, M. Okochi, N. Konishi, Lab Chip 8 (2008) 134-142. DOI:10.1039/B712330B |
| [15] |
X. Ding, S.C.S. Lin, B. Kiraly, Proc. Natl. Acad. Sci. U. S. A. 109 (2012) 11105-11109. DOI:10.1073/pnas.1209288109 |
| [16] |
F. Arai, C. Ng, H. Maruyama, Lab Chip 5 (2005) 1399-1403. DOI:10.1039/b502546j |
| [17] |
D. Gao, H. Wei, G.S. Guo, et al., Anal. Chem. 82 (2010) 5679-5685. DOI:10.1021/ac101370p |
| [18] |
N. LiáJeon, Lab Chip 15 (2015) 3984-3988. DOI:10.1039/C5LC00698H |
| [19] |
N. Faucheux, R. Schweiss, K. Lützow, Biomaterials 25 (2004) 2721-2730. DOI:10.1016/j.biomaterials.2003.09.069 |
| [20] |
E. Wischerhoff, K. Uhlig, A. Lankenau, et al., Angew. Chem. Int. Ed. 47 (2008) 5666-5668. DOI:10.1002/anie.200801202 |
| [21] |
H. Du, P. Chandaroy, S.W. Hui, S.W. Hui, Biochim. Biophys. Acta 1326 (1997) 236-248. DOI:10.1016/S0005-2736(97)00027-8 |
| [22] |
D. Delubac, C.B. Highley, M. Witzberger-Krajcovic, Lab Chip 12 (2012) 4911-4919. DOI:10.1039/c2lc40104e |
| [23] |
X. Li, L. Liu, L. Wang, et al., Lab Chip 11 (2011) 2612-2617. DOI:10.1039/c1lc20258h |
| [24] |
N. Xu, J. Wang, Y.J. Yang, et al., Sci. Sin. Chim. 46 (2016) 525-532. |
| [25] |
J. Pokorný, Bioelectrochemistry 63 (2004) 321-326. DOI:10.1016/j.bioelechem.2003.09.028 |
| [26] |
M. Xiao, N. Xu, C. Wang, et al., Sci. Rep. 7 (2017) 44835. DOI:10.1038/srep44835 |
| [27] |
C. Jolly, K. Kashefi, M. Hollinshead, et al., J. Exp. Med. 199 (2004) 283-293. DOI:10.1084/jem.20030648 |
| [28] |
N. Xu, J. Wang, Z.F. Zhang, et al., Biomaterials 5 (2014) 5049-5055. |
| [29] |
C. Wang, N. Xu, Y.J. Yang, et al., Integr. Biol. (Camb) 9 (2017) 903-911. DOI:10.1039/C7IB00151G |