 2019, Vol. 30


b College of Chemical Engineering, China University of Mining and Technology, Xuzhou 221116, China
The early studies of electrochemical hydrogen adsorption mainly focused on the proton discharge of adsorbed hydrogen atoms. The electrochemical adsorption of hydrogen on platinum electrode surface occurs in the range of potential corrected by specific hydrogen equilibrium potential which is known as hydrogen underpotential deposition (HUPD). The underpotential adsorption of hydrogen is one of the most basic research topics in surface electrochemistry and electrocatalysis. In the past decades, different research groups have systematically studied the adsorption of HUPD on platinum electrode in various media based on single crystal technique [1-10]. The cyclic voltammetry curves of hydrogen deposition on different single crystal electrode surfaces were significantly different, indicating that hydrogen adsorption is highly sensitive to the surface structures [11-15].
Cyclic voltammetry (CV) as one of the most commonly used research methods in electrochemistry, could analyze the surface adsorption process involving charge transfer steps through current peaks. According to the cyclic voltammetry curves of a platinum electrode in dilute sulfuric acid solution, the total charge related to the UPD (underpotential deposition) could be obtained by integrating the current, and then obtain the change of the coverage of the UPD hydrogen on the electrode surface with the electrode potential. The amount of electricity needed to deposit a single layer of hydrogen on platinum electrode unit area is 210 μC/cm2 [16], which is usually used as a benchmark to estimate the active surface area of the platinum electrode. The CV curve of the polycrystalline platinum electrode surface in the hydrogen adsorption process presents two peaks. Generally, the adsorbed hydrogen at the more positive potential peak is called strongly adsorbed hydrogen, which corresponds to the adsorbed hydrogen on the single crystal surface of Pt(100), and the adsorbed hydrogen at the less positive potential is called weakly adsorbed hydrogen, which corresponds to the adsorption of hydrogen on the single crystal surface of Pt (110) [12-14].
Combining CV with high performance liquid chromatography (HPLC) [17-19], the products on the electrode surface that dependent on the corresponding potentials can be detected. The sampling process of the microporous sampler on the electrode surface gives a certain effect on the cyclic voltammetry curves, e.g., accelerates the mass transfer of the reactant diffusion to the electrode surface leading to the increase of the current densities. The sampling process also results in the decrease of the concentration of the intermediates produced on the electrode surface. Therefore, the current density of the anodic peaks of the intermediates will be decreased.
The purpose of this work is to identify and quantify the adsorption of hydrogen on the surface of platinum, which is highly sensitive on surface structure and confirmed the results reported previously [12-14]. The method used in this work provides a new perspective for studying the ion adsorption of the electrode surface.
Commercially available reagents of the highest purity (H2SO4) was used without further purification. All solutions were prepared with the deionized water from a Milli-Q system in a specific conductivity of 18.2 MΩ cm.
A conventional three-electrode electrochemical cell with a volume of 80 mL was used in the experiments. All electrochemical experiments were performed at 25.0 ± 0.1 ℃ kept by a water bath (Polyscience Instruments, USA). The working electrode is a polycrystalline platinum disk with a diameter of 5.0 mm, a large platinum sheet using as a counter electrode. Reversible hydrogen electrode (RHE) was used as the reference electrode (RE). Potentials measured in all experiments are referred to the RHE scale. Before each experiment, the working electrode was first polished with fine alumina powder (0.05μm) and then immersed in a mixture of HNO3 (60%) and H2O2 (30%) with a volume ratio of 1:1 at 60.0 ℃ for 30.0 min. After that, cyclic potential sweeps between 0.05 V and 1.5 V with a scan rate of 50 mV/s were performed in 0.5 mol/L H2SO4 solution for 30.0 min to further clean the electrode surface. Thereafter, the Pt electrode was rinsed repeatedly with Milli-Q water and was transferred into the test solution under the protection of a water droplet on its surface. Before the experiments the electrolyte was deaerated with high purity argon gas for 20–25 min at room temperature. All electrochemical experiments were performed by a computer controlled VSP-300 electrochemical workstation (Bio-logic Ltd., France).
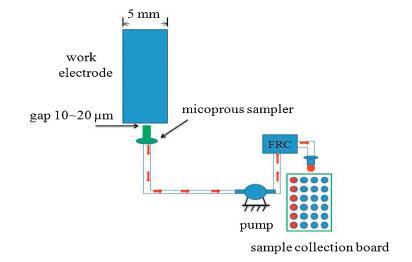
A micro-sized sample collection tip (internal diameter is 0.3 mm) is placed very closely (10~20μm) to the surface of working electrode (diameter is 5 mm) and connect with the peristaltic pump (ISMATEC c.p. 78001-02) by the hose (internal diameter 0.13 mm) during cyclic voltammetry scanning process. The fraction collector (FRC, Agilent G1364C) uses the peristaltic pump to extract the solution near the electrode surface and place it in a microporous plate in which a special interpolation tube for liquid chromatography is inserted in the microporous plate, as shown in Fig. 1.

|
Download:
|
| Fig. 1. Schematic diagram of working principle of microporous sampler at electrode solution interface. | |
The cyclic voltammetry curve of dilute sulfuric acid is shown in Fig. 2. As the potential at 0~0.3 V of hydrogen adsorption and desorption, two hydrogen absorption/desorption peaks in this region at 0.06 V and 0.16 V, corresponding to the adsorption or desorption of hydrogen on the single crystal surface of Pt(110) and Pt(100) was observed. The potential range from 0.3 V to 0.6 V is called the double layer region. Platinum oxide was formed on the electrode surface when the potential is greater than 0.6 V. The cathodic peak at 0.7 V in the reverse sweep is the reduction of platinum oxide on the electrode surface.

|
Download:
|
| Fig. 2. Cyclic voltammetry of dilute sulfuric acid. Conditions are as follows: [H2SO4] = 0.5 mol/L, 50 mV/s, T = 25.0 ± 0.1 ℃. | |
The relationship of the scanning rate with the adsorption/ desorption process of hydrogen and the reduction process of platinum oxide was shown in Fig. S1 (Supporting information). Cyclic voltammetry curve of dilute sulfuric acid solution was obtained by changing the sweep speed and the results showed that a linear relationship between the potential scanning rate and the peak current in the cyclic voltammetry curve of dilute sulfuric acid solution. Therefore, the adsorption and desorption of hydrogen and the reduction of platinum oxide are controlled by the electrode reaction process.
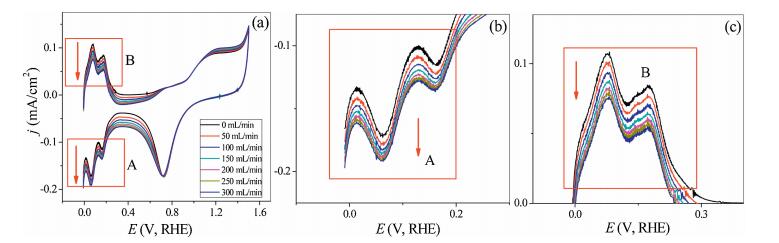
The effect of increase sampling rate on cyclic voltammetry of dilute sulfuric acid is shown in Fig. 3. Region A and region B in Fig. 3a are the adsorption and desorption region of hydrogen on platinum electrode, respectively. The increase of sampling rate was leading to the increase of cathodic current densities of two hydrogen adsorption peaks in region A (Fig. 3b). H+ as the substance in the bulk solution, the sampling process could strengthen the hydrogen ion mass transfer of the bulk solution to the electrode surface, thus the hydrogen ion concentration in the vicinity of the electrode surface increased, and the hydrogen adsorption current density is increased as shown the reaction (R1) [13]. The desorption peak current decreases with the increase of the sampling rate on the electrode surface was shown in Fig. 3c. The desorption current density of hydrogen was decreased with the increase of the sampling rate due to the concentration of hydrogen adsorbed on the electrode surface was decreased with increasing the sampling rate, so the desorption peak current decreased (reaction R2) [13]. The effect of sampling rate on the peak current of adsorption in region "A" was shown in Table S1 (Supporting information) and Fig. 4.

|
(R1) |

|
(R2) |

|
Download:
|
| Fig. 3. Effect of sampling on adsorption/desorption of hydrogen on platinum electrode. Conditions are as follows: [H2SO4] = 0.5 mol/L, 100 mV/s, T = 25.0 ± 0.1 ℃. | |

|
Download:
|
| Fig. 4. Effect of sampling rate on hydrogen adsorption at different sites. Conditions are as follows: [H2SO4] = 0.5 mol/L, 100 mV/s, T = 25.0 ± 0.1 ℃. | |
Fig. 4 shows the effect of the sampling rate on the hydrogen adsorption process on the crystal plane Pt (110) and Pt(100). The slope is 0.037 and 0.054 for Pt(110) and Pt(100), respectively. The slope of a nearly straight line can reflect the degree of difficulty of hydrogen adsorption on different single crystal surfaces, and the bigger the slope is, the easier it is for hydrogen to adsorb on crystal surfaces. It can be seen from Fig. 4 that with the increase of sampling rate, the current of hydrogen adsorption on the crystal plane Pt(100) is larger, indicating that the hydrogen ion in bulk solution diffuses to the electrode surface and adsorbs more strongly on the Pt(100) surface and the adsorption process is shown in reaction (R1). Therefore, this method can compare the adsorption strength of hydrogen at different sites on the surface of the platinum electrode. The hydrogen adsorption intensity on the crystal face Pt(100) is greater than that on Pt(110) surface. The hydrogen adsorption on Pt(100) is a strong adsorption of hydrogen, and on the surface of Pt(110) hydrogen adsorption is weak adsorption of hydrogen.
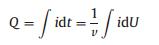
The total amount of hydrogen corresponding to the desorption of hydrogen at the platinum electrode surface can be calculated by Eq. 1.
|
(1) |
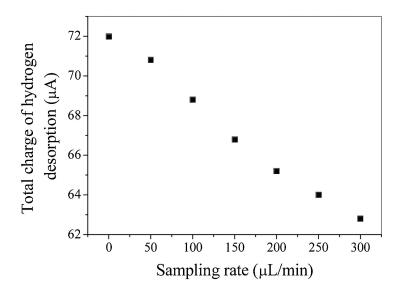
where U is potential and v represents sweep speed. The electric quantity Q is obtained by integrating the oxidation peak of hydrogen on the cyclic voltammetry curve [20]. The total amount of charge is corresponding to the hydrogen on the surface of the electrode. Fig. 5 presents the relationship between the total charge of hydrogen desorption on platinum electrode and the sampling rate. The amount of charge of hydrogen desorption reflects the hydrogen coverage on the platinum electrode surface. It can be seen from Fig. 5 that the total desorption of hydrogen is reduced with the increase of sampling rate, which means that the higher the sampling rate on the surface of platinum electrode, the lower the coverage of hydrogen on the surface of the platinum electrode, and therefore the smaller the charge of desorption of hydrogen on the platinum electrode.

|
Download:
|
| Fig. 5. Relationship between sampling rate and total charge of hydrogen desorption. Other conditions are the following: [H2SO4] = 0.5 mol/L, 100 mV/s, T = 25.0 ± 0.1 ℃. | |
The hydrogen adsorption energy on platinum single crystal is calculated by density functional theory (DFT). The simulation process is as follows: The periodic and self-consistent DFT theoretical calculation of the structure and electronic properties of H on the surface of Pt(111), Pt(110), Pt(100) was carried out by using VASP (Vienna ab initio simulation package) software [21-23]. The generalized gradient approximation (GGA) was used to describe the exchange correlation energy, the van der Waals density function (vdW-DF) with revPBE commutations was used to correction [24], because the relevant parts of the standard GGA function do not generate dispersion, so it is necessary to use a function that correctly calculates the VDW interaction. Using projector-augmented plane-wave (PAW) to describe the electron nuclear interaction, the truncation energy was set as 400 eV [25]. The Brillouin region is sampled with Monkhorst-Pack mesh and the electronic energy is calculated by using Monkhorst-Pack grid k of (3 × 3 × 1) [26]. The crystal surface is composed of four layers of p(3 × 3) crystal cell with a vacuum layer height of 15 Å. During the optimization process, the two layers of platinum atoms at the top and the adsorbed substance can be relaxed and the two layers of platinum atoms at the bottom are fixed at the cross section of the body. The OUTCAR results show that the minimum energy is -24.242 eV and the optimized lattice parameter of platinum is 4.0239 Å as shown in Fig. S2 (Supporting information).
The sites of hydrogen adsorption include top site adsorption, bridge site adsorption, acupoint site adsorption, and for Pt(110), the bridge sites can be divided into short span bridge site and long span bridge site (Fig. 6). The formula for calculating the adsorption energy is shown in Eq. 2 [27]:

|
(2) |

|
Download:
|
| Fig. 6. Adsorption of hydrogen at different sites on platinum single crystal surface. | |
where EA/S(h k l) denotes the energy of hydrogen atoms adsorbed on the surface of platinum single crystal (h k l); EA is the energy of hydrogen atoms species represents as a radical and ES(h k l) is the substrate in the vacuum.
The adsorption energy of hydrogen on different crystal surfaces is calculated as shown in Table 1. The adsorption sites of hydrogen atom at the bridge site, short-bridge site, acupoint site is relatively stable for Pt(100), Pt(110) and Pt(110), respectively.
|
|
Table 1 Calculation of adsorption energies at different adsorption sites on platinum single crystal surface. |

In the case of an external electric field, as the electric field intensity varies in the range of -0.3~0.4eV/Å, the adsorption energies of hydrogen on the three low exponent crystal planes are as follows: Pt(100) > Pt(110) > Pt(111) (Fig. 7). It can be seen from the above diagram that the adsorption energy of hydrogen adsorbed on the bridge site of Pt(100) surface is more negative than that on the bridge of Pt(110) surface under the condition of applied electric field in the range of -0.3~0.4eV/Å which means that the hydrogen atom adsorbed on the surface of Pt(100) bridge site is more stable.

|
Download:
|
| Fig. 7. Changes of hydrogen adsorption energies on different platinum single crystal surfaces under external electric field. | |
Sampling rate regulation could significantly impact on the hydrogen adsorption at different sites of the platinum electrode in dilute sulfuric acid solution. The mass transfer on the electrode surface is enhanced as increasing the sampling rate, leading to the increase of the current of the two hydrogen adsorption peaks. The peak current of the hydrogen adsorption at 0.16V is much larger than that at 0.06V. The two current peaks at 0.16V and 0.06V were proved to corresponding to the adsorption of hydrogen on the surface of Pt(100) and Pt(110), respectively. The sampling process was resulted in the changes of hydrogen adsorption peak current on two platinum single crystal surfaces with different amplitudes. The effect of sampling process on hydrogen adsorption peak on Pt (100) surface was more significant, indicating that the adsorption intensity of hydrogen on Pt(100) and Pt(110) was different and the adsorption strength of hydrogen on Pt(100) is higher than that on Pt(110).
The adsorption energies of hydrogen at different sites on Pt (110), Pt(100), Pt(111) were calculated by DFT simulation without external electric field. The results show that the surface hydrogen is relatively stable when adsorbed at the bridge-type position of Pt (100), the short-range bridge-type position at Pt(110), and the acupoint of Pt(111). After determining the optimum adsorption position, the external electric field was applied to the model, and the variation of hydrogen adsorption energy with the electric field intensity on each single crystal surface is studied. The adsorption energy of hydrogen adsorbed on Pt(100) is lower than that on Pt (110), the adsorption energy of hydrogen on Pt (111) is the highest. The lower the adsorption energy, the higher the hydrogen adsorption intensity on the surface of single crystal.
The DFT simulation was also verified that the adsorption strength of hydrogen on two single crystal surfaces Pt(100) and Pt (110) is different, and the adsorption intensity of hydrogen on surface of Pt(100) is higher than that of Pt(110). It was also found that the hydrogen coverage on the electrode surface decreases with the increase of the sampling rate, which can be confirmed by the integral area of the desorption region of hydrogen in the cyclic voltammetry curve.
In summary, this work represents an experiment and DFT calculation study of hydrogen adsorption on polycrystalline platinum electrode. Through adjusting the sampling process of microporous sampler on platinum electrode surface, the current variation of hydrogen adsorption and desorption on the platinum electrode surface was detailed studied, which indicated that the adsorption peak of hydrogen at the higher potential was more affected by the sampling process, which indicates that the adsorption strength of hydrogen on Pt(100) is higher than that on Pt(110). The DFT simulation results show that the adsorption energy of hydrogen on Pt(100) is much lower than that on Pt(110). The bridged position of hydrogen on Pt(100) and the short-range bridged position on Pt(110) are the optimal adsorption site. The above results show that the adsorption process of hydrogen on platinum electrode is structure sensitive. The effect of forced convection on the surface of the electrode provides a new perspective to study the adsorption and desorption process of hydrogen on the surface of platinum electrode.
AcknowledgmentsThis work was supported by the National Natural Science Foundation of China (No. 21773304), the Fundamental Research Funds for the Central Universities (No. 2015XKZD09), the Natural Science Foundation of Jiangsu Province (No. BK20160240), and the Research and Innovation Project for College Graduates of Jiangsu Province (No. KYLX16_0549), the Research Foundation Project of Zaozhuang University (No. 2017YB24) and Doctoral Foundation Program of Zaozhuang University (No. 2018BS060, 102201702).
Appendix A. Supplementary dataSupplementary material related to this article can be found, in the online version, at doi:https://doi.org/10.1016/j.cclet.2019.04.054.
| [1] |
J. Clavilier, A. Rodes, K.E.I. Achi, M.A. Zamakhchari, J. Chim. Phys. 88 (1991) 1291-1337. DOI:10.1051/jcp/1991881291 |
| [2] |
N. Markovic, M. Hanson, G. Mcdougall, J. Electroanal. Chem. 214 (1986) 555-566. DOI:10.1016/0022-0728(86)80124-3 |
| [3] |
S. Kan, A. Iannelli, B. Love, J. Electroanal. Chem. 226 (1987) 351-360. DOI:10.1016/0022-0728(87)80057-8 |
| [4] |
N.M. Marković, N.S. Marinković, R.R. Adžić, J. Electroanal. Chem. 241 (1988) 309-328. DOI:10.1016/0022-0728(88)85134-9 |
| [5] |
I.M. Tidswell, N.M. Markovic, P.N. Ross, Phys. Rev. Lett. 71 (1993) 1601. DOI:10.1103/PhysRevLett.71.1601 |
| [6] |
I.M. Tidswell, N.M. Markovic, P.N. Ross, J. Electroanal. Chem. 376 (1994) 119-126. DOI:10.1016/0022-0728(94)03553-9 |
| [7] |
C.A. Lucas, N.M. Markovic, P.N. Ross, Phys. Rev. Lett. 77 (1996) 4922. DOI:10.1103/PhysRevLett.77.4922 |
| [8] |
B.E. Conway, B.V. Tilak, Electrochim. Acta 47 (2002) 3571-3594. DOI:10.1016/S0013-4686(02)00329-8 |
| [9] |
K. Domke, E. Herrero, A. Rodes, J. Electroanal. Chem. 552 (2004) 115-128. |
| [10] |
J.H. Barber, B.E. Conway, J. Electroanal. Chem. 461 (1999) 80-89. DOI:10.1016/S0022-0728(98)00161-2 |
| [11] |
B.E. Conway, J. Barber, S. Morin, Electrochim. Acta 44 (1998) 1109-1125. DOI:10.1016/S0013-4686(98)00214-X |
| [12] |
A. Björling, E. Ahlberg, J.M. Feliu, Electrochem. Commun. 12 (2010) 359-361. DOI:10.1016/j.elecom.2009.12.034 |
| [13] |
W. Sheng, Z. Zhuang, M. Gao, et al., Nat. Commun. 6 (2015) 5848. DOI:10.1038/ncomms6848 |
| [14] |
A.M.A. Gómez-Marín, J.M. Feliu, Electrochem. Acta 82 (2012) 558-569. DOI:10.1016/j.electacta.2012.04.066 |
| [15] |
J. Clavilier, K.E. Actii, M. Petit, J. Electroanal. Chem. 295 (1990) 333-356. DOI:10.1016/0022-0728(90)85026-2 |
| [16] |
I. Kanezashi, S. Nohara, J. Omura, J. Electroanal. Chem. 662 (2011) 123-129. DOI:10.1016/j.jelechem.2011.04.004 |
| [17] |
Y. Kwon, M.T.M. Koper, Anal. Chem. 82 (2010) 5420. DOI:10.1021/ac101058t |
| [18] |
J. Yang, Y. Kwon, M. Duca, Anal. Chem. 85 (2013) 7645-7649. DOI:10.1021/ac401571w |
| [19] |
W. Zhang, C. Pan, Q. Gao, J. Phys. Chem. C 122 (2018) 24150-24157. DOI:10.1021/acs.jpcc.8b07540 |
| [20] |
J.B. Raoof, R. Ojani, S. Rashid-Nadimi, Electrochim. Acta 49 (2004) 271-280. DOI:10.1016/j.electacta.2003.08.009 |
| [21] |
G. Peng, L.R. Merte, J. Knudsen, T.V. Ronnie, J. Phys. Chem. C 114 (2010) 21579-21584. DOI:10.1021/jp108475e |
| [22] |
G. Kresse, J. Furthmüller, Phys. Rev. B 54 (1996) 11169-11186. DOI:10.1103/PhysRevB.54.11169 |
| [23] |
G. Kresse, J. Furthmüller, Comput. Mater. Sci. 6 (1996) 15-50. DOI:10.1016/0927-0256(96)00008-0 |
| [24] |
J.P. Perdew, Y. Wang, Phys. Rev. B 45 (1992) 13244-13249. DOI:10.1103/PhysRevB.45.13244 |
| [25] |
G. Kresse, D. Joubert, Phys. Rev. B 59 (1999) 1758-1775. DOI:10.1103/PhysRevB.59.1758 |
| [26] |
J.D. Pack, H.J. Monkhorst, Phys. Rev. B 13 (1976) 5188-5192. DOI:10.1103/PhysRevB.13.5188 |
| [27] |
E.M. Patrito, F.P. Cometto, P. Paredes-Olivera, J. Phys. Chem. B 108 (2004) 15755-15769. DOI:10.1021/jp048278r |