 2019, Vol. 30


b College of Chemistry and Chemical Engineering, Jiangxi Normal University, Nanchang 330022, China
CO is an inflammable and explosive gas pollutant and always produced in our daily life and industrial processes. At present, simply oxidation of CO into CO2 is one of the most economic and effective method to remove CO [1]. Under normal condition, CO oxidation and removal require high temperature, high energy consumption and may lead to explosion accidents. Therefore, it is of practical significant to study low (room) temperature CO catalytic oxidation to eliminate CO pollution [2].
It is reported that the supported noble catalysts, e.g., Pt [3], Au [4], Pd [5] and Ag [6], are active for CO oxidation. Palladium, as a precious metal, its nanoparticles show excellent catalytic activity toward the oxidation of CO. Among the noble metals, the melting points of Ag, Au, Pd and Pt successively increase [7]. Ag and Au nanoparticles are more prone to sintering than Pd and Pt. In addition, Pd was much cheaper than Pt [8], and it had been intensively studied as an alternative for Pt. Pd catalysts show excellent activities for oxidative decomposition of chlorinated hydrocarbons and CO oxidation [9]. It has been reported in the literatures that various ionic and metallic Pd species such as Pd2+, Pd1+, and Pd0 can adsorb CO at low temperature [10].
CeO2 is a typical of fluorite structure, semiconductor material, has high oxygen storage capability as well as unique redox property [11, 12]. It is an important oxide in heterogeneous catalysis and can be used as support due to its redox performance [13]. It was reported that ceria is an active support for palladium catalysis, the interaction between the reversible Ce4+/Ce3+ and Pd1+/Pd0 reactions ensures the high catalytic activity for CO oxidation [14]. CeO2 has cubes [15], rods [16], particles [17], octahedrons [18], tubes [19], hollow spheres [20], etc. Different shapes often expose different active planes and display different surface structures [21]. Zhang et al. studied the catalytic performance of the Au nanoparticles supported on the ceria nanocubes and nanotubes, which were prepared via deposition-precipitation method [22]. It is found that Au supported on the nanotubes show much better activity and stability than on the nanocubes for CO oxidation.
In this work, the palladium is chosen as the active component for CO oxidation. The CeO2NT which is synthesized via hydrothermal method was used as support [23]. The amount of Pd loading on CeO2NT supports is optimized in the range of 0.5%–2.0% with 0.5% interval. Then we increase the catalyst activity by changing the reduction temperature, we found that 1.5%Pd/CeO2NT catalytic activity is the best after 350 ℃ hydrogen reduction.
Catalytic activity test for CO oxidation to CO2 were performed using a continuous-flow fixed-bed reactor under atmospheric pressure. 100 mg of catalyst was loaded into the tubular reactor (inner diameter = 4 mm, length = 400 mm). Prior to each test, the catalyst was pretreated at 150 ℃ for 2 h under H2 atmosphere and subsequently cooled to room temperature. The flow of the reactant gas (CO:O2:N2 = 3:3:94) is 30 mL/min, which corresponds to a gas hourly space velocity (GHSV) of 18, 000 h-1. The activity of the samples was measured in the temperature range of 40–180 ℃, and the products were analyzed per 10 ℃. The reaction was stabilized at each temperature for 50 min to obtain steady reaction data. The composition of the reaction products was analyzed using an online gas chromatograph (GC7900) equipped with a TDX-01 column and a thermal conductivity detector (TCD). The catalytic performances of these catalysts were evaluated by the conversions of CO.
Fig. S1 (Supporting information) shows the XRD pattern of 1.5% Pd/CeO2NT catalyst reduced at different reduction temperatures. Compared with the XRD standard spectrum of CeO2 (JCPDS No. 43- 1028), the synthesized material is CeO2, which has obvious structure of cubic fluorite. The characteristic diffraction peaks at 28.5°, 33.0°, 47.4°, 56.3°, 59.1°, 69.4°, 76.7° and 79.1° corresponding to the (111), (200), (220), (311), (222), (400), (331) and (420) crystal surfaces of CeO2, respectively. Reduction temperature rise does not influence the crystal structure of the CeO2. All samples reduced at different temperature show narrow and sharp diffraction peaks, indicating the good crystallinity of prepared CeO2NT. After the loading of 1.5 wt% Pd, no other impure peaks were observed, which indicates the loaded Pd nanoparticles via impregnation method had small particle size and good dispersion on the support.
Table S1 (Supporting information) shows the BET surface area, average pore volume and pore diameter of the samples. Compared with CeO2NT, their specific surface area, pore volume and pore diameter of Pd/CeO2NT were reduced. Fig. S2 (Supporting information) shows that all samples show the isotherms of type IV with a H1 hysteresis loop. According to the pore size distribution diagram, the pore size of the sample is mainly distributed around 4–5 nm, which belongs to the mesopore.
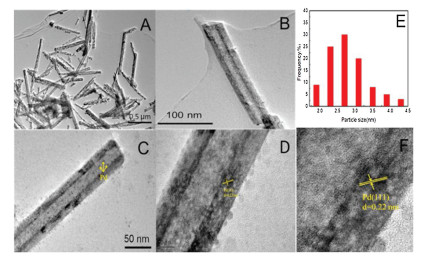
The microstructure of the catalyst was characterized by transmission electron microscopy (TEM). It can be seen from the Fig. 1 that the hydrothermal synthesis of CeO2NT has a good forming effect. It can be clearly seen from the figure that the synthesized CeO2NT have obvious tubular structure. The inner diameter of CeO2NT is about 10 nm. The thickness of the nanotube wall is about 5 nm, and the length of the nanotube is 300–800 nm. It can be seen from Figs. 1C-E that the loaded Pd nanoparticles are about 2–3 nm in size. The distribution of Pd nanoparticles on CeO2NT as well as the Pd particle size are uniform. This shows that Pd nanoparticles loaded by equal volume impregnation method have good dispersion.

|
Download:
|
| Fig. 1. (A–D) TEM images of 1.5%Pd/CeO2NT, (E) shows the Pd particle size distribution of 1.5%Pd/CeO2NT, and (F) shows the d-spacing of the Pd(111). | |
Fig. 2 shows the H2-TPR results for Pd/CeO2NT catalyst reduced at 150, 250 and 350 ℃, respectively. It is found that there are three main reduction peaks for 150 ℃ Pd/CeO2NT, 250 ℃ Pd/CeO2NT and 350 ℃ Pd/CeO2NT. The first peak below 200 ℃ belongs to the reduction peaks of PdO [24]. The other two peaks are reduction peaks of CeO2 [25]. The peak in the temperature range of 450– 500 ℃ belongs to the reduction peak of oxygen on the CeO2 surface. The peak at around 800 ℃ presents the reduction of oxygen in the CeO2 crystal lattice. As the reduction temperature rises, the reduction peak of PdO species gradually shifted to lower temperature. It indicates that the interaction of PdO and CeO2 became weaker after high temperature reduction. In addition, as the reduction temperature rises, the reduction temperature of the surface oxygen and lattice oxygen of CeO2 also shift to lower temperature. The catalyst amount used in the test is 50 mg, the corresponding peak area in the figure can present the hydrogen consumption during the H2-TPR. It shows that the samples reduce at 350 ℃ has the largest hydrogen consumption, followed by 250 ℃ Pd/CeO2NT and 150 ℃ Pd /CeO2NT.

|
Download:
|
| Fig. 2. H2-TPR results of catalyst. | |
Fig. S3 (Supporting information) shows the Raman spectrum of catalyst. Four Raman peaks were observed for all samples. The strongest peak at 461 cm-1, and the other three peaks in order: 260, 598 and 1170 cm-1. The peak at 260 cm-1 corresponds to the first-order lateral vibration mode of CeO2, and the symmetric stretching vibration of Ce-O-Ce at 461 cm-1 is typical vibration of CeO2 fluorite structure with the vibration mode of F 2g [26]. The peak heights and peak areas of the three catalysts at 461 cm-1 are similar, which indicates that the structure of CeO2 has not changed. In addition, the peak at 590 cm-1 belongs to the vibration of defects in CeO2. The content of oxygen vacancy in CeO2 can be measured by calculating the corresponding peak area in Raman spectrum. The value of I(1171+590)/I461 corresponds to the defect degree of CeO2 [27]. The results show that the 350 ℃ 1.5%Pd/CeO2NT sample has the highest oxygen deficiency(0.061), followed by 250 ℃ Pd/ CeO2NT(0.046) and 150 ℃ Pd/CeO2NT(0.039).
Fig. S4 (Supporting information), shows the XPS spectrum of Ce and Pd 3d electrons for samples 150 ℃ 1.5%Pd/CeO2NT, 250 ℃ 1.5% Pd/CeO2NT and 350 ℃ 1.5%Pd/CeO2NT. In Fig. S4A-C, V1-V6 (882.0, 888.0, 897.8, 900.5, 907.0 and 916.3 eV) belongs to the six peaks of Ce4+ 3d, and U1-U4 (881.0, 884.0, 899.3 and 902.3 eV) belong to the four peaks of Ce3+ 3d [28]. It was reported that the area ratio of Ce3+/Ce4+ indicates the concentration of Ce3+, and Ce3+ indicates the content of oxygen vacancy on the surface of CeO2. Our calculation results show that the Ce3+/Ce4+ ratios of 150 ℃ 1.5%Pd/ CeO2NT, 250 ℃1.5%Pd/CeO2NT and 350 ℃1.5%Pd/CeO2NT are 24.45%, 26.35% and 30.42% respectively. The sample 350 ℃ 1.5% Pd/CeO2NT has most content of surface oxygen vacancy.
The characteristic peaks of Pd 3d5/2 at 335.3–335.6 eV and 337.7–337.8 eV belong to the characteristic peaks of metal Pd and PdO, while the characteristic peaks of Pd 3d3/2 at 340.3–340.9 eV and 343.0–343.1 eV belong to the characteristic peaks of metal Pd and PdO. Table S2 (Supporting information) presents the Pd2+ and Pd0 content on the sample surface, 350 ℃ 1.5%Pd/CeO2NT has the highest Pd0 content, accounting for about 41.6%, and no characteristic peaks of Pd0 was found for 150 ℃
1.5%Pd/CeO2NT, indicating the higher reduction temperature, the more surface Pd were reduced. Early activity test found that 350 ℃ 1.5%Pd/CeO2NT could completely transform CO at 70 ℃. It should be noted that the content of Ce3+ and Pd0 of 350 ℃ 1.5%Pd/ CeO2NT was the highest. Both the contents of Ce3+ and Pd0 are beneficial to transfer the lattice oxygen of CeO2 to the surface of catalyst and promote the CO oxidation reaction.
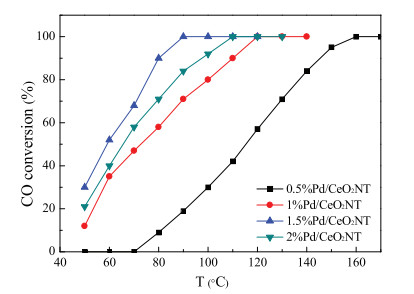
Fig. 3 shows the activity test of the samples with different Pd content toward CO oxidation. 100 mg catalysts were used for each test. The samples are reduced in the 30 mL/min H2 flow at 150 ℃ for 2 h before the CO oxidation reaction. It shows that 0.5%Pd/ CeO2NT achieves completely conversion of CO at 190 ℃, vs. 1%Pd/ CeO2NT at 150 ℃, 1.5%Pd/CeO2NT at 100 ℃ and 2%Pd/CeO2NT at 120 ℃. It indicates that the best Pd content is 1.5%. The reason for this phenomenon is that the amount of Pd supported on the CeO2NT reaches a saturated state. When the Pd loading amount increases to 2%, the Pd nanoparticles agglomerate on the CeO2NT, which leads to poor catalytic activity.

|
Download:
|
| Fig. 3. CO oxidation catalyzed by Pd/CeO2NT with different Pd loading. | |
Though the loading of Pd at 1.5% is best, the temperature at which CO is completely converted is still high (100 ℃). We further optimized the reduction temperature of the sample 1.5%Pd/ CeO2NT for CO oxidation. The sample was pretreated under a hydrogen atmosphere at different reduction temperatures (150 ℃, 250 ℃, 350 ℃ and 450 ℃). The treated catalyst was sequentially labeled as: 150 ℃ 1.5%Pd/CeO2NT, 250 ℃ 1.5%Pd/ CeO2NT, 350 ℃ 1.5%Pd/CeO2NT and 450 ℃ 1.5%Pd/CeO2NT. Fig. 4 shows the catalytic tests results for CO oxidation. 150 ℃ 1.5%Pd/ CeO2NT reaches completely conversion of CO at 100 ℃. As the reduction temperature raise to 250 ℃, the catalytic activity of the catalyst is remarkably improved. The CO conversion reached 30% at 50 ℃, which has been significantly improved compared with the catalytic effect of 1.5%Pd/CeO2NT at 150 ℃. 250 ℃ 1.5%Pd/ CeO2NT achieves completely conversion of CO at 90 ℃. 350 ℃ 1.5% Pd/CeO2NT show the best catalytic activity, which achieve completely CO conversion at 70 ℃. Since the hydrogen treated catalyst at 350 ℃ makes more Pd in the form of Pd0, as well as the Ce3+ content increases, which facilitates the movement of oxygen between the boundary of the Pd and CeO2, and further benefits to the activation of gas oxygen. However, as the reduction temperature raise to 450 ℃, It achieves completely conversion of CO at 120 ℃. It indicates that the pretreatment temperatures have an important influence on the catalytic performance of the catalyst.

|
Download:
|
| Fig. 4. CO oxidation catalyzed by 1.5%Pd/CeO2NT with different reduction temperatures. | |
Fig. S5 (Supporting information) shows the stability of the 1.5% Pd/CeO2NT catalysts reduced at different temperature. All catalyst stability evaluations are carried out at 60 ℃ for 60 h. It shows that three catalysts have good stability. No obvious CO conversion fluctuation was observed during the test.
CeO2NT supported Pd catalysts are prepared with the hydrothermal synthesized CeO2NT and GSH reduced Pd nanoparticles via impregnation. The content of Pd loading and the catalysts reduction temperature are optimized to the CO oxidation reduction. Our results show that the best Pd loading is 1.5%Pd/ CeO2NT, and the catalyst with 1.5%Pd/CeO2NT has the best catalytic performance after 350 ℃ reduction, which can achieve completely conversion of CO at 70 ℃. The XRD, Raman, H2-TPR, TEM, BET and XPS characterization reveal that the excellent catalytic performance of 350 ℃ 1.5%Pd/CeO2NT sample is because the hydrogen treatment catalyst at 350 ℃ makes more Pd in the form of Pd0, the content of Ce3+ increases, and the movement rate of oxygen between the crystal lattices is accelerated, which is beneficial to the activation of gaseous oxygen.
AcknowledgementsThis project is supported by the National Natural Science Foundation of China (Nos. 21868016, 21366020 and 21875096), Natural Science Foundation of Jiangxi Province (Nos. 20181BAB203016, 20122BAB203009) and the Key Laboratory of Jiangxi Province for Environment and Energy Catalysis of Jiangxi Province (No. 20181BCD40004).
Appendix A. Supplementary dataSupplementary material related to this article can be found, in the online version, at doi:https://doi.org/10.1016/j.cclet.2019.03.030.
| [1] |
M. Haruta, T. Kobayashi, H. Sano, N. Yamada, Chem. Lett. 16 (1987) 405-408. DOI:10.1246/cl.1987.405 |
| [2] |
J. Li, Y. Tang, Y.Y. Ma, Z.Y. Zhang, ACS Appl. Mater. Int. 10 (2018) 38134-38140. DOI:10.1021/acsami.8b15585 |
| [3] |
X. Hong, Y. Sun, Catal. Lett. 146 (2016) 2001-2008. DOI:10.1007/s10562-016-1828-0 |
| [4] |
A. Abd El-Moemen, A.M. Abdel-Mageed, J. Bansmann, et al., J. Catal. 341 (2016) 160-179. DOI:10.1016/j.jcat.2016.07.005 |
| [5] |
S.Y. Wang, N. Li, M R., et al., J. Mol. Catal. A:Chem. 374- 375 (2013) 53-58. |
| [6] |
X. Zhang, Z. Qu, F. Yu, Y. Wang, Chin. J. Catal. 34 (2013) 1277-1290. DOI:10.1016/S1872-2067(12)60610-X |
| [7] |
J. Wu, L. Zeng, D. Cheng, et al., Chin. J. Catal. 37 (2016) 83-90. DOI:10.1016/S1872-2067(15)60913-5 |
| [8] |
J.R. González-Velasco, A. Aranzabal, J.I. Gutiérrez-Ortiz, et al., Appl. Catal. B 19 (1998) 189-197. DOI:10.1016/S0926-3373(98)00078-2 |
| [9] |
M. Zhou, M.H. Li, C.J. Hou, et al., Chin. Chem. Lett. 29 (2018) 787-790. DOI:10.1016/j.cclet.2018.03.010 |
| [10] |
J. Watson, J. Catal. 210 (2002) 295-312. DOI:10.1006/jcat.2002.3675 |
| [11] |
R.B. Zhang, K. Lu, L.J. Zong, et al., Appl. Surf. Sci. 416 (2017) 183-190. DOI:10.1016/j.apsusc.2017.04.158 |
| [12] |
Y. Ryou, J. Lee, H. Lee, et al., Catal. Today 258 (2015) 518-524. DOI:10.1016/j.cattod.2015.02.009 |
| [13] |
L.H. Xiao, K.P. Sun, X.L. Xu, X.N. Li, Catal. Commun. 6 (2005) 796-801. DOI:10.1016/j.catcom.2005.07.015 |
| [14] |
Y. Ryou, J. Lee, H. Lee, C.H. Kim, D.H. Kim, Catal. Today 307 (2018) 93-101. DOI:10.1016/j.cattod.2017.02.025 |
| [15] |
S. Yang, L. Gao, J. Am. Chem. Soc. 128 (2006) 9330-9331. DOI:10.1021/ja063359h |
| [16] |
Y. Chen, T. Liu, C. Chen, et al., Ceram. Int. 39 (2013) 6607-6610. DOI:10.1016/j.ceramint.2013.01.096 |
| [17] |
A.I.Y. Tok, F.Y.C. Boey, Z. Dong, X.L. Sun, J. Mater. Process. Technol. 190 (2007) 217-222. DOI:10.1016/j.jmatprotec.2007.02.042 |
| [18] |
G. Shen, Q. Wang, Z. Wang, Y. Chen, Mater. Lett. 65 (2011) 1211-1214. DOI:10.1016/j.matlet.2011.01.057 |
| [19] |
K.L. Yu, G.L. Ruan, Y.H. Ben, J.J. Zou, Mater. Sci. Eng. B 139 (2007) 197-200. DOI:10.1016/j.mseb.2007.02.011 |
| [20] |
D. Liu, K. Nakashima, Inorg. Chem. 48 (2009) 3898-3900. DOI:10.1021/ic900078s |
| [21] |
Z.L. Wu, D.R. Mullins, L.F. Allard, Q.F. Zhang, L.S. Wang, Chin. Chem. Lett. 29 (2018) 795-799. DOI:10.1016/j.cclet.2018.01.038 |
| [22] |
R.B. Zhang, K. Lu, L.J. Zong, et al., Mol. Catal. 442 (2017) 173-180. DOI:10.1016/j.mcat.2017.09.024 |
| [23] |
G. Chen, S. Sun, X. Sun, W. Fan, T. You, Inorg. Chem. 48 (2009) 1334-1338. DOI:10.1021/ic801714z |
| [24] |
C. Wang, C. Wen, J. Lauterbach, E. Sasmaz, Appl. Catal. B 206 (2017) 1-8. DOI:10.1016/j.apcatb.2017.01.020 |
| [25] |
L.F. Yang, C.K. Shi, X.E. He, J.X. Cai, Appl. Catal. B 38 (2002) 117-125. DOI:10.1016/S0926-3373(02)00034-6 |
| [26] |
T.Y. Guo, J.P. Du, J.P. Li, J. Mater. Sci. 51 (2016) 10917-10925. DOI:10.1007/s10853-016-0303-z |
| [27] |
L. Liu, Z. Yao, Y. Deng, et al., ChemCatChem 3 (2011) 978-989. DOI:10.1002/cctc.v3.6 |
| [28] |
Z. Hu, X. Liu, D. Meng, et al., ACS Catal. 6 (2016) 2265-2279. DOI:10.1021/acscatal.5b02617 |