 2019, Vol. 30


b State Key Laboratory of Environmental Criteria and Risk Assessment, Research Center of Water Pollution Control Technology, Chinese Research Academy of Environmental Sciences, Beijing 100012, China;
c Shenzhen Environmental Science and New Energy Technology Engineering Laboratory, Tsinghua-Berkeley Shenzhen Institute, Shenzhen 518055, China
Microalgal bioenergy has been considered as one of the most promising substitutes of fossil fuels by many researchers [1, 2]. However, resource consumption during large-scale microalgal cultivation would be huge, which might make the production of microalgal bioenergy unsustainable. Recent life-cycle assessment highlighted the water consumption during microalgal cultivation and harvest [3], and it is essential to reuse the culture medium after the harvest of microalgal biomass in order to reduce the water consumption.
However, after microalgal cultivation the remaining culture medium would contain some extracellular organic matters released by microalgal cells during growth. These organic matters consist of carbohydrates, amino acids, proteins, lipids, organic acids and so on [4]. Some of them are soluble and thus would be left in the culture medium after the process of microalgal biomass harvest. In the previous studies, such kind of microalgal products were defined as soluble algal products (SAPs) [5-7]. SAPs are very difficult to remove by common harvest processes, and may show negative effects on microalgal cultivation, including inhibiting microalgal growth [7, 8], inducing bacterial growth [6] and so on. Therefore, it is necessary to analyze the composition of SAPs comprehensively.
A fractionation method developed by Leenheer [9] is extensively used for the characterization of dissolved organic matters (DOMs) within natural water and wastewater. This method utilizes three kinds of resin to fractionate DOM into six categories, namely, hydrophobic acids (HOA), hydrophobic bases (HOB), hydrophobic neutrals (HON), hydrophilic acids (HIA), hydrophilic bases (HIB) and hydrophilic neutrals (HIN) based on the hydrophilic-hydrophobic/acid-base properties. Similar approaches were used in the investigation of SAPs [7].
Besides resin fractionation, the molecule weight (MW) distribution analysis is also one of the most commonly-used methods to identify specific constitutes within a complex system. MW distribution can be determined by size exclusion chromatography (SEC), and this method was applied to characterize SAPs by several researchers. Results showed that the MW of SAPs released by different microalgal strains are ranging widely [10, 11]. Henderson et al. [10] found that the SAPs of C. vulgaris and M. aeruginosa had bimodal distribution mainly in the range of greater than 30 kDa and less than 1 kDa; while the SAPs of the diatomic A. formosa and Melosira sp. were of smaller MW ranged mainly less than 1 kDa.
Generally, resin fractionation and MW distribution analysis were originally developed to investigate the composition of DOM and natural organic matter (NOM), and have been widely used in the characterization of SAPs. However, the comprehensive characterization of SAPs based on the combination of these methods mentioned above is still limited. In the previous investigation of DOMs within natural water and wastewater, a fingerprint analysis method was proposed by Tang et al. [12] to integrate the information revealed by resin fractionation and MW distribution analysis. In this study, similar analysis methods were applied to characterize the composition of SAPs released by Scenedesmus sp. LX1. Based on these results, the fingerprint profile of SAPs of Scenedesmus sp. LX1 was established.
Scenedesmus sp. LX1 (S. LX1) used in this study was originally isolated by Li et al. [13] from tap water. This microalgal strain could grow well in unsterilized domestic secondary effluent with superior ability of removing nitrogen and phosphorus from wastewater. It has great potential to be applied in wastewater treatment and microalgal biomass production. It was maintained on agar plate containing BG11 medium in an artificial climate chamber (HPG-280 H) and cultivated in photobioreactor [5]. The main analytical methods including acquirement of SAPs and the determination of SAP concentration (Method S1), fractionation with resins (Method S2), Fluorescence spectroscopy analysis of SAP fractions (Method S3) and SEC analysis of SAP fractions (Method S4) are provided in Supporting information.
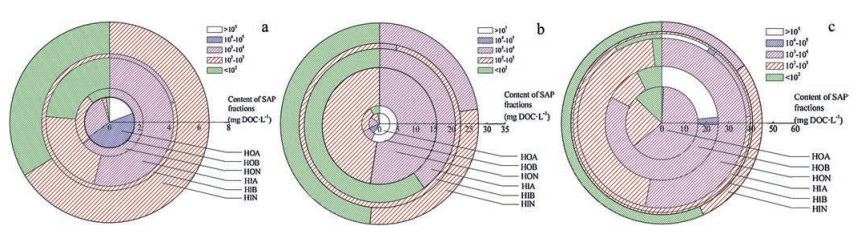
The fingerprint graphs of the SAPs released by Scenedesmus sp. LX1 at different growth phase is shown in Fig. 1. Every circle in this figure represents one of the six resin fractions, the width of the circle represents the percentage content of each resin fraction in the SAPs and the distribution of different patterns in each circle represents the MW distribution in each resin fraction.

|
Download:
|
| Fig. 1. The fingerprint graphs of the SAPs released by Scenedesmus sp. LX1 at different growth phase. (a) SAPs of logarithmic growth phase; (b) SAPs of stationary growth phase; (c) SAPs of late stationary growth phase. | |
During the growth process, the concentration of SAPs increased continuously, from 6.71 ±0.34 mg/L at logarithmic growth phase to 45.1 ±0.95 mg/L at late stationary growth phase. At logarithmic growth phase, the DOC (dissolved organic carbon) concentration of each resin fraction in the SAPs was below 2.5 mg/L, and the content of hydrophilic fractions was higher than that of hydrophobic fractions, with HIA, HIN and HOA as the main fractions (the content in the DOC was higher than 24%). The MW distribution in the six resin fractions ranged mainly from 102 Da to 104 Da, and only a few matters with the MW more than 104 Da were found in HOA. In HIA and HON, matters with the MW of 103-104 Da accounted for 50%; while in HIN the content of matters with the MW of 102-103 Da was higher than 60%.
During stationary growth phase, the DOC concentration of each resin fraction increased, and the content of hydrophobic fractions in the total DOC increased to over 58%. The DOC concentration of HON became the highest among all the resin fractions (11 mg DOC L-1), accounting for over 40% in the total DOC. The content of HOB increased significantly from 0.35% to 7.3%, while the content of HIA, HIN and HOA decreased. In HOA and HOB, matters with MW more than 104 Da were the main components. In HON, the amount of matters with MW of 102-103 Da increased significantly to about 50%; while in HIA and HIN, matters with MW less than 102 Da became the main components.
In the SAPs at the late stationary growth phase, the content of hydrophobic fractions further increased to as high as 84%. Especially, the DOC concentration of HOA and HOB increased significantly to 16.2 and 9.2 mg/L, amounting to 35.9% and 20.4% in the total DOC. In these two resin fractions, the amount of matters with MW of 103-104 Da increased significantly to about 60%. The MW distribution in HON, HIB and HIN showed no significant change. While in HIA, matters with MW of 102-103 Da increased significantly and accounted for over 60%.
In summary, as revealed by the fingerprint graph, during the growth process the composition of SAPs released by Scenedesmus sp. LX1 changed significantly. The main components changed from the hydrophilic matters with MW of 102-103 Da at the logarithmic growth phase to the hydrophobic matters with MW of 103-104 Da at late stationary growth phase. At three different growth phases, the main sub-fractionwas matters with MW of 102-103 Da in HIN at the logarithmic growth phase, matters with MW of 103-104 Da in HON at the stationary growth phase, and matters with MW of 103-104 Da in HOA and HON at the late stationary growth phase, respectively.
In the previous study, we found that the SAPs could inhibit the growth of Scenedesmus sp. LX1, and HIA and organic bases showed the strongest inhibition. The molecular weight (MW) of HIA mainly distributed in the range of 0.15–7 kDa [7]. As shown in Fig. 1, during the growth process, the fractions of organic bases (HOB and HIB) increased gradually, and the matters with MW of 103-104 Da became the dominant fraction, indicating the growth inhibitory potential of SAPs became stronger. The effect of SAPs might be related to the growth cessation at the stationary phase.
In order to relieve the inhibitory effect of SAPs before water reuse of microalgal cultivation, SAPs should be removed. According to the change of composition, well-directed methods could be used to remove SAPs. For the SAPs at stationary phase and the late stationary phase, the content of hydrophobic fractions with higher MW was the main components, and therefore coagulation and sedimentation should be able to remove most of SAPs economically. For the SAPs at logarithmic phase, the content of hydrophilic fractions with smaller MW was the main components, and thus adsorption by activated carbon or some novel resin [14] could be an effective method.
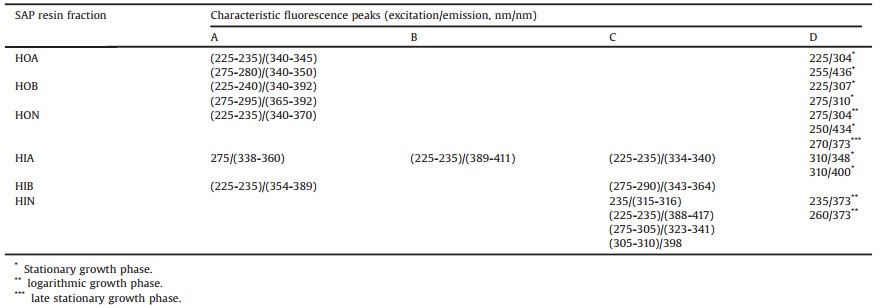
Besides the MW distribution, the EEM fluorescence spectrum was also used to characterize different resin fractions of the SAPs released by Scenedesmus sp. LX1. The detailed EEM fluorescence spectra of each resin fraction at different growth phase are shown in Figs. S1-3 (Supporting information), and the information of the characteristic fluorescence peaks (excitation wavelength/emission wavelength, EX/EM) in the EEM fluorescence spectra of these resin fractions is summarized in Table 1. According to the occurrence time and duration, these fluorescence peaks (EX/EM) were divided into four categories: A, existed in the whole growth process; B, existed in logarithmic growth phase and stationary growth phase; C, existed in stationary growth phase and late stationary growth phase; D, existed only in one of the three growth phases.
|
|
Table 1 The characteristic fluorescence peaks in the EEM fluorescence spectra of resin fractions of the SAPs at different growth phase. |
Integrating the information provided by the fingerprint graphs and that by the EEM spectra, more detailed composition properties of SAPs can be revealed. At logarithmic growth phase, the main sub-fraction of SAPs was matters with MW of 102-103 Da in HIN. The corresponding fluorescence peaks in HIN were EX 235/EM 373 and EX 260/EM 373 (nm/nm). According to the study of Chen et al. 15], these two peaks represented tryptophan-like amino acids/ proteins and aromatic proteins, respectively. Since most proteins have a MW more than 103 Da, it seems the main components in the SAPs was tryptophan-like amino acids at logarithmic growth phase.
At stationary growth phase, the main sub-fraction of SAPs was matters with MW of 103-104 Da in HON. The corresponding fluorescence peaks were EX 225–235/EM 340–370 (nm/nm) and EX 250/EM 434 (nm/nm) at stationary growth phase, representing tryptophan-like amino acids/proteins and fulvic acid-like humic acids, respectively 15]. The results of EEM spectra were in accordance with the MW distribution.
At late stationary growth phase, the main sub-fraction of SAPs was matters with MW of 103-104 Da in HOA and HON. In HOA, the corresponding fluorescence peaks were EX 225–235/EM 340–345 (nm/nm) and EX 275–280/EM 340–350 (nm/nm), representing tryptophan-like amino acids/proteins and aromatic proteins, respectively [15]. In HON, the corresponding fluorescence peaks were EX 225–235/EM 340–370 (nm/nm) and EX 270/EM 373 (nm/ nm), representing fulvic acid-like humic acids and aromatic proteins, respectively [15]. The results of EEM spectra along with the MW distribution indicated that at late stationary phase the main components of SAPs were tryptophan-like proteins, aromatic proteins and fulvic acid-like humic acids.
As analyzed above, the main components of SAPs released by Scenedesmus sp. LX1 became more and more complicated during growth: Tryptophan-like amino acids were the only main components at logarithmic growth phase; at stationary growth phase, fulvic acid-like humic acids became the main components as well; and at late stationary growth phase, aromatic proteins also became one of the main components.
In conclusion, a fingerprint analysis method and the EEM fluorescence spectra were used to characterize the SAPs released by Scenedesmus sp. LX1. At three different growth phases, the main sub-fractions of the SAPs were as follow: at logarithmic growth phase, matters with MW of 102-103 Da in HIN (mainly tryptophan-like amino acids); at stationary growth phase, matters with MW of 103-104 Da in HON (mainly tryptophan-like amino acids/proteins and fulvic acid-like humic acids); and at late stationary growth phase, matters with MW of 103-104 Da in HOA and HON (mainly tryptophan-like amino acids/proteins, fulvic acid-like humic acids and aromatic proteins).
AcknowledgmentThis study was supported by Key Program of the National Natural Science Foundation of China (No. 51738005).
Appendix A. Supplementary dataSupplementary material related to this article can befound, in the online version, at doi:https://doi.org/10.1016/j.cclet.2019.02.034.
| [1] |
H.C. Greenwell, L.M.L. Laurens, R.J. Shields, R.W. Lovitt, K.J. Flynn, J.R. Soc. Interface 46 (2009) 703-726. |
| [2] |
S.R. Medipally, F.M. Yusoff, S. Banerjee, M. Shariff, BioMed. Res. Int. 2015 (2015) 1-13. |
| [3] |
J. Yang, M. Xu, X.Z. Zhang, et al., Bioresour. Technol. 102 (2011) 6633. DOI:10.1016/j.biortech.2011.03.029 |
| [4] |
B. Biddanda, R. Benner, Limnol. Oceanogr. 42 (1997) 506-518. DOI:10.4319/lo.1997.42.3.0506 |
| [5] |
Y. Yu, H.Y. Hu, X. Li, et al., Bioresour. Technol. 110 (2012) 184-189. DOI:10.1016/j.biortech.2011.11.023 |
| [6] |
Y. Yu, Y.H. Wu, S.F. Zhu, H.Y. Hu, Bioresour. Technol. 180 (2015) 352-355. DOI:10.1016/j.biortech.2014.12.065 |
| [7] |
T.Y. Zhang, Y. Yu, Y.H. Wu, H.Y. Hu, Bioresour. Technol. 146 (2013) 643-648. DOI:10.1016/j.biortech.2013.07.142 |
| [8] |
J.G. Liu, C.W. Zhang, C. Zvi, R. Amos, Chin. J. Oceanol. Limn. 20 (2002) 248-255. DOI:10.1007/BF02848854 |
| [9] |
J.A. Leenheer, Environ. Sci. Technol. 15 (1981) 578-587. DOI:10.1021/es00087a010 |
| [10] |
R.K. Henderson, A. Baker, S.A. Parsons, B. Jefferson, Water Res. 42 (2008) 3435-3445. DOI:10.1016/j.watres.2007.10.032 |
| [11] |
L. Li, N. Gao, Y. Deng, J. Yao, K. Zhang, Water Res. 46 (2012) 1233-1240. DOI:10.1016/j.watres.2011.12.026 |
| [12] |
X. Tang, Q.Y. Wu, X. Zhao, et al., Environ. Sci. Pollut. Res. 21 (2014) 14211-14218. DOI:10.1007/s11356-014-3336-3 |
| [13] |
X. Li, H.Y. Hu, J. Yang, New Biotechnol. 27 (2010) 59-63. DOI:10.1016/j.nbt.2009.11.006 |
| [14] |
M.Q. Wang, Q. Zhou, M.C. Zhang, et al., Chin. Chem. Lett. 24 (2013) 601-604. DOI:10.1016/j.cclet.2013.04.021 |
| [15] |
W. Chen, P. Westerhoff, J.A. Leenheer, K. Booksh, Environ. Sci. Technol. 37 (2003) 5701-5710. DOI:10.1021/es034354c |