 2019, Vol. 30


Ambient polarity and viscosity are two important parameters that influence many chemical and biological processes of biomolecules [1-3]. In biological systems especially at the cellar level, polarity affects the interaction of many proteins and enzymes as well as the cell membrane permeability [4, 5]. Microenvironmental viscosity has a marked impact on some physiological processes such as cellular material transportation, interactions between biological macromolecules, diffusion of reactive substances [6, 7]. Abnormal changes in polarity and/or viscosity have been considered as vital causes or indicators for some diseases and malfunctions such as diabetes and Alzheimer's disease [8-10]. Detection of microenvironmental polarity and/or viscosity has caused much interest in many scientific areas [11, 12].
Mitochondria are important organelles of energy production as well as major sites of aerobic respiration in eukaryotes [13, 14]. They are also involved in lots of significant processes including protein translocation, the synthesis of ATP, the transportation of metabolites, etc. The mitochondrial functions are closely linked with physical chemical properties of mitochondria, namely polarity, viscosity, pH and temperature. Therefore, monitoring the changes in mitochondrial polarity and/or viscosity is fruitful for understanding some important physiological processes. However, conventional viscometers and polarity detectors are not suitable for the measurements at the cellar level. It is highly desired to develop new techniques for fast quantifying cellar polarity and viscosity.
Fluorescence-based techniques have been widely applied in many scientific researches due to the merits of good accuracy, extremely high sensitivity, temporal and spatial resolution and especially bioimaging in living cells [15-17]. Numerous polaritysensitive sensors have been developed for detection of cellar polarity based on intramolecular charge transfer (ICT) mechanism [18-20]. For viscosity tests, "molecular rotors" have been proved to be promising probes for their excellent photophysical properties of ratiometric fluorescence and/or fluorescence lifetime imaging [17, 21, 22]. Nevertheless, probe possesses features of both ICT and molecular rotor and could monitor polarity and viscosity simultaneously has rarely been reported [23].
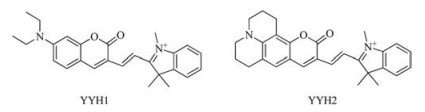
Coumarin is a well-known polarity-sensitive fluorophore [24-28], and many coumarin-based probes have been constructed for polarity [25-28]. Normally, the structural characteristic of a molecular rotor is that a steric group covalently linked to a planar fluorophore with a single/double bond as the connecting rotation shaft [29-32]. In view of the above points, we envisioned that if a steric group linked to a polarity-sensitive fluorophore, it may detect polarity and viscosity simultaneously. Herein, two compounds YYH1 and YYH2 (Scheme 1) with coumarin as the fluorophore and N-methyl indole as the steric group were selected to quantify microenvironmental polarity and viscosity. Compared to those with similar fluorophore reported in the references, our probes were more sensitive to polarity and/or viscosity and have longer emission wavelengths (λem = 685 nm for YYH2). Furthermore, the cationic characteristics of both compounds endow them locating in mitochondria in living cells.

|
Download:
|
| Scheme 1. Chemical structures of the probes. | |
With compounds YYH1 and YYH2 (NMR and mass spectra are shown in Figs. S1 and S2 in Supporting information) in hand [33-36], we first investigated their photophysical properties in phosphate buffered solution (PBS). Fig. S3 (Supporting information) demonstrates that both compounds have one absorption and two emission peaks in PBS. The emission peaks of shorter wavelengths could be ascribed to the part without indole moiety. The red emission bands are resulted from the whole π-conjugation system, which are sensitive to the solvent viscosity. The emission (681 nm) and absorption (597 nm) maxima of YYH2 are at the red wavelength region and about 30 nm longer than those of YYH1, which enables the probe to be potentially applied in biological systems.
Considering the strong ICT characteristic from the aminocoumarin unit to the indole part, the solvent-dependent spectral properties were studied. Both compounds display solvatochromic absorption and emission spectra (Figs. S4 and S5 in Supporting information). The absorption maximum of YYH1 shifted from 628 nm in toluene to 565 nm in PBS, while the green emission moved from 462 nm to 478 nm in the same series of solvents. However, the red emission showed little change upon polarity variation (Fig. S6 in Supporting information). Good relationship between absorption/emission wavenumber and the solvent polarity parameters (ET) verifies the ICT characteristic of the green emission (Fig. S6). The polarities of cationic compounds YYH1 and YYH2 are greater in ground state than in excited state, therefore, the absorption wavelength decreased with increasing polarity. Nevertheless, the green emission wavelength increased with increasing polarity, suggesting that the indole cation section was not involved in the green emission.
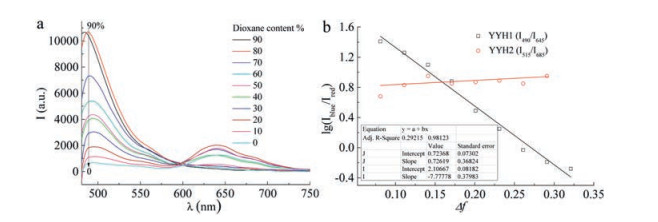
In 1, 4-dioxane-water binary mixture, with increasing water content, the absorption peak shifted from 613 nm to 565 nm and 647 nm to 597 nm for YYH1 and YYH2, respectively (Figs. S7 and S8 in Supporting information). The emission wavelength of YYH1 shifted from 468 nm to 478 nm without obvious intensity change when the proportion of the polar solvent water increased from 10% to 20% (Fig. 1a). Further increasing water content resulted in significant decrease in fluorescence intensity of the green emission with no appreciable wavelength change, whereas the emission at 645 nm increased steadily, with an isoemission point at 598 nm (Fig. 1a). More than 150 nm wavelength difference between the two bands provides a ratiometric response. The ratio I490/I645 decreased dramatically from 27 to 0.5 with increasing water content from 20% to 100% suggesting that YYH1 could be a potential ratiometric fluorescent probe for microenvironmental polarity. In the case of YYH2, when water content changed from 0 to 40%, both the blue (515 nm) and red (685 nm) emissions increased; while they both decreased with further increment of water content (Figs. S8b and c). The fluorescence intensity ratio I515/I685 hardly changed with water content revealing that YYH2 is insensitive to polarity (Fig. 1b).

|
Download:
|
| Fig. 1. (a) The emission spectra of YYH1 in water/dioxane mixed solvents (the percentage in the box indicates the dioxane content (v/v)). (b) Linearity ratios Iblue/Ired of YYH1 (λex = 450 nm) and YYH2 (λex = 470 nm) versus the polarity parameter Δf. | |
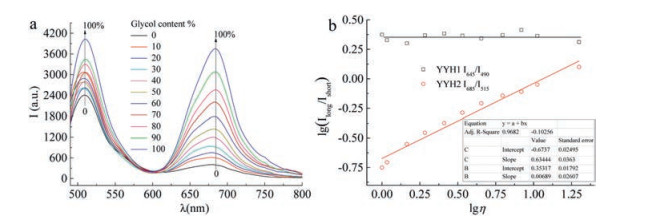
Then the spectral responses of YYH1 and YYH2 toward arbitrary changes in the viscosity were tested to understand the viscosity effect. The experimental results illustrate that YYH1 and YYH2 respond to the viscosity in different ways. In glycol-water mixed system, the absorbance at 595 nm of YYH2 increased slightly accompanied with about 12 nm red-shift with increasing glycol content, which could be probably attributed to the slight decrease of the polarity (Fig. S9 in Supporting information). As shown in Fig. 2a, the red emission of YYH2 is more sensitive to solvent viscosity than the green one: with increasing solvent viscosity from 1.0 (water) to 19.9 cp (glycol), about 10-fold and 1.7-fold fluorescence enhancements respectively for the red and green emissions were observed. The enhancement in the green emission was possibly attributed to the variation in solution's polarity. Good linear relationship between log(I685/I515) and logη of the solvent reveals that YYH2 could be applied in ratiometric detection of the media viscosity. The quantitative relationship between the ratio of I685/I515 and the solvent viscosity η is well expressed by FörsterHoffmann equation: log(I685/I515) = C + xlogη (C = -0.673, x = 0.634, R2 = 0.968), where C is a concentration and temperature-dependent constant and x is a dye-dependent constant. In addition, the fluorescence life time of YYH2 also became slightly longer with increasing solution viscosity (Fig. S10 in Supporting information): It was 0.3, 0.47 and 1.46 ns in water, 1:1 water-glycol and glycol, respectively.

|
Download:
|
| Fig. 2. (a) The emission spectr aof YYH2 in water/glycol mixed solvents(the percentage in the box indicates the glycol content(v/v)). (b) The linear responses between log(Ired/Igreen) and logη for YYH1 (λex=450 nm) and YYH2 (λex=470 nm) in water/glycol solvent. | |
As for YYH1, about 8 nm blue-shift of the absorption maximum was found with increasing water content from 0 to 100%. The fluorescence intensities at 490 nm and 645 nm increased to almost the same extent (Fig. S11 in Supporting information), and the ratio of I645/I490 hardly changed with viscosity (Fig. 2b). From the above results, it is clear that YYH1 and YYH2 could be employed to detect local polarity and viscosity, respectively.
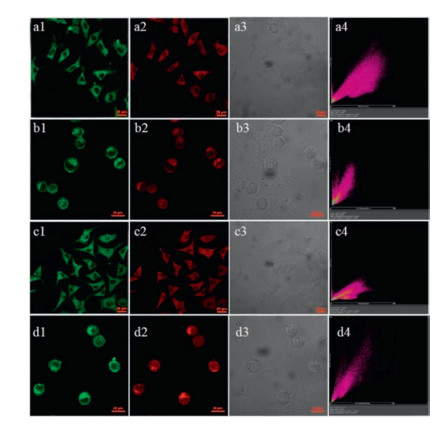
To evaluate the biological application of the probes, we tested both compounds in living cells (Fig. 3). The localization of the probes in two living cell lines, L929 and MCF-7 cells, were determined by co-staining cells with mitrochondria-specific dye. The bright red fluorescent region with YYH1 (a2, b2) and green signals from Mitro Tracker Green FM (a1, b1) overlapped perfectly (a4, b4). A high Pearson correlation factor Pf of 0.91 for L929 cells (0.94 for MCF-7 cells) indicates that YYH1 is a mitrochondriatargeted dye. Similar results were obtained in the case of YYH2 (Figs. 3c and d) (Pf are 0.93 and 0.92 for L929 and MCF-7 cells, respectively), revealing that both probes could localize at mitrochondria.

|
Download:
|
| Fig. 3. Confocal fluorescence imaging of L929 (a, c) and MCF-7 (b, d) cells stained with YYH1 (a, b) or YYH2 (c, d) and Mito Tracker Green FM (0.1 μmol/L) for 20 min. (1) Green channel (500–550 nm), (2) red channel (630–700 nm), (3) bright-field, (4) the merged of (1–3). λex=488 and 561 nm for green and red channels, respectively. [YYH1] = [YYH2]=5 μmol/L. Scale bar: 20 μm. | |
In living cells, proteins and some other biologically related substances arethemain components and involvedin every process within cells. The fluctuation of protein contents could affect cellar polarityor viscosity. Toverify the effectiveness andpracticabilityof the probes in realistic samples, the effects of some biological molecules on the spectral properties of YYH1 and YYH2 were measured.Table S1 (Supporting information) showed that both the ratio I490/I645 of YYH1 and the ratio I685/I515 of YYH2 became higher upon the addition of proteins (Figs. S12 and S13 in Supporting information), revealing that the presence of proteins increased the microenvironmental viscosity and decreased the microenvironmental polarity of the probes. Furthermore, it is obvious that the viscosity and polarity varied with proteins (Table S1 in Supporting information), which means that the difference in protein content and/or protein species could cause the change in cellar viscosity and polarity.
It is reported that probes YYH1 and YYH2 exhibited spectral responses toward sulfite [33, 35]. Other relevant species except for peroxynitrite [34] hardly influence the photophysical properties of the probes. Therefore, the presence of sulfite or peroxynitrite could interfere with bioimaging to some extent. However, it is difficult fordetection of peroxynitrite in livingcells bytraditional analytical methods due to its short half-life under typical physiological conditions. Sulfite content in living cells is relatively low because it could easily be oxidized to sulfate by sulfite oxidase. The interference from these ions could be neglected. On the other hand, the presence of sulfite resulted in the same variation tendencyof Iblue/Ired for both probes.However, thechange trendsof Iblue/Ired for YYH1 and YYH2 caused by polarity/viscosity were quite different. Therefore, interference from sulfite could be distinguished by using both probes for bioimaging.
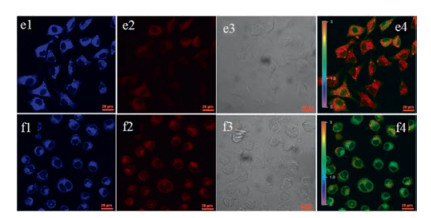
Next, YYH1 and YYH2 were employed to estimate the polarity and viscosity in living cells, respectively. After MCF-7 and L929 cells incubated with YYH1 (5 μmol/L) for 30 min, blue and red imaging were collected. Strong intracellular blue fluorescence and weak intracellular red fluorescence were observed in both cells. Considering that the ratio of I490/I645 (i.e. I645/I490 in Fig. 2b) hardly changed with solvent viscosity, the ratio of Iblue/Ired may indicate that the mitochondrial polarity in L929 cells is smaller than that in MCF-7 cells (Fig. 4).

|
Download:
|
| Fig. 4. Confocal fluorescence imaging of L929 (e) and MCF-7 (f) cells stained with YYH1 (5 μmol/L) for 20 min. (1) Blue channel (425–475 nm), (2) red channel (630–700 nm), (3) bright-field, (4) the ratio image Iblue/Ired obtained by NIS. λex=405 and 561 nm for blue and red channels, respectively. Scale bar: 20 μm. | |
After incubated with YYH2 (5 μmol/L) for 30 min, brighter intracellular green fluorescencewas observedin MCF-7 cells, while stronger intracellular red fluorescence was observed in L929 cells (Fig. 5). The ratio of Ired/Igreen suggests that the mitochondrial viscosity in L929 cells is larger than that in MCF-7 cells.

|
Download:
|
| Fig. 5. Confocal fluorescence imaging of L929 (g) and MCF-7 (h) cells stained with YYH2 (5 μmol/L) for 20 min. (1) Green channel (500–550 nm), (2) red channel (662– 737 nm), (3) bright-field, (4) the ratio image Ired/Igreen obtained by NIS. λex = 488 and 561 nm for green and red channels, respectively. Scale bar: 20 μm. | |
In summary, we have synthesized two mitochondria-targeted ratiometric fluorescent probes YYH1 and YYH2 for quantification of micropolarity and microviscosity, respectively. Both probes were constructed with environment-sensitive coumarin and Nmethyl indole linked through a C—C bridge. YYH1 responded to the polarity, while YYH2 responded to the viscosity sensitively. Therefore, they were used for ratiometric fluorescent detection of the mitochondrial polarity and viscosity respectively. This work may provide some ideas for design of polarity and/or viscosity fluorescent probes for bioimaging living cells.
AcknowledgmentThe authors acknowledge the National Natural Science Foundation of China (No. 21576085) for financial support.
Appendix A. Supplementary dataSupplementary material related to this article can be found, in the online version, at doi:https://doi.org/10.1016/j.cclet.2018.12.031.
| [1] |
K. Luby-Phelps, Int. Rev. Cytol. 192 (1999) 189-221. DOI:10.1016/S0074-7696(08)60527-6 |
| [2] |
A.H. Elcock, Curr. Opin. Struct. Biol. 20 (2010) 196-206. DOI:10.1016/j.sbi.2010.01.008 |
| [3] |
H.P. Kao, J.R. Abney, A.S. Verkman, J. Cell Biol. 120 (1993) 174-184. |
| [4] |
M. Simons, M. Mlodzik, Annu. Rev. Genet. 42 (2008) 517-540. DOI:10.1146/annurev.genet.42.110807.091432 |
| [5] |
D.G. Drubin, W.J. Nelson, Cell 84 (1996) 335-344. DOI:10.1016/S0092-8674(00)81278-7 |
| [6] |
M.J. Stutts, C.M. Canessa, J.C. Olsen, et al., Science 269 (1995) 847-850. DOI:10.1126/science.7543698 |
| [7] |
P.M. Moriarty, C.A. Gibson, Cardiovasc. Rev. Rep. 24 (2003) 321-325. |
| [8] |
M.K. Kuimova, S.W. Botchway, A.W. Parker, et al., Nat. Chem. 1 (2009) 69-73. DOI:10.1038/nchem.120 |
| [9] |
G. Deliconstantinos, V. Villiotou, J.C. Stavrides, Biochem. Pharmacol. 49 (1995) 1589-1600. DOI:10.1016/0006-2952(95)00094-G |
| [10] |
M.W. Berns, T. Krasieva, C.H. Sun, A. Dvornikov, P.M. Rentzepis, J. Photochem. Photobiol. B 75 (2004) 51-56. DOI:10.1016/j.jphotobiol.2004.05.002 |
| [11] |
L. Huang, Tam-Chang S.W., J. Fluor. 21 (2011) 213-222. DOI:10.1007/s10895-010-0708-z |
| [12] |
Z. Yang, J. Cao, Y. He, et al., Chem. Soc. Rev. 43 (2014) 4563-4601. DOI:10.1039/C4CS00051J |
| [13] |
P.H. Reddy, M.F. Beal, Brain Res. Rev. 49 (2005) 618-632. DOI:10.1016/j.brainresrev.2005.03.004 |
| [14] |
J. Estaquier, D. Arnoult, Cell Death Differ. 14 (2007) 1086-1094. DOI:10.1038/sj.cdd.4402107 |
| [15] |
Y. Chen, T. Wei, Z. Zhang, et al., Chin. Chem. Lett. 28 (2017) 1957-1960. DOI:10.1016/j.cclet.2017.05.010 |
| [16] |
M. Zhang, M. Wen, Y. Xiong, L. Zhang, C. Tian, Chin. Chem. Lett. 29 (2018) 1509-1512. DOI:10.1016/j.cclet.2018.04.026 |
| [17] |
Z. Yang, Y. He, J.H. Lee, et al., J. Am. Chem. Soc. 135 (2013) 9181-9185. DOI:10.1021/ja403851p |
| [18] |
N. Jiang, J. Fan, F. Xu, et al., Angew. Chem. Int. Ed. 54 (2015) 2510-2514. DOI:10.1002/anie.201410645 |
| [19] |
H. Xiao, P. Li, W. Zhang, B. Tang, Chem. Sci. 7 (2016) 1588-1593. DOI:10.1039/C5SC04099J |
| [20] |
J. Jiang, X. Tian, C. Xu, et al., Chem. Commun. 53 (2017) 3645-3648. DOI:10.1039/C7CC00752C |
| [21] |
A. Vysniauskas, M. Qurashi, N. Gallop, et al., Chem. Sci. 6 (2015) 5773-5778. DOI:10.1039/C5SC02248G |
| [22] |
T. Liu, X. Liu, D.R. Spring, et al., Sci. Rep. 4 (2014) 5418. |
| [23] |
Z. Yang, Y. He, J.H. Lee, et al., Chem. Commun. 50 (2014) 11672-11675. DOI:10.1039/C4CC04915B |
| [24] |
G. Signore, R. Nifosi, L. Albertazzi, B. Storti, R. Bizzarri, J. Am. Chem. Soc. 132 (2010) 1276-1288. DOI:10.1021/ja9050444 |
| [25] |
Q. Sun, D. Sun, L. Song, et al., Anal. Chem. 88 (2016) 3400-3405. DOI:10.1021/acs.analchem.6b00178 |
| [26] |
Q. Sun, J. Qian, H. Tian, L. Duan, W. Zhang, Chem. Commun. 50 (2014) 8518-8521. DOI:10.1039/C4CC03315A |
| [27] |
H. Bai, J. Qian, H. Tian, et al., Dyes Pigments 103 (2014) 1-8. DOI:10.1016/j.dyepig.2013.11.018 |
| [28] |
Q. Sun, W. Wang, Z. Chen, et al., Chem. Commun. 53 (2017) 6432-6435. DOI:10.1039/C7CC03587J |
| [29] |
L. Wang, Y. Xiao, W. Tian, L. Deng, J. Am. Chem. Soc. 135 (2013) 2903-2906. DOI:10.1021/ja311688g |
| [30] |
F. Liu, T. Wu, J. Cao, et al., Chem.-Eur. J. 19 (2012) 1548-1553. |
| [31] |
M.K. Kuimova, G. Yahioglu, J.A. Levitt, K. Suhling, J. Am. Chem. Soc. 130 (2008) 6672-6673. DOI:10.1021/ja800570d |
| [32] |
C. Rumble, K. Rich, G. He, M. Maroncelli, J. Phys. Chem. A 116 (2012) 10786-10792. |
| [33] |
W. Xu, C.L. Teoh, J. Peng, et al., Biomaterials 56 (2015) 1-9. DOI:10.1016/j.biomaterials.2015.03.038 |
| [34] |
X. Zhou, Y. Kwon, G. Kim, J.H. Ryu, J. Yoon, Biosens. Bioelectron. 64 (2015) 285-291. DOI:10.1016/j.bios.2014.08.089 |
| [35] |
Y. Yao, Q. Sun, Z. Chen, et al., Talanta 189 (2018) 429-436. |
| [36] |
E.R. Thapaliya, J. Garcia-Amoros, S. Nonell, B. Captain, F.M. Raymo, Phys. Chem. Chem. Phys. 19 (2017) 11904-11913. DOI:10.1039/C7CP01841J |