 2019, Vol. 30


Fluorescence (Förster) resonance energy transfer (FRET) is a phenomenon that an excited fluorophore (the donor, D) transfers energy to an adjacent fluorophore (the acceptor, A) through a nonradioactive process based on the long-range dipole-dipole interactions between them. It is known to depend on the spectral properties of the donor (D) and acceptor (A) fluorophores and their relative spatial arrangement, including distance and orientation [1-3].The FRET method has been widely applied in many studies such as biosensors, molecular imaging, conformational dynamics of biomolecules, and in situ detection of biomolecule interactions [4-8]. However, incomplete fluorophore labelling may cause a large source of error to the accurate FRET distance measurement, resulting in a larger calculated distance than the true value. Hence it is essential to obtain complete labelling or accurate estimation of labelling percentage [9]. Fluorescence proteins (FPs), which can be site-specifically introduced into the target proteins with complete labelling, is widely used in previous studies [10]. However, their large sizes lead to inconvenience in studying conformational dynamics of proteins, especially due to the perturbations of FPs to the target proteins or the limitation in insertion sites in target proteins. Therefore, it is important to find small FRET pairs to minimize these disadvantages. 7-Hydroxycoumarin-4-yl-ethylglycine (HC) [11-13], a fluorescent unnatural amino acid with 263 Da molecular weight, can be genetically incorporated into the target site as previous described [14-16]. This site-specific genetic incorporation, which is also used in protein-protein interaction analysis [17], can result in a complete labelling of this small fluorophore into proteins.Othersmall molecular dyes, suchasAlexa Fluor 488 C5 maleimide (Alexa488), can be covalently bound to the target protein and the labelling efficiency need to be calculated.
Recently, fluorescence lifetime measurements could be implemented using pico-second pulsed laser and photon counting detectors, which can provide both the lifetime and population information. Therefore, the lifetime based FRET between the fluorescent unnatural amino acid (as donor, D) and another fluorescent compound (as acceptor, A) are collected to calculate the percentage of the acceptor labelling, and consequently measure the distance between D-A pair, illustrating conformation changes of biomolecules. The energy transfer can be obtained by measuring the changes of donor's lifetime alone, and this measurement is not susceptible to the external disturbs such as scattering or temperature, which were considered to exerted high negative influences in the intensity based FRET.
Herein, the protein PYL10 was used for lifetime based FRET analysis. PYL10 is a member of the abscisic acid (ABA) receptor family-PYR1/PYL/RCAR (hereafter referred to as PYLs for simplicity) [18, 19]. The crystal structures of PYL10 in the apo- and ABAbound states have been determined [20-23]. Previous results showed that ABA is accommodated by a conserved, water-filled pocket, while the gate loop (CL2) region of PLY10 might be highly flexible since two groups yielded two different PYL10-CL2 conformations (very possibly trapped in different crystallization conditions) [22, 23]. Therefore, the lifetime based fluorescence analysis could be used to illustrate exact conformation changes of the PYL10-CL2 upon ABA binding.
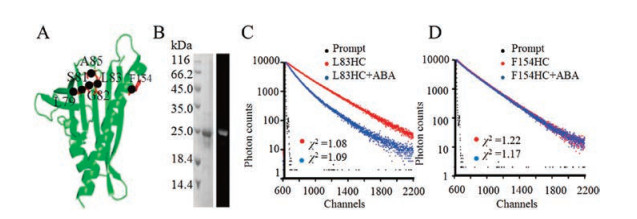
First, we genetically incorporated the fluorescent unnatural amino acid HC into six different sites (L79, S81, G82, L83, A85 in CL2 loop and F154 in α3 helix, Fig. 1A) in PYL10, respectively (detailed procedures are shown in Supporting information). The protein expression was monitored by both SDS-PAGE and fluorescence image (Fig. 1B). Then we used a time correlated single-photon counting fluorimeter (TCSPC) (DeltaFlex, Horiba Scientific) to measure the fluorescence lifetime and anisotropy with a 374 nm diode-pulsed laser and a picosecond photon detector. The detection wavelength was set at the maximum emission of the samples, 450 nm.A total of 4096 channels with the range of 27 ps per channel were used for data acquisition. The fluorescence lifetime values were calculated through a fitting of the fluorescence intensity decay using a sum of multiple exponential components (as shown in Supporting information). As for PYL10-L83HC (Fig. 1C), the fluorescence intensity decay was observed to be faster when ABA was added into the solution, indicating the HC fluorescence propertychanges upon ABA binding or the conformation changes around the site L83. On the contrary, no obvious difference was observed for PYL10-F154HC (Fig. 1D) in the absence or presence of ABA, indicating that ABA binding did not affect the local environment or polarity around this residue.

|
Download:
|
| Fig. 1. Representative protein expression and lifetime decays for PYL10 mutants in the absence or presence of ABA. (A) Ribbon representation of PYL10 (PDB number 3UQH) showing residues mutated to amber codon and incorporated with the fluorescent unnatural amino acid, HC. (B) Coomassie-stained SDS-PAGE gel (left) and the fluorescence image (right) of the purified PYL10-L83HC protein. (C) Fluorescence intensity decays of PYL10-L83HC in the absence or presence of ABA (PYL10:ABA= 1:3). (D) Fluorescence intensity decays of PYL10-F154HC in the absence or presence of ABA (PYL10:ABA= 1:3). The instrument response function is shown in black. All the decays were collected with a peak pre-set of 10, 000 counts at 25 ℃. | |
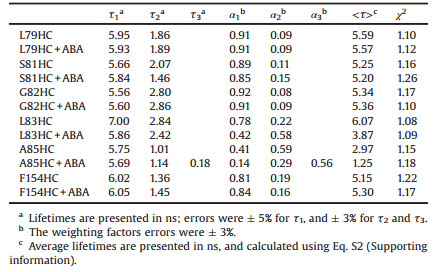
For all of the twelve PYL10 samples with HC incorporation, fluorescence lifetime components and fractional contributions were calculated (Table 1). Two components of the fluorescence lifetimes for introduced HC labels were observed for almost all samples, except three components for sample A85HC in the presence of ABA. Theoretically, fluorescence lifetimes can vary due to three reasons: (1) a ground-state heterogeneity resulting from the presence of equilibrium between different conformers, while each conformer presents a specific fluorescence lifetime; (2) internal protein motion and (3) the presence of different conformations each having different microenvironments. The multiple components of lifetimes here might also represent the high mobility and the presence of two different conformations for the side chains of investigated sites.
|
|
Table 1 Multi-exponential fluorescence lifetime analysis of PYL10 mutants in the absence or presence of ABA (PYL10:ABA=1:3). |
Minor differences were observed in the average lifetimes for each protein variant in the presence and absence of ABA, except for L83HC and A85HC. The low sensitivity of average lifetime for residues L79, S81, G82 and F154 demonstrated that the local environments around these residues were not affected upon ABA binding, thus eliminated the influence of ABA binding onto the fluorescence lifetime of HC. Therefore, the pronounced lifetime changes for L83HC (Fig. 1C) could be due to the conformation changes of the site L83 upon ABA binding.
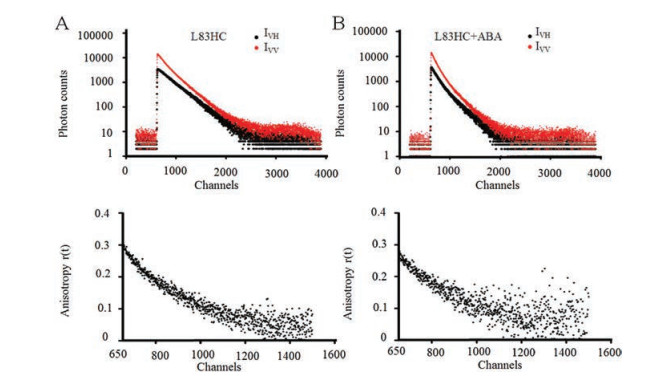
At the same time, time-resolved fluorescence anisotropy measurements were conducted as previous described [9, 24]. The oriented polarizer was set at vertical direction. The vertically (IVV(t)) and orthogonally (IVH(t)) polarized emission decays at 450 nm were collected with a 10, 000 counts at peak. The timeresolved anisotropy (r(t)) was calculated according to Eq. S3-S5 (Supporting information). In Fig. 2, PYL10-L83HC showed almost same time-dependent fluorescence anisotropy decay with or without ABA treatment, suggesting no obvious motional changes of L83 site upon ABA binding.

|
Download:
|
| Fig. 2. The fluorescence intensity decays with polarized detection (upper) and fluorescence anisotropy analysis (bottom) of PYL10-L83HC in the absence (A) or presence (B) of ABA at 25 ℃. | |
To further illustrate the conformation changes of L83 upon ABA binding, distance measurement between site L83 and L174 was conducted using lifetime based FRET method. L174 is located on the helix α3 and adopts a restricted and rigid conformation in both apo- and ABA-bound structure, making this residue ideal as a fixed reference site during distance measurement. Thus, L174 was mutated to cysteine and subsequently labelled through disulfide bond with fluorescent dye Alexa488, whose absorption spectrum overlaps well with the HC emission spectrum (Fig. S1 in Supporting information). To measure the labelling efficiency of the acceptor Alexa488, the proportion of proteins labelled with Alexa488 in total proteins were calculated. And around 14% of proteins were successfully labelled. The Förster distance R0 (in units of Å) of the FRET pair (HC/Alexa488) was calculated using the relevant spectroscopic properties of the HC and Alexa488 (see Supporting information for detail). The R0 value of HC/Alexa488 pair was calculated to be 49.25 Å.
Then, lifetime based FRET measurement was conducted for PYL10-L83HC/L174Alexa488 with or without ABA treatment. We used a 374 nm diode-pulsed laser to trigger the donor HC, and the detection wavelength was set at 450 nm As shown in Fig. 3, fluorescence intensity decays were obtained from single-fluorescent construct PYL10-L83HC and fluorescent pair PYL10-L83HC/L174Alexa488 in the absence or presence of ABA (Figs. 3B, C, E, F).

|
Download:
|
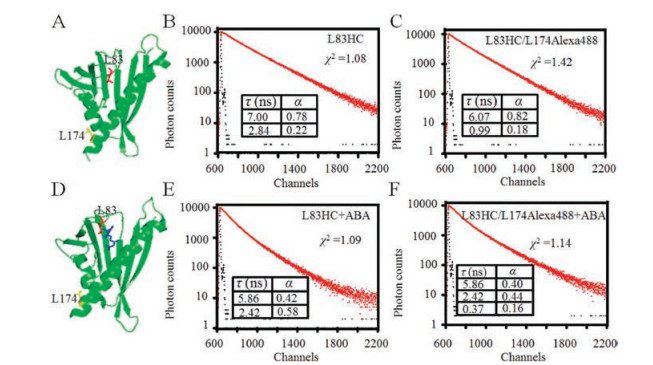
| Fig. 3. FRET distance measurements of PYL10-L83HC and L174Alex488 in the absence or presence of ABA. (A) The crystal structure of apo-state PYL10 (PDB number 3UQH). The relative locations of residues L83 (red) and L174 (yellow) are represented with sticks. (B) Fluorescence intensity decays of PYL10-L83HC in the absence of ABA. (C) Fluorescence intensity decays of PYL10-L83HC/L174Alexa488 in the absence of ABA. (D) The crystal structure of ABA-bound PYL10 (PDB number 3R6P). ABA is represented with blue sticks. (E) Fluorescence intensity decays of PYL10-L83HC in the presence of ABA (PYL10:ABA = 1:3). (F) Fluorescence intensity decays of PYL10-L83HC/L174Alexa488 in the presence of ABA (PYL10:ABA = 1:3). The instrument response function is shown in black. χ2 showed the data fitting chi-squared value. All the decays were collected at 25 ℃. | |
For PYL10-L83HC alone, two fluorescence lifetime decay components were observed, resulting in the average lifetime of 6.07 ns (τD). Fixed the value 6.07 ns as one lifetime, we fitted the lifetime decay of D/A pair (L83HC/L174Alexa488) labelled PYL10 with a two-exponential decay function. A smaller lifetime (0.99 ns) with the population of 18% appeared. This lifetime represented the relative lifetime of the donor in the presence of acceptor (τDA), and the population of 18% represented the labelling efficiency of acceptor (Alexa488) was around 18% at L174 site. Then, the values of τD and τDA were applied to calculate the energy transferred efficiency (E) and FRET distance using Eq. S10 (Supporting information). We can get a distance of 37.5 Å between L83HC and L174Alexa488 in PYL10 protein without ABA. For PYL10-L83HC in the presence of ABA, two lifetime values, 5.86 ns and 2.42 ns, were derived from the fluorescence decay. Since a good fit could not be reached for the decay of L83HC/L174Alexa488 with ABA when simply fixing the average lifetime 3.87 ns as one lifetime value. Instead, the two lifetime values of 5.86 ns and 2.42 ns were considered as inputs for further fitting, and a three exponential decay was obtained, yielding another lifetime of 0.37 ns with population of 16%. The two derived labelling efficiency values of L174Alexa488 (18% and 16%) were quite similar to calculated one (14%), indicating the reasonable reliability of this fitting method. Therefore, in the presence of ABA, the average lifetime of PYL10- L83HC (3.87 ns, τD) and the third lifetime of PYL10-L83HC/L174Alexa488 (0.37 ns, τDA) were applied to calculate the energy transferred efficiency and FRET distance. The distance of 33.9 Å between L83HC and L174Alexa488 in the PYL10 protein was obtained with ABA binding, which is shorter than the FRET distance of the D/A pair (37.5 Å) for PYL10 protein without the presence of ABA.
In previous studies, two different conformations of PYL10 without ABA were reported, a closed CL2 conformation was observed in our laboratory [22] while an open CL2 conformation was observed in Yan's group [23]. In our structures, the Cβ-Cβ distances between L83 and L174 were measured to be 26.2 Å without ABA and 26.5 Å with ABA from the crystal structures. In Yan's study, the Cβ-Cβ distance between L83 and L174 was 31.5 Å without ABA, demonstrating decreased L83/L174 distance upon ABA binding. In this study, the lifetime based FRET distance between L83HC and L174Alexa488 was calculated to be 37.5 Å (without ABA) and 33.9 Å (with ABA) respectively. Since the value derived from FRET was the distance between two fluorophores, it is reasonable that the absolute values could not be quite the same as corresponding Cβ-Cβ distances from crystal structures. Interestingly, the distance between L83HC and L174Alexa488 calculated using FRET was smaller in ABA-bound state than in apo-state PYL10. This strongly indicated that ABA binding did introduce conformation changes in the CL2 region in solution.
In summary, to implement the accurate FRET distance measurements between donor and acceptor fluorophores, the complete fluorescence donor labelling was achieved through incorporation of unnatural amino acid, while the labelling percentage of acceptor was estimated through both absorption peaks and fluorescence lifetime measurements, which could not only illustrate different protein conformations (represented by different fluorescence lifetimes), but also the percentage of the varied conformations (i.e. with or without fluorescence labelling). And the exclusive measurement of donor lifetime makes this method attractive for limited laser devices and detectors. The lifetime based FRET distance measurements were exemplified through analysing PYL10-CL2 in the absence or presence of the ligand ABA. The lifetime based FRET distance measurements revealed the different conformations of PYL10-CL2 upon ABA binding, clearing previous structural discrepancies, which was probably due to the distorted local structures in different crystallization conditions. Taken together, the fluorescence lifetime based FRET distance measurements using small FRET pairs can serve as a reliable tool for studying the dynamics of proteins, and consequent biological functions of these proteins.
AcknowledgmentsThis work was supported by National Key R&D Program of China (Nos. 2017YFA0505300, 2016YFA0400900), the Instrument Developing Project of the Chinese Academy of Sciences (No. YZ201564), and the National Natural Science Foundation of China (Nos. U1832181, 31670776, 31500611).
Appendix A. Supplementary dataSupplementary material related to this article can be found, in the online version, at doi:https://doi.org/10.1016/j.cclet.2019.01.020.
| [1] |
R.M. Clegg, Curr. Opin. Biotechnol. 6 (1995) 103-110. DOI:10.1016/0958-1669(95)80016-6 |
| [2] |
V.E. Isaac, L. Patel, T. Curran, C. Abate-Shen, Biochemistry 34 (1995) 15276-15281. DOI:10.1021/bi00046a036 |
| [3] |
L. Ma, F. Yang, J. Zheng, J. Mol. Struct. 1077 (2014) 87-100. DOI:10.1016/j.molstruc.2013.12.071 |
| [4] |
E.A. Jares-Erijman, T.M. Jovin, Nat. Biotechnol. 21 (2003) 1387-1395. DOI:10.1038/nbt896 |
| [5] |
A. Margineanu, J.J. Chan, D.J. Kelly, et al., Sci. Rep. 6 (2016) 28186. DOI:10.1038/srep28186 |
| [6] |
H.S. Chung, J.M. Louis, I.V. Gopich, J. Phys. Chem. B 120 (2016) 680-699. DOI:10.1021/acs.jpcb.5b11351 |
| [7] |
H.J. Carlson, R.E. Campbell, Curr. Opin. Biotechnol. 20 (2009) 19-27. DOI:10.1016/j.copbio.2009.01.003 |
| [8] |
S.J. Peng, R.R. Sun, W.J. Wang, C.L. Chen, Chin. Chem. Lett. 29 (2018) 1503-1508. DOI:10.1016/j.cclet.2017.12.006 |
| [9] |
C. Albrecht, R. Joseph, Lakowicz, Anal. Bioanal. Chem. 390 (2008) 1223-1224. DOI:10.1007/s00216-007-1822-x |
| [10] |
M.G. Zhang, M. Wen, Y. Xiong, L.H. Zhang, C.L. Tian, Chin. Chem. Lett. 29 (2018) 1509-1512. DOI:10.1016/j.cclet.2018.04.026 |
| [11] |
T. Koopmans, M. van Haren, L.Q. van Ufford, J.M. Beekman, N.I. Martin, Bioorg. Med. Chem. 21 (2013) 553-559. DOI:10.1016/j.bmc.2012.10.055 |
| [12] |
M. Braun, T. Dittrich, Beilstein J. Org. Chem. 6 (2010) 69. |
| [13] |
W.J. Qin, C.C. Xu, Y.F. Zhao, et al., Chin. Chem. Lett. 29 (2018) 1451-1455. DOI:10.1016/j.cclet.2018.04.007 |
| [14] |
T.S. Young, I. Ahmad, J.A. Yin, P.G. Schultz, J. Mol. Biol. 395 (2010) 361-374. DOI:10.1016/j.jmb.2009.10.030 |
| [15] |
S.M. Wang, Y.A. Zhang, L.H. Zhang, M. Zhang, C.L. Tian, Chin. Chem. Lett. 29 (2018) 1513-1516. DOI:10.1016/j.cclet.2018.08.002 |
| [16] |
S.L. Liu, P. Lv, D. Li, et al., Chem. Commun. (Camb.) 51 (2015) 15971-15974. DOI:10.1039/C5CC06124E |
| [17] |
D. Li, Y.A. Zhang, Y. He, et al., Protein Cell 9 (2018) 592. DOI:10.1007/s13238-017-0389-3 |
| [18] |
W.H. Cheng, A. Endo, L. Zhou, et al., Plant Cell 14 (2002) 2723-2743. DOI:10.1105/tpc.006494 |
| [19] |
A. Christmann, D. Moes, A. Himmelbach, et al., Plant Biol. (Stuttg.) 8 (2006) 314-325. DOI:10.1055/s-2006-924120 |
| [20] |
Y. Ma, I. Szostkiewicz, A. Korte, et al., Science 324 (2009) 1064-1068. |
| [21] |
S.Y. Park, P. Fung, N. Nishimura, et al., Science 324 (2009) 1068-1071. |
| [22] |
D. Sun, H. Wang, M. Wu, et al., Biochem. Biophys. Res. Commun. 418 (2012) 122-127. DOI:10.1016/j.bbrc.2011.12.145 |
| [23] |
Q. Hao, P. Yin, W. Li, et al., Mol. Cell 42 (2011) 662-672. DOI:10.1016/j.molcel.2011.05.011 |
| [24] |
M. Ameloot, M. vandeVen, A.U. Acuna, B. Valeur, Pure Appl. Chem. 85 (2013) 589-608. DOI:10.1351/PAC-REP-11-11-12 |