 2019, Vol. 30


b Tianjin Key Laboratory of Biosensing and Molecular Recognition, Tianjin 300071, China;
c State Key Laboratory of Medicinal Chemical Biology, Tianjin 300071, China;
d Collaborative Innovation Center of Chemical Science and Engineering, Tianjin 300071, China
Near-infrared diffuse reflectance spectroscopy (NIRDRS) has been proved to be a convenient, cost-effective and nondestructive analytical method for analyzing the samples with complex matrix [1]. For complex samples, the measured spectra contain not only the useful information, but also variant background, noise, and so on. These are known as the reason for the low detection limit of the method. Thus, chemometric methods were proposed for extracting the useful information [2-4] and eliminating the interference [5-7]. However, for most of the cases, the detection limit is still hard to meet the demand of the applications. The combination of the chemometric and experimental strategies was considered as the way to further enhance the detection ability of NIRDRS [8-10].
Enrichment of the target component from the analyzing samples is one of the commonly used strategies to improve the detection limit for the analysis of micro or trace component. Pimentel et al. developed a method for quantitative analysis of micro-aromatic hydrocarbons in water by employing a silicone sensing phase [11, 12]. Du et al. successfully detected the trace amounts of lead ion [13] and carbaryl [14, 15] in aqueous solutions via an online enrichment device. In our works, enrichment was also used to determine organic acids [16], metal ions [17, 18], phenols [19], etc. in solution samples. By these studies, enrichment was found to be an efficient way to improve the detection ability of NIRDRS. However, the spectral responses of the coexisting components and the absorption of the adsorbent (as a background) were still to be interferences to the quantitative models. Therefore, the selective adsorption was adopted for further improving the detection limit. In our work, β-cyclodextrin based adsorbent was tried to selectively adsorb bilirubin from aqueous solution via hydrophobic interaction and hydrogen bonding [8], and maleimide-functionalized silicon dioxide (SiO2) nanoparticles were prepared to enrich cysteine in aqueous solution and human serum via thiol-maleimide click reaction [20]. Furthermore, the adsorbent materials with low background absorption were also employed. For examples, quantitative detection of micro pesticides was achieved via preconcentration by [Zn2-Al-Cl] layered double hydroxides (LDH) [21], a method for quantitative determination of bull serum albumin (BSA) in micro-volume samples was achieved by depositing BSA on the filter paper [22], and silver mirror, which has very low background absorbance, was adopted to enhance the spectral feature of the analyte [9, 10].
Titanium dioxide (TiO2) has been found to be an efficient material for absorbing the biological compounds such as DNAs [23, 24]. The affinity of the phosphate group to TiO2 surface improves the specificity for the absorption [25, 26]. Due to abundance of phosphate group in DNA, the interaction of DNA and TiO2 has been studied [27, 28]. On the other hand, TiO2 was found to have a high near-infrared (NIR) solar reflectance [29, 30]. Therefore, if TiO2 is employed as an adsorbent to selectively enrich the analytes such as DNAs, a spectrum with less spectral interference and low background may be obtained.
In this work, a method utilizing TiO2 as adsorbent to quantitative determination of fsDNA in solutions by NIRDRS was studied. Forty-one samples containing fish sperm deoxyribonucleic acid (fsDNA), including 28 samples in calibration set and 13 samples in validation set, in a concentration range of 0.680- 0.795 μg/mL were used in this study. To demonstrate the selective adsorption of fsDNA on TiO2, the samples without any interference were used for building the calibration model, however, the samples with different concentrations of sodium chloride, potassium chloride, D-glucose, bovine serum albumin (BSA), tyrosine and tryptophan were used for an external validation. Quantitative determination was achieved with the help of partial least squares (PLS) regression modeling. Signal processing technique continuous wavelet transform (CWT) [31-33] and standard normal variates (SNV) [34] were used to obtain an optimized PLS model. The details of the experiment are described in the Supporting information.
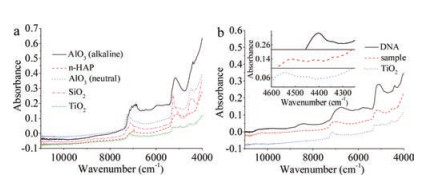
To investigate the spectral properties of TiO2, the measured spectra of four commonly used inorganic adsorbents including AlO3 (alkaline), AlO3 (neutral), n-HAP and SiO2 were compared. The spectra are shown in Fig. 1a. Clearly, the intensities of the peaks in the wavenumber region of 4000-7500 cm-1 in the spectra of n-HAP and TiO2 are lower than that of the other three adsorbents. Compared with the spectrum of n-HAP, the adsorption of TiO2 is lower in the region of 4800-5500 cm-1. Furthermore, the spectral profile of TiO2 is smooth in the entire wavenumber region. Apparently, the background absorbance of TiO2 is the lowest in all the compared adsorbents. This result indicates that TiO2 is a good adsorbent with low background adsorption for NIRDRS. To further observe the spectral properties of TiO2 before and after adsorption, the spectra of TiO2 power, fsDNA power and the sample of TiO2 adsorbed with fsDNA are shown in Fig. 1b. The inset is a magnified figure of the spectra in the range of 4600-4250 cm-1. Compared with the spectra of TiO2 power, the spectral features of fsDNA can be observed in the spectra of the sample. The peaks in the range of 5400-4700 cm-1 may be related to the overlapped absorption of amide and hydroxyl in deoxyribonucleoside [35, 36], and the peaks between 4450 cm-1 and 4300 cm-1 may be assigned as the vibration of the C–H groups in fsDNA [37, 38]. The result indicates that fsDNA is adsorbed in TiO2 powder and a comparatively pure spectrum of the analyte can be obtained to offer useful information for quantitative analysis. However, the absorption bands of bonded OH appears in all the spectra of the adsorbents and the samples around the wavenumber 5000 cm-1 and 7500 cm-1. The interference can be removed through the optimization of the models.

|
Download:
|
| Fig. 1. NIRDRS spectra of (a) adsorbent materials, (b) fsDNA powder, fsDNA adsorbed on TiO2 sample and TiO2 powder. The inset is a magnified image of the spectra in the range of 4600-4250 cm-1. | |
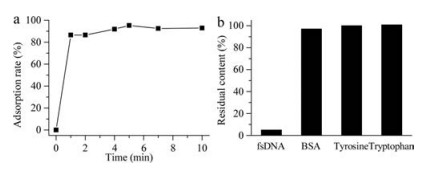
To investigate the effect of time on the adsorption, the adsorption rate of fsDNA onto TiO2 was measured. Fig. 2a shows the variation of adsorption rate at different adsorption time for the experiment using 100 mL of 0.800 μg/mL fsDNA aqueous solution and 400 mg TiO2 powder. The adsorption rate was calculated by measuring the absorbance intensity of the supernatant after the adsorption at 260 nm. Clearly, the adsorption rate can be as high as 86.5% in 1 min adsorption. The result may be due to the abundant availability of active site on TiO2 powder and the fastness of the electrostatic attraction. To ensure a high adsorption rate, 5 min was used for the adsorption. To investigate the selective adsorption of fsDNA on TiO2, interfering substances of sodium chloride, potassium chloride, D-glucose, BSA, tyrosine and tryptophan were added to the solution for simulation of biological samples. As shown in Fig. 2b, the percentages of the residual content of BSA, tyrosine and tryptophan after the adsorption are almost 100%. However, the percentage of the residual content of fsDNA is only 4.97%. The results clearly demonstrate that the presence of fivefold BSA, tyrosine and tryptophan (4.000 μg/mL) does not have any interference to the adsorption of fsDNA when fsDNA concentration is only 0.800 μg/mL. Therefore, because of the selective adsorption, the presence of interferences does not affect the accuracy of the determination.

|
Download:
|
| Fig. 2. (a) Effect of adsorption time on the adsorption rate. (b) The percentage of the residual content of fsDNA, BSA, tyrosine and tryptophan in the solution after adsorption. | |
In the calculations, 28 samples containing fsDNA in a concentration range of 0.680-0.795 μg/mL without any interference were used for building the calibration model. The wavenumber region 6000-4000 cm-1 was used to build the model, since the spectral information of fsDNA is in this region according to the spectra in Fig. 1b. To obtain an optimal PLS model, CWT and SNV were used to pre-process the spectra. CWT was used to eliminate the noise and variant background, and "sym2" wavelet and scale = 20 were employed. SNV was adopted to correct the scattering effect in the spectra. The models were evaluated by three parameters of the correlation coefficient (Rcv), root mean square error of cross validation (RMSECV) and residual predictive deviation (RPD). RPD is defined as the ratio of standard deviation (SD) to the standard error of prediction (SEP) in cross validation and used to indicate the quality of the models. Generally, a model with RPD over 5.0 is considered suitable for accurate quantitative analysis [39]. Apparently, a higher value of Rcv, a lower value of RMSECV and a bigger value of RPD indicate a better model. The parameter of correlation coefficient (R) and root mean square error of prediction (RMSEP) obtained with the validation samples were used to evaluate the practicability of the model. Besides, Monte Carlo cross validation (MCCV) combined with adjusted Wold's R criterion [40] was utilized to determine the latent variable (LV) number in the modeling. To obtain an optimized PLS model, signal processing technique CWT and SNV were used. Table 1 shows the parameters obtained with cross validation. From the values of Rcv, RMSECV and RPD in the table, it is clear that the raw spectra (no preprocessing) model is not qualified for quantitative prediction, CWT and SNV only improve the model a little, but the combination of SNV with CWT makes the model improved significantly. The RPD value is as high as 5.1 for the SNV-CWT model, indicating that the model can be used for accurate quantitative determination [39]. Therefore, SNV-CWT was adopted for the signal preprocessing in this work.
|
|
Table 1 Statistics for the calibration and validation performance of PLS models. |

To investigate the predictability of the optimized model, the spectra of the 13 samples with interferences were used for an external validation. Among the validation samples, two samples with one duplicate and three samples with two duplicates were used to investigate the repeatability of the method. The same conditions were used for the adsorption and the spectral measurements. Fig. 3 shows the relationship of the predicted values by the optimal model and reference concentrations of the analyte. The straight line is fitted by least squares regression, and the dot line is the diagonal of the plot. A good linearity is obtained, although there is a slight deviation between the two lines. It can be seen that all the predicted concentrations are reasonably distributed along the straight line. The values of R and RMSEP are 0.9727 and 6.06×10⁻³ μg/mL, respectively. The recoveries of the 13 samples are calculated and the results are in a range of 98.2%–100.7%. For the two paired samples, the differences between the two predicted values are less than 0.013 μg/mL. Moreover, relative standard deviations (RSDs), calculated from the three predicted values of the triplicate samples, are 0.96%, 0.62% and 0.14%, respectively. These results demonstrate that the repeatability of the method is acceptable, and the method is less interfered by interference substances in the system.

|
Download:
|
| Fig. 3. Scatter plot between the reference and predicted contents. | |
In conclusion, a method for determination of fsDNA was developed by using NIRDRS. TiO2 was used as an adsorbent for selective enrichment of fsDNA. Due to the low adsorption background in NIR spectra, the detection ability of NIRDRS was enhanced. With the help of SNV-CWT preprocessing techniques, an optimal PLS model was built for quantitative determination of fsDNA. The recoveries of the determination for validation samples in a concentration range of 0.685-0.755 μg/mL are from 98.2% to 100.7% with a good repeatability in spite of the presence of interfering substances. A progress in improving the sensitivity of NIRDRS was achieved. Furthermore, the method may provide an efficient way for the determination of DNAs in low concentration solutions.
AcknowledgmentsThis work is supported by the National Natural Science Foundation of China (No. 21775076), and the fundamental research funds for central universities (China).
Appendix A. Supplementary dataSupplementary data associated with this article can be found, in the online version, at https://doi.org/10.1016/j.cclet.2019.01.005.
| [1] |
C. Pasquini, Anal. Chim. Acta 1026 (2018) 8-36. DOI:10.1016/j.aca.2018.04.004 |
| [2] |
X.G. Shao, X.H. Bian, J.J. Liu, et al., Anal. Methods 2 (2010) 1662-1666. DOI:10.1039/c0ay00421a |
| [3] |
X.H. Bian, W.S. Cai, X.G. Shao, et al., Analyst 135 (2010) 2841-2847. DOI:10.1039/c0an00345j |
| [4] |
X.Y. Li, Z.H. Xu, W.S. Cai, et al., Anal. Chim. Acta 880 (2015) 26-31. DOI:10.1016/j.aca.2015.04.026 |
| [5] |
X.G. Shao, C.X. Ma, Chemometr. Intell. Lab. Syst. 69 (2003) 157-165. DOI:10.1016/j.chemolab.2003.08.001 |
| [6] |
W.S. Cai, Y.K. Li, X.G. Shao, Chemometr. Intell. Lab. Syst. 90 (2008) 188-194. DOI:10.1016/j.chemolab.2007.10.001 |
| [7] |
K.Y. Zheng, X. Zhang, P.J. Tong, et al., Chin. Chem. Lett. 26 (2015) 293-296. DOI:10.1016/j.cclet.2014.10.023 |
| [8] |
C.C. Wang, W.S. Cai, X.G. Shao, J. Near Infrared Spectrosc. 24 (2016) 345-352. DOI:10.1255/jnirs.1224 |
| [9] |
C.C. Wang, S.Y. Wang, W.S. Cai, et al., Talanta 162 (2017) 123-129. DOI:10.1016/j.talanta.2016.10.005 |
| [10] |
C.C. Wang, W.S. Cai, X.G. Shao, Anal. Lett. 51 (2018) 537-546. DOI:10.1080/00032719.2017.1337779 |
| [11] |
J.S. Albuquerque, M.F. Pimentel, V.L. Silva, et al., Anal. Chem. 77 (2005) 72-77. DOI:10.1021/ac0495788 |
| [12] |
K.M.G. Lima, I.M. Raimundo Jr., M.F. Pimentel, Sensor. Actuat. B-Chem. 125 (2007) 229-233. DOI:10.1016/j.snb.2007.02.008 |
| [13] |
Z.X. Huang, W. Tao, J.J. Fang, et al., Chemometr. Intell. Lab. Syst. 98 (2009) 195-200. DOI:10.1016/j.chemolab.2009.07.001 |
| [14] |
Y.P. Du, X.M. Wei, H.P. Xie, et al., Chin. Chem. Lett. 20 (2009) 469-472. DOI:10.1016/j.cclet.2008.11.017 |
| [15] |
X. Zhang, Y.P. Du, P.J. Tong, et al., Chemometr. Intell. Lab. Syst. 134 (2014) 58-66. DOI:10.1016/j.chemolab.2014.03.008 |
| [16] |
Y. Hao, W.S. Cai, X.G. Shao, Spectrochim. Acta Part A 72 (2009) 115-119. DOI:10.1016/j.saa.2008.08.011 |
| [17] |
Y. Ning, J.H. Li, W.S. Cai, et al., Spectrochim. Acta Part A 96 (2012) 289-294. |
| [18] |
J.H. Li, Y. Zhang, W.S. Cai, et al., Talanta 84 (2011) 679-683. DOI:10.1016/j.talanta.2011.01.072 |
| [19] |
Y. Zhang, Y. Hao, W.C. Cai, et al., Anal. Methods 3 (2011) 703-708. DOI:10.1039/c0ay00775g |
| [20] |
C.C. Wang, W.S. Cai, X.G. Shao, Chem. Res. Chin. Univ. 32 (2016) 912-916. DOI:10.1007/s40242-016-6279-z |
| [21] |
Y. Liu, Y. Ning, W.S. Cai, et al., Analyst 138 (2013) 6617-6622. DOI:10.1039/c3an01232h |
| [22] |
C.J. Cui, W.S. Cai, X.G. Shao, Chin. Chem. Lett. 24 (2013) 67-69. DOI:10.1016/j.cclet.2012.12.012 |
| [23] |
J. Hou, L.Y. Wang, C.J. Wang, et al., J. Environ. Sci. 75 (2019) 40-53. DOI:10.1016/j.jes.2018.06.010 |
| [24] |
Y. Zhang, W.L. Gao, Z.Y. Liu, et al., Chin. Chem. Lett. 27 (2016) 1091-1096. DOI:10.1016/j.cclet.2016.03.035 |
| [25] |
G.J. Zhai, X.Y. Wu, Q. Luo, et al., Talanta 125 (2014) 411-417. DOI:10.1016/j.talanta.2014.03.025 |
| [26] |
A.L. Capriotti, C. Cavaliere, F. Ferraris, et al., Talanta 178 (2018) 274-281. DOI:10.1016/j.talanta.2017.09.010 |
| [27] |
X. Zhang, F. Wang, B.W. Liu, et al., Langmuir 30 (2014) 839-845. DOI:10.1021/la404633p |
| [28] |
T. Toyooka, T. Amano, H. Suzuki, et al., Sci. Total Environ. 407 (2009) 2143-2150. DOI:10.1016/j.scitotenv.2008.12.011 |
| [29] |
A. Wong, W.A. Daoud, H.H. Liang, et al., Sol. Energy Mater. Sol. Cells 134 (2015) 425-437. DOI:10.1016/j.solmat.2014.12.011 |
| [30] |
Y.Q. Li, S.G. Mei, Y.J. Byon, et al., ACS Sustain. Chem. Eng. 2 (2014) 318-321. DOI:10.1021/sc400363b |
| [31] |
X.G. Shao, A.K.M. Leung, F.T. Chau, Acc. Chem. Res. 36 (2003) 276-283. DOI:10.1021/ar990163w |
| [32] |
X.G. Shao, C.Y. Pang, Q.D. Su, Fresenius J. Anal. Chem. 367 (2000) 525-529. DOI:10.1007/s002160000404 |
| [33] |
X.G. Shao, W.S. Cai, Rev. Anal. Chem. 17 (1998) 235-285. |
| [34] |
R.J. Barnes, M.S. Dhanoa, S.J. Lister, Appl. Spectrosc. 43 (1989) 772-777. DOI:10.1366/0003702894202201 |
| [35] |
S.E. Krikorian, Spectrochim. Acta 37 (1981) 745-751. DOI:10.1016/0584-8539(81)80075-X |
| [36] |
Q. Ding, G.W. Small, Anal. Chem. 70 (1998) 4472-4479. DOI:10.1021/ac980451q |
| [37] |
K.H. Hazen, M.A. Arnold, G.W. Small, Appl. Spectrosc. 48 (1994) 477-483. DOI:10.1366/000370294775268910 |
| [38] |
X.Y. Cui, X.W. Liu, X.M. Yu, et al., Anal. Chim. Acta 957 (2017) 47-54. DOI:10.1016/j.aca.2017.01.004 |
| [39] |
D.F. Malley, P.C. Williams, Environ. Sci. Technol. 31 (1997) 3461-3467. DOI:10.1021/es970214p |
| [40] |
S. Wold, Technometrics 20 (1978) 397-405. DOI:10.1080/00401706.1978.10489693 |