 2019, Vol. 30


b Department of Advanced Materials Science, Faculty of Engineering, Kagawa University, Takamatsu-shi 761-0396, Japan
Lithium ion batteries (LIBs) have become one of the significant energy storage devices, with the advantages of high energy density, rapid charge-discharge and good environmental compatibility [1-6]. The commercial graphite anode has been challenged due to its relatively low theoretical capacity (372 mAh/g) [7, 8], which cannot satisfy the ever-increasing requirements for the next generation LIBs. Recently, Sn-based materials have been extensively studied as the alternative anodes owing to their high theoretical capacities (SnO: 876 mAh/g, SnO2: 781 mAh/g, SnS2: 645 mAh/g), low cost and environmental friendliness [9-11]. Unfortunately, commonly reported pure Sn-based anode materials suffer from the extremely large volume change (approximate 300%), leading to capacity rapidly decay [12, 13]. Therefore, it is necessary to develop a new structurally stable Sn-based anode material.
Tin niobates have two crystal structures: the froodite SnNb2O6 and the pyrochlore Sn2Nb2O7 structures, mainly synthesized by the solid state method or the two-step hydrothermal method [14-17]. And there are few researches on tin niobates being applied as anode materials. The froodite SnNb2O6 possesses typical layered structure. Sn2+ ions are located between twooctahedron-thick layers built by edge sharing octahedral NbO6 units. This layered structure could contribute to the diffusion of lithium ions and the compensation of volume change during the charge/discharge [18]. In this work, we develop facile microwave assisted hydrothermal synthesis of SnNb2O6 and Sn2Nb2O7 nanosheets via using K8Nb6O19-10H2O and SnCl2-2H2O as precursors, and innovatively employ SnNb2O6 nanosheets as a new anode material for lithium-ion battery.
K8Nb6O19-10H2O as a precursor was synthesized through hydrothermal reaction according to previous report [19]. Then, a mixture of the K8Nb6O19-10H2O and SnCl2-2H2O in different molar ratio of Nb/Sn was dispersed in 30 mL deionized water and transferred to a 100 mL Teflonlined digestion autoclave. Subsequently, a nitrogen gas of 30 mL/min was purged for 1 h to prevent the oxidation of Sn2+ to Sn4+ during the microwave assisted hydrothermal process. Finally, the autoclave was sealed and heated in a microwave synthesizer (MDS-10) at 200 ℃ for 60 min under autogenous pressure. After being cooled down naturally, the yellow products were centrifuged, washed with DI water and ethanol, and dried at 60 ℃ in air.
X-Ray diffraction (XRD) was recorded on an X-ray diffractometer (Rigaku D/max 2200PC) with Cu Kα radiation. Transmission electron microscope (TEM) measurements were carried out using a Tecnai G2F20S-TWIN at an acceleration voltage of 200 kV. Field emission scanning electron microscope (FE-SEM) measurements were taken on Hitachi S4800. Nitrogen adsorption/desorption isotherms were measured on a Micromeritics ASAP2460 at 77 K. The specific surface area was calculated by the BrunauereEmmette-Teller equation. The pore size distribution was determined by Barrett-Joyner-Halenda model.
Electrochemical measurements were performed with coin-type half-cells (CR-2032) assembled in an argon-filled glove box (German Mbraun) with low oxygen and moisture levels (< 0.5 ppm). The working electrodes were prepared by a slurry coating procedure. The slurry was made from the tin niobates active material, acetylene black, and carboxymethylcellulose sodium (CMC) binder in H2O solvent in a weight ratio of 7:2:1. The obtained slurry was spread on a copper foil and the mass loading of electrode was controlled to be 1.0–1.3 mg/cm2, then dried at 100 ℃ for 24 h in vacuum and pressed. Lithium foil was used as the counter and reference electrode, and microporous polypropylene film (Celgard-2400) was used as the separator. The electrolyte was a 1.0 mol/L LiPF6 solution in a mixture of ethylene carbonate and dimethyl carbonate (1:1 by volume). Electrochemical measurements were all tested with cutoff potentials ranged from 0.01 V to 3.0 V (vs. Li/Li+). Using a multichannel battery testing system (Shenzhen, Neware, China), the galvanostatical charge-discharge measurements were carried out at constant current density of 0.1 A/g and the rate capabilities were evaluated at current densities of 0.1, 0.2, 0.5, 1.0 and 2.0 A/g by using the same instrument. Cyclic voltammetry (CV) measurements were performed on CHI-660E electrochemical workstation (Shanghai Chenhua, China) at a scanning rate of 0.1 mV/s. All electrochemical tests were conducted at room temperature.
Fig. 1 shows the XRD patterns of the samples obtained by microwave hydrothermal reaction at the condition of different molar ratio of Nb/Sn. It is found that when the molar ratio of Nb/Sn is 2/1, the product diffraction peaks can be exactly indexed to the pure phase SnNb2O6 (JCPDS: 84–1810). And the product is the pyrochlore structure Sn2Nb2O7 (JCPDS: 23-0593) while the molar ratio of Nb/Sn is 1/1. Additionally, XRF element analysis reveals the Nb/Sn molar ratio within of samples are 2/1 and 1/1, respectively (Fig. S1 in Supporting information), further indicating pure SnNb2O6 and Sn2Nb2O7 are successfully prepared.

|
Download:
|
| Fig. 1. XRD patterns of SnNb2O6 and Sn2Nb2O7 samples. | |
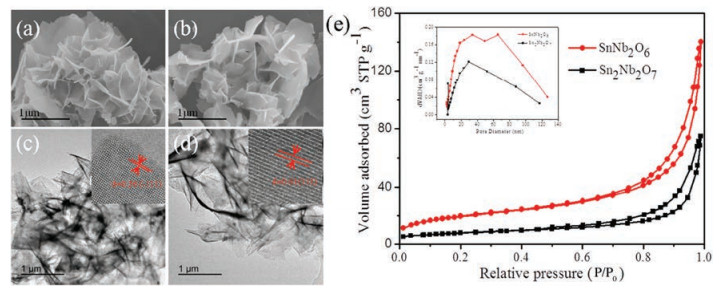
Figs. 2a and b are FE-SEM images of SnNb2O6 and Sn2Nb2O7 samples, respectively. It can be clearly seen that they are the nanosheets with the smooth surface, which are interlaced. The size of nanosheets is about 700 nm in width and 3 nm in thickness. The TEM images further confirm that the nanosheets morphology of products (Figs. 2c and d). Clearly, the distinct lattice fringes could be observed in HRTEM images (the inset in Figs. 2c and d). The fringes of d = 0.36 nm and d = 0.61 nm correspond to the (-111) plane of monoclinic SnNb2O6 and (111) plane of cubic Sn2Nb2O7. The specific surface areas of the products are further characterized by nitrogen adsorption and desorption isotherms at 77 K. As shown in Fig. 2e, typical Ⅳ isotherms with a typical H3 hysteresis loop are clearly seen on two samples, indicating the formation of mesopore. The BET surface areas of the SnNb2O6 and Sn2Nb2O7 are determined to be 68.82 m2/g and 27.27 m2/g, respectively. The pore size distribution investigated by the BJH method is shown in the inset of Fig. 2e. The average pore size of the SnNb2O6 and Sn2Nb2O7 samples are approximately 15 nm and 21 nm, respectively.

|
Download:
|
| Fig. 2. (a, b) FE-SEM images and (c, d) TEM images of SnNb2O6 and Sn2Nb2O7 samples (inset is the corresponding HRTEM images). (e) Nitrogen adsorption and desorption isotherm curves of SnNb2O6 and Sn2Nb2O7 samples. The inset is the corresponding pore size distribution calculated by BJH method. | |
Fig. 3a shows the cyclic voltammetry (CV) curves for different cycles (1st, 2nd and 3rd) of SnNb2O6 electrode at a sweep rate of 0.1 mV/s within a potential window of 0.01–3.0 V (vs. Li/Li+). It could be clearly seen that the first circle is distinguished from the other two circles. The irreversible cathodic peak at about 0.87 V can be observed during the first cathodic sweep but disappears in the subsequent cycles. It is mainly attributed to two synchronous electrochemical behaviors: the formation of the solid electrolyte interface (SEI) film and the decomposition of SnNb2O6 into metallic Sn, and the peak shifts to 1.69 V in the following cycles [20-23]. Subsequently, a small cathodic peak situated between 0.1 V and 0.5 V corresponds to the various stages of Li-Sn alloys formation [24]. The following anodic scan gives three apparent peaks at 0.57, 1.23 and 1.89 V. The strong broad peak appearing at 0.57 V is assigned to the dealloying reaction of Sn-Li alloy [25, 26]. It is interesting to find that the broad anodic peaks at 1.23 V and 1.89 V still exist during the third cycle, suggesting partial reversibility of reaction related to Li2O converting to Li+ [21, 24, 27]. The disappearance of small peak at 2.31 V after the first cycle may be assigned to the side reactions. After the first cycle, CV curves overlap well and remain stable, demonstrating the electrochemical reversibility is gradually built [28]. Moreover, the almost constant peak intensity and integral area further imply the excellent electrochemical reversibility. The CV curves of Sn2Nb2O7 electrode (Fig. S2 in Supporting information) is basically consistent with the SnNb2O6 electrode, indicating that the similar electrochemical reactions occur between the lithium ions and the electrodes during discharge/charge.

|
Download:
|
| Fig. 3. (a) CV curves of the SnNb2O6 electrode. (b) Cycling performance of the SnNb2O6 and Sn2Nb2O7 electrodes at 0.1 A/g and coulombic efficiency of the SnNb2O6 electrode. (c, d) Charge/Discharge profiles of SnNb2O6 and Sn2Nb2O7 electrodes. (e) Rate performance and (f) Nyquist plots of the SnNb2O6 and Sn2Nb2O7 electrodes. | |
The cycling behaviors of SnNb2O6 and Sn2Nb2O7 electrodes have also been compared at a current density of 0.1 A/g, as shown in Fig. 3b. A relatively high initial irreversible capacity loss could be observed, which mainly results from the formation of solid electrolyte interface (SEI) layer and other possible side reactions [29]. It can be also seen that the capacity of the SnNb2O6 electrode decreases slightly in the subsequent cycles, exhibiting a discharge/ charge capacity of 498/488 mAh/g with a 97.9% coulombic efficiency at the 100th cycle, while the capacity of the Sn2Nb2O7 electrode decays rapidly along the next cycling process. After first cycle, the Coulombic efficiencies of SnNb2O6 electrode quickly increases to above 90% and subsequent stabilizes near 99% in the following cycles, exhibiting good reversible cycling performance (Fig. S3 in Supporting information). Figs. 3c and d show the chargedischarge voltage profiles of the SnNb2O6 and Sn2Nb2O7 electrodes at 0.1 A/g. There are two potential plateaus with different slopes appear at first cycle, respectively corresponding to the formation of SEI film and reduction of tin niobates, and alloying of Sn and Li+, which is in good agreement with the result of cyclic voltammogram. The capacity retention of the SnNb2O6 and Sn2Nb2O7 electrodes is calculated based on the 10th capacity value, as shown in Fig. S4 (Supporting information). It is clear that the capacity retention of the SnNb2O6 electrode stabilizes at 92.42% after 100 cycles, demonstrating the outstanding cycling stability. Nevertheless, the Sn2Nb2O7 electrode displays obvious capacity attenuation and its capacity retention only maintains 37.92% after 100 cycles at 0.1 A/g. Moreover, compared with Sn2Nb2O7 and the previously reported pure Sn-based anode materials, the SnNb2O6 electrode manifests outstanding cycling performance (Table S1 in Supporting information).
The rate capabilities of the SnNb2O6 and Sn2Nb2O7 electrodes are further evaluated at stepwise current densities from 0.1 A/g to 2.0 A/g. As shown in Fig. 3e, the reversible capacities of SnNb2O6 electrode are 539, 501, 421, 363, and 306 mAh/g at current densities of 0.1, 0.2, 0.5, 1.0 and 2.0 A/g, respectively. More importantly, when the current density reverses back to the initial 0.1 A/g, the reversible capacity is recovered to 533 mAh/g. This result indicates that SnNb2O6 electrode is tolerant to a variable charge-discharge current, which is a desirable characteristic required for high power application. By contrast, very low reversible capacity (around 222 mAh/g) of the Sn2Nb2O7 electrode is obtained at 2.0 A/g, indicating the SnNb2O6 electrode exhibits much better rate capability compared to the Sn2Nb2O7 electrode.
Fig. 3f is the Nyquist plots of the SnNb2O6 and Sn2Nb2O7 electrodes after 50 cycles. The Nyquist plots consist of a semicircle in high to medium frequency range and an inclined line in the low frequency range. The diameter of semicircle represents the charge transfer resistance and an inclined line is related to the diffusion coefficient of lithium ions in the anode materials [30]. It is obvious that SnNb2O6 electrode has a smaller diameter of the high-frequency semicircle than Sn2Nb2O7 electrode, suggesting the lower charge transfer resistance, which well explains the much better electrochemical performances observed for SnNb2O6 electrode.
The morphology of SnNb2O6 and Sn2Nb2O7 electrodes after 100 cycles were examined by SEM. As shown in Fig. S5 (Supporting information), the SnNb2O6 electrode preserved cross-linked structure to some extent, indicating the excellent stability of the electrode. While Sn2Nb2O7 presented collapsed and agglomerated morphology, which may hinder the charge transfer and lead to more inferior cycling stability to Sn2Nb2O7 electrode.
The outstanding electrochemical performance of SnNb2O6 nanosheets as an anode material for LIBs can be attributed to the unique crystal structure. The froodite SnNb2O6 possesses a typical layered structure, which is composed of the two-octahedronthick layers built by edge sharing octahedral NbO6 units and Sn2+ ions are located between layers. The lithium ions could easily get access into the interlayer through the opened edges during the charge/discharge because the interlaminar Sn2+ ions have a larger radius than lithium ions. This unique layered structure is conducive to both the diffusion of the lithium ions and the migration of electrons during discharge/charge. However, the pyrochlore Sn2Nb2O7 consists of two weakly interacting interpenetrating sub-lattices, a cuprite-like Sn2O lattice and a Nb2O6 framework built up of the corner sharing NbO6 octahedra [31], without the layered structure. As results, SnNb2O6 shows the better electrochemical performance than Sn2Nb2O7.
In summary, SnNb2O6 and Sn2Nb2O7 nanosheets have been synthesized via microwave assisted hydrothermal method. When used as anode materials for lithium ion batteries, the SnNb2O6 nanosheets exhibits excellent cycling stability (498 mAh/g after 100 cycles at 0.1 A/g) and good rate capability (306 mAh/g at 2 A/g), which is superior to Sn2Nb2O7 nanosheets. The outstanding electrochemical performances of SnNb2O6 could be attributed to layered structure. This unique crystal structure features of SnNb2O6 makes it as a new promising Sn-based material to improve the performance of lithium-ion battery.
AcknowledgmentsThe authors acknowledgment the support of Project Supported by the Natural Science Foundation of China (Nos. 51502163 and 51502165), Keypoint Research and Invention in Shaanxi Province of China (No. 2017GY-186), the Scientific Research Foundation for the Returned Overseas Chinese Scholars, State Education Ministry.
Appendix A. Supplementary dataSupplementary material related to this article can be found, in the online version, at doi:https://doi.org/10.1016/j.cclet.2018.10.006.
| [1] |
X. Zhou, Y.X. Yin, L.J. Wan, Y.G. Guo, J. Mater. Chem. 22 (2012) 17456-17459. DOI:10.1039/c2jm32984k |
| [2] |
D. Wang, J. Yang, X. Li, et al., Energy Environ. Sci. 6 (2013) 2900-2906. DOI:10.1039/c3ee40829a |
| [3] |
M.V. Reddy, G.V. Subba Rao, B.V. Chowdari, Chem. Rev. 113 (2013) 5364-5457. DOI:10.1021/cr3001884 |
| [4] |
J. Liang, X.Y. Yu, H. Zhou, et al., Angew. Chem. Int. Ed. 53 (2014) 12803-12807. DOI:10.1002/anie.201407917 |
| [5] |
Z. Wei, L. Wang, M. Zhuo, et al., Mater. Chem. A 6 (2018) 12185-12214. DOI:10.1039/C8TA02695E |
| [6] |
G. Zeng, H. Wang, J. Guo, et al., Chin. Chem. Lett. 28 (2017) 755-758. DOI:10.1016/j.cclet.2017.01.001 |
| [7] |
R. Marom, S.F. Amalraj, N. Leifer, D. Jacob, D. Aurbach, J. Mater. Chem. 21 (2011) 9938-9954. DOI:10.1039/c0jm04225k |
| [8] |
C. Liu, F. Li, L.P. Ma, H.M. Cheng, Adv. Mater. 22 (2010) 28-62. DOI:10.1002/adma.v22:8 |
| [9] |
J. Li, Y. Zhao, N. Wang, L. Guan, Chem. Commun. 47 (2011) 5238-5240. DOI:10.1039/c1cc10542f |
| [10] |
X. Lu, G. Wu, Q. Xiong, et al., Appl. Surf. Sci. 422 (2017) 645-653. DOI:10.1016/j.apsusc.2017.06.052 |
| [11] |
W. Xu, Z. Xie, X. Cui, et al., Appl. Mater. Interfaces 7 (2015) 22533-22541. DOI:10.1021/acsami.5b06765 |
| [12] |
J. Fan, T. Wang, C. Yu, et al., Adv. Mater. 16 (2004) 1432-1436. |
| [13] |
D. Larcher, S. Beattie, M. Morcrette, et al., J. Mater. Chem. 17 (2007) 3759-3772. DOI:10.1039/b705421c |
| [14] |
Z. Zhang, D. Jiang, D. Li, M. He, M. Chen, Appl. Catal. B 183 (2016) 113-123. DOI:10.1016/j.apcatb.2015.10.022 |
| [15] |
C. Zhou, Y. Zhao, T. Bian, et al., Chem. Commun. 49 (2013) 9872-9874. DOI:10.1039/c3cc45683h |
| [16] |
D. Noureldine, D.H. Anjumb, K. Takanabe, Phys. Chem. Chem. Phys. 16 (2014) 10762-10769. DOI:10.1039/C4CP00654B |
| [17] |
N. Taira, T. Kakinuma, J. Cream. Soc. Jpn. 120 (2012) 551-553. DOI:10.2109/jcersj2.120.551 |
| [18] |
C. Park, H. Sohn, Adv. Mater. 22 (2010) 47-52. DOI:10.1002/adma.v22:1 |
| [19] |
X. Kong, D. Hu, P. Wen, et al., Dalton Trans. 42 (2013) 7699-7709. DOI:10.1039/c3dt00062a |
| [20] |
S. Chen, Y. Xin, Y. Zhou, et al., Mater. Chem. A 2 (2014) 15582-15589. DOI:10.1039/C4TA03218G |
| [21] |
X. Hu, G. Zeng, J. Chen, C. Lu, Z. Wen, Mater. Chem. A 5 (2017) 4535-4542. DOI:10.1039/C6TA10301D |
| [22] |
Q. Tian, P. Chen, Z. Zhang, L. Yang, Carbon 1 (2017) 634-641. |
| [23] |
X. Tao, Q. Tian, L. Yang, Y. Xiang, Mater. Lett. 202 (2017) 107-110. DOI:10.1016/j.matlet.2017.05.055 |
| [24] |
W. Dong, J. Xu, C. Wang, et al., Adv. Mater. 29 (2017) 1700136. DOI:10.1002/adma.201700136 |
| [25] |
J. Yao, X. Shen, B. Wang, H. Liu, G. Wang, Electrochem. Commun. 11 (2009) 1849-1852. DOI:10.1016/j.elecom.2009.07.035 |
| [26] |
C. Wang, Y. Zhou, M. Ge, et al., J. Am. Chem. Soc. 132 (2010) 46-47. DOI:10.1021/ja909321d |
| [27] |
D. Pan, N. Wan, Y. Ren, et al., ACS Appl. Mater. Interfaces 9 (2017) 9747-9755. DOI:10.1021/acsami.7b00232 |
| [28] |
C. Wang, G. Du, K. Stahl, et al., J. Phys. Chem. C 116 (2012) 4000-4011. |
| [29] |
Q. Tian, Z. Zhang, L. Yang, S. Hirano, Carbon 93 (2015) 887-895. DOI:10.1016/j.carbon.2015.06.010 |
| [30] |
J. Liang, Z. Wei, C. Wang, J. Ma. Electrochim. Acta 285 (2018) 301-308. DOI:10.1016/j.electacta.2018.07.230 |
| [31] |
D. Ismunandar, B.J. Kennedy, B.A. Hunterc, J. Alloys. Compd. 302 (2000) 94-100. DOI:10.1016/S0925-8388(00)00677-0 |