 2019, Vol. 30


b College of Materials Science and Engineering, Qingdao University of Science and Technology, Qingdao 266042, China;
c State Key Lab of Urban Water Resource and Environment, Harbin Institute of Technology, Harbin 150090, China
The advance of portable and wearable electronics requires the development of energy storage devices with high performance [1-3]. Flexible supercapacitor is one of the most attractive energy storage technologies due to the advantage of high power density, ultra-long cycle life, and environmental friendliness [4, 5]. However, the limited energy storage performance of the devices hinders the applications [6]. Since the energy density of the supercapacitor is determined by the capacitance and the working voltage (E = CV2/2), increasing either of the parameters can improve the energy storage efficiency [7, 8]. Developing asymmetric pseudocapacitor is an effective strategy to enhance the energy density by maximizing the working voltage from the asymmetric structure of the device and increasing the capacitance from pseudocapacitive electrodes [9-11]. Therefore, designing the proper high-performance cathodes and anodes is the key step to realize the potential of the flexible asymmetric pseudocapacitors (FAPCs).
Great efforts have been devoted to the search of optimized cathodes and anodes. For the cathodes, many electrochemically active metal oxide, such as Co3O4 [12], NiO [13], TiO2 [14], NiCo2O4 [15], and V2O5 [16], and polymers such as polyaniline [17], polypyrrole [18], have been developed and showed promising performance. For the anodes, metal oxide based electrodes like MoO3-x [19], VN [20], Bi2O3 [21] have shown great potential for asymmetric supercapacitor. Among these electrodes, manganese oxide (MnO2) and iron oxide (Fe2O3) are two promising candidates for cathode and anode, respectively, thanks to their high theoretical specific capacitance, proper working potential windows, low cost, and environmental friendliness [22, 23]. Unfortunately, their practical applications were hindered by their low electric conductivity [13, 24]. Combining these materials with electrically conductive materials to prepare the composites is one of the most effective strategies to solve this issue. Many groups have used this strategy in MnO2 and Fe2O3 with different substrates and demonstrated good electrochemical performance of these composites [25-27]. However, the performance especially on energy density and flexibility are both needed to be further improved.
In this work, free-standing electrodes composed of uniform Fe2O3 nanowires or MnO2 nanosheets are grown on flexible carbon fabrics through facile hydrothermal reaction and directly used as anode and cathode of all-solid state FAPC, respectively. In these electrodes, the electrically conductive carbon fabric (CF) is used as substrate to load pseudocapacitive electrode materials of MnO2 and Fe2O3. CF can improve conductivity of the electrodes and suppress the damage on electrodes from the volume variation during the long-term charge discharge process. Owing to synthesis process optimization and the perfect matching of cathode and anode, a high working voltage of 1.8 V is realized and the asymmetric device exhibits a high area capacitance of 83.3 mF/cm2 (or 119 F/g) at current density of 1 mA/cm2, a compelling energy density of 53.55 Wh/kg with a power density of 43.95 kW/kg. Meanwhile, the device delivers good cycling performance up to 5000 cycles and superior flexibility, establishing it as a promising candidate for portable and wearable flexible energy device.
MnO2 nanosheets on CF (MnO2-CF) was prepared via a hydrothermal method [28]. Commercial CF was first ultrasonically cleaned with 0.1 mol/L H2SO4 solution for 20 min, followed by washing with deionized water (DI water). 1 mmol KMnO4 was dissolved in 20 mL DI water by stirring until a homogeneous solution was formed. The homogeneous solution and the treated CF (2 cm × 2 cm) were transferred into a 50 mL stainless-steel Teflon-lined autoclave and kept at 100 ℃ for certain time. When cooled down naturally to ambient temperature, CF was taken out and ultrasonically cleaned in DI water twice and dried in a vacuum oven at 60 ℃ overnight. The prepared samples were labeled as MnO2-CF-X, where X represented the reaction time in min. The loading masses of MnO2 on MnO2-CF-X were around 0.15, 0.25, 0.33 and 0.42 mg/cm2 for MnO2-CF-20, MnO2-CF-40, MnO2-CF-60 and, MnO2-CF-80, respectively.
Fe2O3 nanowires on CF (Fe2O3-CF) was prepared via solvothermal process [27, 29]. CF was cleaned in an ultrasonic bath with 1 mol/L HNO3 solution for 0.5 h and then in DI water for 10 min. 6 mmol FeCl3·6H2O and 7.5 mmol Na2SO4 were added into 20 mL DI water under magnetic stirring to form the homogeneously solution. The solution and the prepared CF (2 cm × 2 cm) were both put into a 50 mL stainless Teflon-lined autoclave, and kept at 60 ℃ overnight after sealed. After cooled down naturally to room temperature, CF was taken out and ultrasonically cleaned for 10 min in DI water, followed by drying at 60 ℃ overnight. At last, the sample was annealed at 400 ℃ for 120 min with a slow ramping rate of 1 ℃/min under nitrogen atmosphere to obtain Fe2O3-CF. The prepared samples were labeled as Fe2O3-CF-Y, where Y represented the reagent concentration in mmol. The loading mass of Fe2O3 on Fe2O3-CF-Y was about 0.18, 0.31 and 0.46 mg/cm2 for Fe2O3-CF-3, Fe2O3-CF-6 and, Fe2O3-CF-12, respectively.
Field-emission scanning electron microscopy (FE-SEM, Hitachi SU8030), and scanning/transmission electron microscopy (S/TEM, Hitachi HD2300, JEOL J2100, Hitachi 8100) were employed to investigate the morphologies and microstructures of the materials. The chemical compositions were confirmed by X-ray photoelectron spectroscopy (XPS, ESCALAB 250Xi). The phase purity and crystallographic information the samples were investigated by Xray diffraction (XRD, SCINTAC INC, 2000) at a voltage of 40 kV.
All the electrochemical tests were conducted on a ChenHua electrochemical workstation (CHI 660E, Shanghai). All single electrode measurements were performed in a three-electrode configuration. The reference and counter electrode were Ag/AgCl and platinum wire, respectively. 1 mol/L Na2SO4 solution was used as electrolyte. To fabricate the pseudocapacitor device, the optimized MnO2-CF electrode and Fe2O3-CF electrode were directly selected as the positive electrode and negative electrode. The PVA-LiCl gel was acted as the separator and solid electrolyte between the two electrodes in the FAPCs, which was synthesized as follows [28]: 6 g PVA and 3 g LiCl powder were dispersed in 60 mL DI water under stirring at 90 ℃ until the solution became clear. Then the PVA-LiCl electrolyte was smeared on the positive and negative electrodes following by drying at 50 ℃ for 10 min. FAPC was finally fabricated by stacking up the two electrodes like a sandwich and dried at ambient temperature. Galvanostatic discharge/charge (GDC), cyclic voltammetry (CV) and electrochemical impedance spectroscopy (EIS, at open circuit voltage with 5 mV signal) were conducted to evaluate the performance of the device. To calculate the specific capacitance (Csc, F/g), power density (P, kW/kg) and energy density (E, Wh/kg), the following equations were used based on GDC curves.
In the three-electrode system:

|
(1) |
where Ca and Cs are the area capacitance and specific capacitance of the single electrodes, I is the applied current, m and s are mass and effective area of the active material of the single electrode, Δt is the discharging time, ΔV is the discharge voltage.
In FASCs:

|
(2) |

|
(3) |

|
(4) |
where Cta and Cts are the area capacitance and specific capacitance of the FASCs, I is the applied current, S is effective area of the device, Δt is the discharging time, the mass of total active materials in two electrodes is represented by M, and ΔV stands for the working voltage obtained from the curve of discharge excluding the voltage drop.
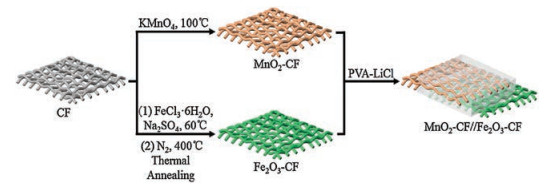
The synthesis of cathode MnO2-CF and anode Fe2O3-CF and the device assembly into FAPCs are shown in Fig. 1. Hydrothermal reaction method is used to prepare MnO2 on CF forming MnO2-CFX. A two-step method combining the solvothermal reaction and thermal annealing at N2 is developed to prepare Fe2O3-CF-Y, FAPCs are assembled by sandwiching cathode MnO2-CF-X and anode Fe2O3-CF-Y in PVA-LiCl, which plays both roles of gel electrolyte and separator for device.

|
Download:
|
| Fig. 1. Schematic illustration of the preparation of FAPCs based on MnO2-CF//Fe2O3-CF. | |
The cathode MnO2-CF-X is first studied. Figs. 2a and b show SEM images of MnO2-CF-60 at different magnifications. CF is uniformly covered by MnO2 nanosheets forming an interconnected porous network. Fig. S1 (Supporting information) shows similar structures of MnO2-CF-X at different reaction times. The structure of MnO2-CF-60 is further characterized by TEM (Fig. 2c). The distinct lattice spacings of 0.22 nm, 0.23 nm, 0.31 nm, are corresponding to the (420), (121), (310) planes of MnO2, respectively.

|
Download:
|
| Fig. 2. (a, b) SEM images of MnO2-CF-60 (inset is the carbon fabric). (c) HRTEM and TEM images (inset) of the MnO2 nanosheets in MnO2-CF-60. (d) XRD pattern of MnO2-CF- 60. (e) XPS spectra of Mn 2p of MnO2-CF-60. (f) XPS spectra of O 1s of MnO2-CF-60. | |
For MnO2-CF-60, as shown in Fig. 2d, the most obvious peak at 25.8° results from the carbon fabric, and all the other diffraction peaks are in good consistence with tetragonal MnO2 (JCPDS card No. 72-1982). No diffraction peaks from residues or impurities are observed, indicating the high purity of the composite. The chemical composition of MnO2-CF-60 is analyzed by XPS.The survey spectrum confirms the presence of Mn, C and O elements MnO2-CF-60 (Fig. S2 in Supporting information). The strong C 1s peak should come from the CF substrate because it is the onlycarbon source in the composite and the intensity is strong enough which cannot be negligible. The high-resolution Mn 2p spectrum ranging from 635 eV to 660 eV is shown in Fig. 2e. Two peaks seated at 653.9 eV and 642.0 eV are corresponding to Mn4+ ions, suggesting Mn4+ ions are dominant on the surface of the material. In the O 1s region, two peaks locating at 531.1 eV and 529.4 eV are designated as Mn-O-H and Mn-O-Mn, respectively (Fig. 2f). In the high-resolution Mn 3s spectrum, the binding energy width between the two Mn 3s peaks can further prove the existence of Mn4+ (Fig. S3 in Supporting information). All these results indicate that MnO2 has been successfully grown on the surface of CF.
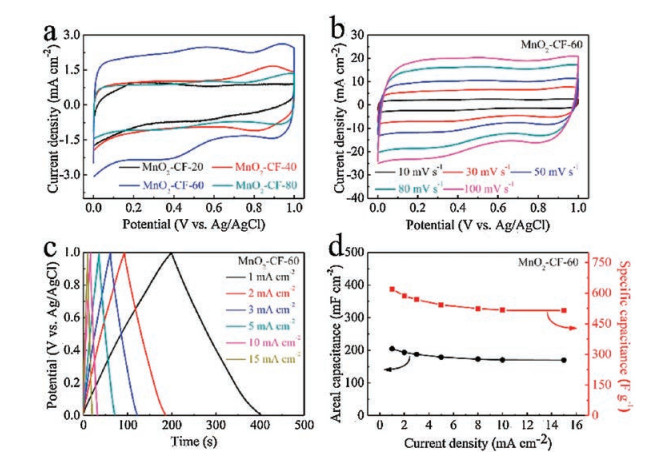
To explore the electrochemical properties of the MnO2-CF-X cathodes, CV is firstly measured using a three-electrode systemwith 1 mol/L Na2SO4 as the electrolyte. Ag/AgCl electrode and platinum wire are used as the reference electrode and the counter electrode, respectively. Fig. 3a shows the CV plot of MnO2-CF-X in potential window of 0-1 V at 10 mV/s. The nearly rectangular shapes of the curves indicate the good capacitive characterization of MnO2-CF-X. MnO2-CF-60 shows the largest integral area of CV curve, suggesting the highest pseudocapacitance among all the samples. Fig. 3b shows the CV curves of MnO2-CF-60 at different scan rates ranging from 10 mV/sto100 mV/s.The current response enhances with increasing the scan rates while the curve shapes maintain well without distortion. Fig S4 (Supporting information) shows the similar CV curves of MnO2-CF-X with different reaction time.

|
Download:
|
| Fig. 3. (a) Cyclic voltammetry (CV) curves of MnO2-CF-X at a scan rate of 10 mV/s. (b) CV curves of MnO2-CF-60 min at different scan rates. (c) Galvanostatic discharge-charge (GDC) curves of MnO2-CF-60 min at different current densities. (d) The specific capacitance and area capacitance of MnO2-CF-60 min at different current densities. | |
GDC measurements at different current densities are conducted to further evaluate the performance of the MnO2-CF-60 (Fig. 3c). The discharge time gradually decreases when the current density increases and no obvious change is observed in the triangular shape of the curves. The nearly symmetrical GDC curves without obvious IR drop reveal the good electrochemical capacitive characteristics of MnO2-CF-60 with low internal resistance [30, 31]. The corresponding specific capacitance is calculated based on GDC information and shown in Fig. 3d. At the current density of 1mA/cm2, the area capacitance of the MnO2-CF-60 is 204.6 mF/cm2 (or 620F/g at an equivalent current density of 3A/g). The specific capacitance slowly decrease as the current density increase. When the current density reaches to 15mA/cm2, the specific capacitance of MnO2-CF-60 still maintain at 169.95 mF/cm2, demonstrating a good rate performance. The high capacitance and outstanding rate capability are because of the large area and remarkable conductivity of carbon fabric, which provide more active sites for electrochemical reaction and fast charge delivery [29]. Thus, MnO2-CF-60 with potential range of 0-1V is a promising cathode candidate for high-performance FAPCs.
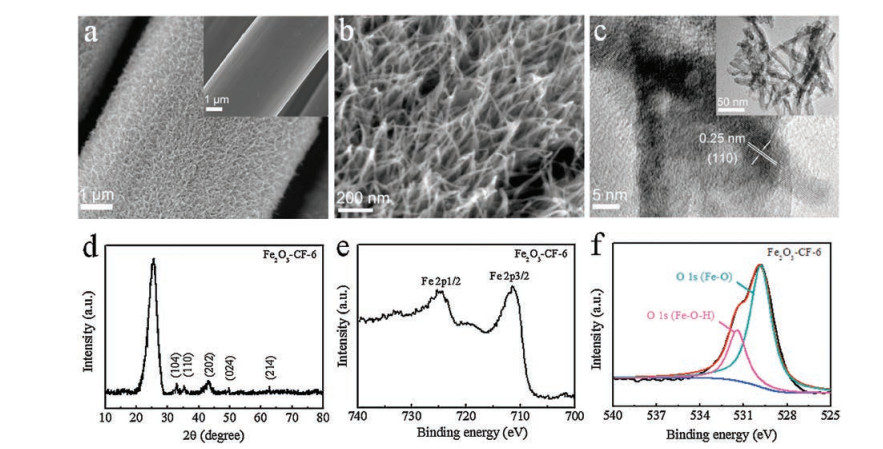
The anode Fe2O3-CF-Y is also studied in a similar way with MnO2-CF-X. Figs. 4a and b show the morphology of Fe2O3-CF-6 at different magnifications. CF is uniformly covered by Fe2O3 nanowires. Fig. 4c shows the high resolution TEM images of Fe2O3 nanowires from Fe2O3-CF-6. From the inset image, the diameter of Fe2O3 nanowires is confirmed to be ~ 10 nm. The lattice spacing of 0.25 nm is corresponding to the (110) planes of Fe2O3. Similarly, Fe2O3-CF-Y are studied by SEM and shown in Fig. S5 (Supporting information).

|
Download:
|
| Fig. 4. (a, b) SEM images of Fe2O3-CF-6. (c) HRTEM and TEM images of the Fe2O3 nanowires on Fe2O3-CF-6. (d) XRD pattern of the Fe2O3-CF-6. (e) XPS spectra of Fe 2p of Fe2O3- CF-6. (f) XPS spectra of O 1s core level of Fe2O3-CF-6. | |
Fig. 4d shows the XRD pattern of the Fe2O3-CF-6. By assigning the strong peak at 25° to the carbon fabric, all the other peaks are in good consistence with α-Fe2O3 (JCPDS No. 33-0664). XPS is measured to explore the chemical composition of the Fe2O3-CF- 6 nanostructure (Fig. S6 in Supporting information). In the Fe 2p XPS spectrum (Fig. 4e), the peaks at 711.2 eV and 724.6 eV which are assigned to Fe 2p3/2 and Fe 2p1/2 of Fe3+ and much higher than the peaks at 709 eV and 722.6 eV are ascribed to Fe2+, respectively. The satellite peak at 718.9 eV might be for Fe 2p3/2. In Fig. 4f, the O 1s spectrum ranging from 525 eV to 540 eV is deconvoluted into two main peaks centered at 529.8 eV, and 531.4 eV, designated to Fe-O and Fe-OH, respectively. These results indicate that Fe2O3 nanowires are successfully covered on CF [32, 33].
The electrochemical performance of Fe2O3-CF-Y electrodes is evaluated in the three-electrode configuration. Fig. 5a shows the CV tests of Fe2O3-CF-Yat scan rate of 10 mV/s. Fe2O3-CF-6 electrode exhibits the largest integral area in the electrochemical potential range of -0.8~0 V, indicating the highest charge storage capability in three samples. Fig. 5b shows CV curves of Fe2O3-CF-6 at different scan rates. All the CV profiles appear as semi-rectangular shape with a pair of light fluctuations at 0.3 V at cathodic sweep and anodic sweep, indicating a pseudocapacitive behaviors. Similar CV curves of Fe2O3-CF-Y with different reagent concentration can be seen in Fig. S7 (Supporting information).

|
Download:
|
| Fig. 5. (a) CV curves of the Fe2O3-CF-Y at 10 mV/s. (b) CV curves of Fe2O3-CF-6 at different scan rates. (c) GDC curves of Fe2O3-CF-6 at different current densities. (d) The area and specific capacitance of Fe2O3-CF-6 at different current densities. | |
GDC measurement at different current densities range from 1 mA/cm2 to 15 mA/cm2 are carried out for the Fe2O3-CF-6 (Fig. 5c). Nearly symmetric potential-time curves imply the high charge/ discharge columbic efficiency and low polarization. Low polarization and high discharge/charge columbic efficiency of the Fe2O3- CF-6 can be concluded by the nearly symmetric time-potential plots. The little slight curvature on such triangular curves indicate the good capacitive behaviors. Fig. 5d shows the specific capacitance of the Fe2O3-CF-6 obtained from GDC curves. The area capacitance reaches to 215 mF/cm2 at 1 mA/cm2 (or 693 F/g at 3.23 A/g). When the current density increase, the capacitance of Fe2O3-CF-6 gradually decrease and maintain a high capacitance of 162 m F/cm2 at 15 mA/cm2. This result demonstrates that Fe2O3- CF-6 is a good anode candidate for FAPCs.
Based on above information, FAPCs are assembled using Fe2O3- CF-6 as anode, MnO2-CF-60 as cathode, and PVA-LiCl as the separator and solid-state electrolyte. To assembly the FAPCs device, charge balance on cathode and anode is necessary to be considered in order to overall utilizing the whole potential window of the two electrodes [34, 35]. According to the equation of storage charge balance of q = C × ΔE × m, where q represents the storage charge on the electrode, C stands for the specific capacitance, ΔE and m are the potential range and mass loading of the positive or negative electrode, the mass ratio between cathode and anode should be m(MnO2)/m(Fe2O3) = 0.89. The device MnO2-CF//Fe2O3- CF is prepared based on this information using cathode MnO2-CF- 60 and anode Fe2O3-CF-6.
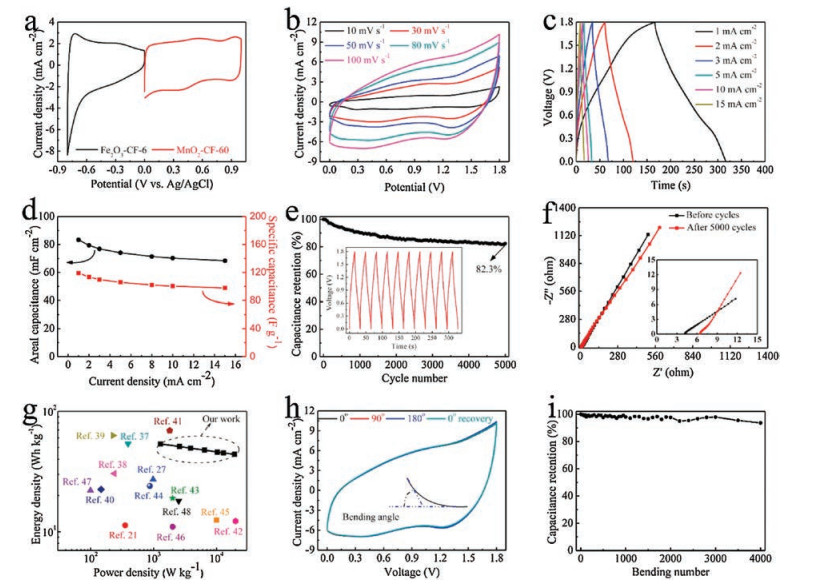
In device MnO2-CF//Fe2O3-CF, MnO2-CF-60 has a stable working potential window from 0 V to 1.0 V and Fe2O3-CF-6 is -0.8 V to 0 V, the working voltage of the device can reach up to 1.8 V based on the total potential window of the electrodes (Fig. 6a). A set of CV and GDC tests of the FAPC in different working voltages from 1.0 V to 1.8 V are performed to explore the stable working voltage (Fig. S8 in Supporting information). Fig. 6b shows the CV plots in the working voltage of 1.8 V at different sweep speeds from 10 mV/s to 100 mV/s. The weak redox peaks of the device suggest the pseudocapacitive behaviors of both electrodes. At high scan speed of 100 mV/s, the CV curve maintains the overall shape, indicating low contact resistance and good capacitive behavior of the device. The performance of this device is further investigated by a series of GDC experiment at different current densities. As shown in Fig. 6c, all the curves at different current density are nearly in triangular shape and exhibit negligible voltage drop due to the low resistance. The capacitance of the FAPC is calculated according to the discharge slope based on the total device area or the mass of active materials in the two electrodes (Fig. 6d). The area capacitance of the FAPC can reach to 83.3 mF/cm2 (or 119 F/g) at 1 mA/cm2 and maintains a high value of 68.37 mF/cm2 (97.66 F/g) at 15 mA/cm2, indicating an excellent rate capability.

|
Download:
|
| Fig. 6. (a) Comparative CV curves of Fe2O3-CF-6 and MnO2-CF-60 at 10 mV/s. (b) CV tests of FAPC at 10 mV/s to 100 mV/s. (c) GDC curves of FAPC at 1–15 mA/cm2. (d) The area and specific capacitance of the device at different current densities. (e) The cycling stability of the device at 5 mA/cm2. (f) Nyquist plots of FAPC before and after 5000 cycles at 5 mA/cm2. (g) Ragone plots of MnO2-CF//Fe2O3-CF and the reported works. (h) CV curves of FAPC under different bending angles at 100 mV/s. (i) Capacitance retention of FAPC for the multiple bending times at the bending angle of 90°. | |
Fig. S9 (Supporting information) shows the digital images of the device at different bending states. Cycling stability of the device is an important criterion in real application. The stability performance is studied in an extended charge-discharge cycling process (Fig. 6e). After 5000 cycles at 5 mA/cm2, 82.3% capacitance is maintained and the GDC curves are almost overlapping between the continuous cycles (inset of Fig. 6e), demonstrating the good cycling stability. To analyze the degradation of capacitance, electrochemical impedance spectroscopy (EIS) experiments are performed before and after 5000 cycles of GDC tests at 5 mA/cm2. Fig. 6f shows the Nyquist plot with two steep, straight lines at low frequency, indicating a low diffusion resistance in the electrode materials and an ideal capacitive behavior [12]. The equivalent circuit model is proposed and shown in Fig. S10 in Supporting information. In this model, the equivalent series resistance (Rs) incorporates the internal resistance of the active electrode material, interfacial resistance between the electrolyte and electrode, and ionic resistance in the gel electrolyte. It increases from 4.15 Ω to 6.43 Ω before and after 5000 cycles. In the high frequency, charge transfer resistance (Rct) increase a little bit from 2.16 Ω to 2.58Ω before and after 5000 cycles. The slight change of Rs and Rct is because of the distortion of the charge transfer channel which is due to the degradation of the electrode active material and gel electrolyte in the extended cycling [36]. This EIS data further support the high rate capability and exceptionally stable performance of the FAPC.
Fig. 6g shows the Ragone plot of the device MnO2-CF//Fe2O3-CF with other asymmetric or symmetric supercapacitors. MnO2-CF// Fe2O3-CF achieves a highest energy density of 53.55 Wh/kg at 1.28 kW/kg. As current density increased to 15 mA/cm2, the energy density can still maintain at 43.95 Wh/kg, along with an excellent power density of 19.29 kW/kg. These values are comparable with or exceeding the previously reported works, such as MnO2 nanoflowers//Bi2O3 nanoflowers (11.3 Wh/kg at 352.6 W/kg) [21], MnO2@carbon fiber//graphene (27.2 Wh/kg at 979.7 W/kg) [28], Ni(OH)2-MnO2-RGO//RGO (54.0 Wh/kg at 392 W/kg) [37], MnO2-GNS//FeOOH-GNS-CNTs (30.4 Wh/kg at 237.6 W/kg) [38] and other samples [39-48].
In order to examine its flexibility and mechanical stability, the FAPC at different bending states are tested by CV measurements. As shown in Fig. 6h, the CV curves are well maintained when bent to different angles at 100 mV/s. When it is bent to 90°, 180°, and then recovered to original state, no change on the CV curve is observed. The device performance is also evaluated at different bending cycles when bent to 90°. As shown in Fig. 6i, the capacitance decreases slightly with the increase of the bending cycles. Only 6.4% of capacitance decays after 4000 bending cycles. These results demonstrate that the MnO2-CF//Fe2O3-CF device has the superior flexibility and mechanical stability.
In summary, a flexible high-performance asymmetric supercapacitor is fabricated using MnO2 nanosheets and Fe2O3 nanowires grown on flexible carbon fabrics and employed as the cathode and anode, respectively. Owing to the optimization of the single electrodes and hybrid structures, the device exhibits high capacitance, stable cycling performance, a competitive energy density and power density, and good mechanical flexibility. These excellent performance metrics coupled with the low-cost design establish this as a promising candidate of advanced energy power system for portable and wearable electronics.
AcknowledgmentsThis work is financially supported by the National Natural Science Foundation of China (Nos. 51579057 and 51379065), and State Key Laboratory of Urban Water Resource and Environment, Harbin Institute of Technology (No. 2016DX07). J. Liu acknowledges the support of the Natural Science Foundation of Shandong Province (No. ZR2018MB018), the Natural Science Foundation of China (No. 21802080), the Thousand Youth Talents Program of China, and the Doctoral Fund of the QUST.
Appendix A. Supplementary dataSupplementary material related to this article can be found, in the online version, at doi:https://doi.org/10.1016/j.cclet.2018.09.013.
| [1] |
M.F. El-Kady, R.B. Kaner, Nat. Commun. 4 (2013) 1475. DOI:10.1038/ncomms2446 |
| [2] |
G.F. Chen, X.X. Li, L.Y. Zhang, et al., Adv. Mater. 28 (2016) 7680-7687. DOI:10.1002/adma.201601781 |
| [3] |
J.X. Zhu, D. Yang, Z.Y. Yin, Q.Y. Yan, H. Zhang, Small 10 (2014) 3480-3498. DOI:10.1002/smll.v10.17 |
| [4] |
G.F. Chen, Y.Z. Su, P.Y. Kuang, et al., Chem.-Eur. J. 21 (2015) 4614-4621. DOI:10.1002/chem.201405976 |
| [5] |
Z. Zhao, S.L. Liu, J.X. Zhu, et al., ACS Appl. Mater. Interfaces 10 (2018) 19871-19880. DOI:10.1021/acsami.8b03431 |
| [6] |
M.X. Chen, Y. Yang, D.Z. Chen, H. Wang, Chin. Chem. Lett. 28 (2018) 564-570. |
| [7] |
J. Yan, Z. Fan, W. Sun, et al., Adv. Mater. 22 (2012) 2632-2641. |
| [8] |
X. Lu, M. Yu, G. Wang, et al., Adv. Mater. 25 (2013) 267-272. DOI:10.1002/adma.201203410 |
| [9] |
P.C. Chen, G. Shen, Y. Shi, H. Chen, C. Zhou, ACS Nano 4 (2010) 4403-4411. DOI:10.1021/nn100856y |
| [10] |
J. Zhang, J. Jiang, H. Li, X. Zhao, Energy Environ. Sci. 4 (2011) 4009-4015. DOI:10.1039/c1ee01354h |
| [11] |
Z. Zhang, H. Wang, Y. Zhang, et al., Chem. Eng. J. 325 (2017) 221-228. DOI:10.1016/j.cej.2017.05.045 |
| [12] |
W. Liu, X. Li, M. Zhu, X. He, J. Power Sources. 282 (2015) 179-186. DOI:10.1016/j.jpowsour.2015.02.047 |
| [13] |
Q. Tang, W. Wang, G. Wang, J. Mater. Chem. A 3 (2015) 6662-6670. DOI:10.1039/C5TA00328H |
| [14] |
Y.G. Wang, Z.D. Wang, Y.Y. Xia, Electrochim. Acta 50 (2005) 5641-5646. DOI:10.1016/j.electacta.2005.03.042 |
| [15] |
Y. Li, X. Han, T. Yi, Y. He, X. Li, J. Energy Chem. 05 (2018) 010. |
| [16] |
Z. Lin, X. Yan, J. Lang, R. Wang, L.B. Kong, J. Power Sources 279 (2015) 358-364. DOI:10.1016/j.jpowsour.2015.01.034 |
| [17] |
J.X. Zhu, W.P. Sun, D. Yang, et al., Small 11 (2015) 4123-4129. DOI:10.1002/smll.v11.33 |
| [18] |
Z. Chen, W. Liao, X. Ni, Chem. Eng. J. 327 (2017) 1198-1207. DOI:10.1016/j.cej.2017.06.098 |
| [19] |
Y. Liu, L. Li, J.X. Zhu, et al., J. Mater. Chem. A 6 (2018) 13428-13437. DOI:10.1039/C8TA04218G |
| [20] |
S.M. Dong, X. Chen, X.Y. Zhang, G.L. Cui, Coordin. Chem. Rev. 257 (2013) 1946-1956. DOI:10.1016/j.ccr.2012.12.012 |
| [21] |
H. Xu, X. Hu, H. Yang, et al., Adv. Energy Mater. 5 (2015) 1401882. DOI:10.1002/aenm.201401882 |
| [22] |
Y.L. Chen, C. Chen, R. Lv, et al., Chin. Chem. Lett. 29 (2018) 616-619. DOI:10.1016/j.cclet.2017.12.028 |
| [23] |
K. Wang, J. Yang, J. Zhu, et al., J. Mater. Chem. A 5 (2017) 11236-11245. DOI:10.1039/C7TA01457K |
| [24] |
Q. Li, Z.L. Wang, G.R. Li, et al., Nano Lett. 12 (2012) 3803-3807. DOI:10.1021/nl301748m |
| [25] |
J. Ji, L.L. Zhang, H. Ji, et al., ACS Nano 7 (2013) 6237-6243. DOI:10.1021/nn4021955 |
| [26] |
X.F. Lu, X.Y. Chen, W. Zhou, Y.X. Tong, G.R. Li, ACS Appl. Mater. Interfaces 7 (2015) 14843-14850. DOI:10.1021/acsami.5b03126 |
| [27] |
P. Yang, Y. Ding, Z. Lin, et al., Nano Lett. 14 (2014) 731-736. DOI:10.1021/nl404008e |
| [28] |
N. Yu, H. Yin, et al., Adv. Energy Mater. 6 (2016) 1501458. DOI:10.1002/aenm.201501458 |
| [29] |
G.Q. Zhang, H.B. Wu, H.E. Hoster, M.B. Chan-Park, X.W.D. Lou, Energy Environ. Sci. 5 (2012) 9453-9456. DOI:10.1039/c2ee22572g |
| [30] |
S.L. Liu, J.S. Xu, J.X. Zhu, et al., J. Mater. Chem. A 5 (2017) 19997-20004. DOI:10.1039/C7TA04952H |
| [31] |
L.F. Chen, Z.H. Huang, H.W. Liang, Q.F. Guan, S.H. Yu, Adv. Mater. 25 (2013) 4746-4752. DOI:10.1002/adma.v25.34 |
| [32] |
K. Asami, K. Hashimoto, Corros. Sci. 17 (1977) 559-570. DOI:10.1016/S0010-938X(77)80002-4 |
| [33] |
E. McCafferty, J. Wightman, Surf. Interface Anal. 26 (1998) 549-564. |
| [34] |
T.H. Wu, C.T. Hsu, C.C. Hu, L.J. Hardwick, J. Power Sources 242 (2013) 289-298. DOI:10.1016/j.jpowsour.2013.05.080 |
| [35] |
C.T. Hsu, C.C. Hu, T.H. Wu, J.C. Chen, M. Rajkumar, Electrochim. Acta 146 (2014) 759-768. DOI:10.1016/j.electacta.2014.09.041 |
| [36] |
W. Wang, S. Guo, M. Penchev, et al., Nano Energy 2 (2012) 294. |
| [37] |
H. Chen, S. Zhou, L. Wu, ACS Appl. Mater. Interfaces 6 (2014) 8621-8630. DOI:10.1021/am5014375 |
| [38] |
C. Long, L. Jiang, T. Wei, J. Yan, Z. Fan, J. Mater. Chem. A 2 (2014) 16678-16686. DOI:10.1039/C4TA03241A |
| [39] |
C. Long, D. Qi, T. Wei, et al., Adv. Funct. Mater. 24 (2014) 3953-3961. DOI:10.1002/adfm.v24.25 |
| [40] |
M. Huang, Y. Zhang, F. Li, et al., Scientific Reports 4 (2014) 3878. |
| [41] |
A. Patil, V. Lokhande, U. Patil, P. Shinde, C.D. Lokhande, ACS Sustainable Chem. Eng. 1 (2017) 787-802. |
| [42] |
R.B. Rakhi, B. Ahmed, D. Anjum, H.N. Alshareef, ACS Appl. Mater. Interfaces 8 (2016) 18806-18814. DOI:10.1021/acsami.6b04481 |
| [43] |
Y. Zhao, W. Ran, J. He, et al., Small 11 (2015) 1310-1319. DOI:10.1002/smll.201401922 |
| [44] |
S. Wu, W. Chen, L. Yan, J. Mater. Chem. A 2 (2014) 2765-2772. DOI:10.1039/c3ta14387b |
| [45] |
H. Lv, X. Gao, Q. Xu, et al., ACS Appl. Mater. Interfaces 9 (2017) 40394-40403. DOI:10.1021/acsami.7b14761 |
| [46] |
H. Jiang, C. Li, T. Sun, J. Ma, Nanoscale 4 (2012) 807-812. DOI:10.1039/C1NR11542A |
| [47] |
Z. Lei, J. Zhang, X. Zhao, J. Mater. Chem. 22 (2012) 153-160. DOI:10.1039/C1JM13872C |
| [48] |
L. Peng, X. Peng, B. Liu, et al., Nano Lett. 13 (2013) 2151-2157. DOI:10.1021/nl400600x |