 2019, Vol. 30


b University of Chinese Academy of Sciences, Beijing 100049, China
Mercury is one of the most toxic metals wildly present in the environment. Due to long-range transport, mercury pollution has become a global concern [1]. Comprehensive Environmental Response, Compensation, and Liability Act (CERCLA) of US have listed mercury and its compounds in the "Priority List of Hazardous Substances". The toxicity and bioaccumulation of mercury are highly dependent on its chemical species and organomercury compounds are generally more toxic and bioaccumulative than inorganic mercury [2]. Methylmercury (MeHg), as the most toxic mercury compounds, can be produced naturally in anoxic sediment and water by microorganism, especially sulfur- and iron-reducing bacteria [3, 4]. Ethylmercury (EtHg) has also been observed in soils from wetland [5-7]. In addition, EtHg [8] and phenylmercury (PhHg) [9] are widely used as antimicrobial agents in agriculture and medicine, and can be released into the environment [10, 11]. These organomercury compounds can be accumulated in biota, especially in fish [12] and pose risks to human health [13].
Therefore, speciation analysis of organomercury compounds has become a hot topic, and a simple and cost-effective method is crucial for understanding their presences and risks in the environment. In the past decades, gas chromatography and high performance liquid chromatography (HPLC) have been widely applied to the separation of mercury species and various detectors were coupled to quantify mercury species, including UV, atomic fluorescence spectrometer (AFS), and inductively coupled plasma mass spectrometer (ICP-MS) [14]. Capillary electrophoresis (CE) has the advantages of high separation efficiency, low sample consumption and operating cost, which is very promising for elemental speciation [15, 16]. However, currently UV spectrometer is still the most accessible detector for commercial CE, and mercury speciation using CE usually suffers from the weak UV absorption of mercury species as well as the insufficient sensitivity of the UV detector.
To overcome these limitations, in this work, we present a new CE-UV method for separation and detection of three organomercury species namely MeHg, EtHg, and PhHg. Thiosalicylic acid (TA) was developed as the UV derivatization agent by a simple and fast pre-column complexation. In addition, on-line salt-induced stacking was further optimized to significantly improve the detection performance. The developed method was validated by analyzing MeHg and EtHg in biological samples.
Since orgnomercury compounds such as MeHg and EtHg have no chromosphere, they are not readily detectable in their native forms, and pre- [17], in- [18], or post-column [19] derivatization using chromogenic compounds is often required. Selection of proper chromogenic compounds for derivatization is very important for the CE separation and UV detection. The derivatization reagent should have good water solubility and the derived products could be easily separated and detected by CE-UV [20]. Although dithizone was often used for the derivatization and extraction of mercury compounds in spectroscopic determination, its poor aqueous solubility limits its application in aqueous CE. Here, we compared two commercial available derivatization agents for organomercury compounds, namely, ammonia pyrrolidine dithiocarbamate (APDC) and TA. We observed that the adsorption of hydrophobic derived products of APDC on the capillary wall is detrimental to CE separation. In contrast, TA (100 mL of 1mg/mL TA for 900 mL of 40 mg/L organomercury compounds) can effectively complex organomercury compounds and the resulting complexes can be well detected by CE-UV. The typical electropherogram of organomercury compounds with TA as derivatization agent and the UV–vis spectroscopy of the three derivatives are shown in Figs. S1 and S2 in Supporting information. Therefore, TA was selected as derivatization reagent in the following study.
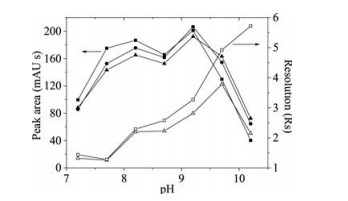
For efficient separation, two buffer systems including NH4Ac-HAc and borate buffer were studied. Three organomercury derivatives could be separated in baseline in both buffer systems, but a shorter electrophoretic time was obtained in borate buffer. Thus borate was adopted as the running buffer in the final electrophoretic separation. The pH of running buffer was studied in the range from 8.0 to 10.0 using 30mmol/L borate buffer as the background electrolyte. It was found that pH of the borate buffer had great influence on the separation and detection as illustrated in Fig. 1. Broaden peaks were observed at low buffer pH for organomercury derivatives. With the increased buffer pH, the peak area of organomercury derivatives increased and high separation efficiency was acquired. In addition, the resolution of three organomercury derivatives also increased with the increase of buffer pH. However, when the buffer pH was higher than 9.2, the peak area decreased sharply and the peak shape deteriorated.AtpH9.2, thehighestpeakareaandbaseline separation were observed. Therefore, borate buffer at pH 9.2 was selected for further research.

|
Download:
|
| Fig. 1. Effect of buffer pH on the separation of organomercury species. Sample: mixture standard of PhHg, EtHg and MeHg (40 mg/L for each). ■, PhHg; ●, EtHg; ▲, MeHg; □, resolution of PhHg and EtHg; △, resolution of EtHg and MeHg. Capillary: 75 mm id with 45.0 cm total length; capillary temperature: 20 ℃; voltage: 20 kV; running buffer: 30 mmol/L borate buffer; detection wavelength: 210 nm; injection: 30 mbar × 10 s. | |
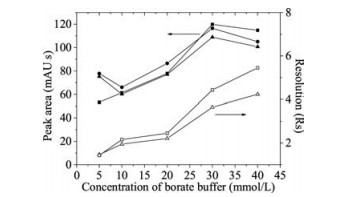
The influence of the borate buffer concentration on separation and detection of organomercury species was further investigated in the range from 5 mmol/L to 40 mmol/L at pH 9.2 (Fig. 2). When the concentration of borate buffer was lower than 10 mmol/L, three organomercury species cannot reach a baseline separation. With the increase of borate concentration, both resolution and migration time of organomercury species increased. However, when the concentration of borate buffer reached 40 mmol/L, the electrophoretic current is not stable and the peak area decreased due to the peak broadening induced by Joule heat effect. Therefore, a final concentration of borate buffer at 30 mmol/L was selected.

|
Download:
|
| Fig. 2. Effect of borate buffer concentration on the separation of organomercury species. Sample: PhHg, EtHg and MeHg mixture standard (20 mg/L for each).■, PhHg; ●, EtHg; ▲, MeHg; □, resolution of PhHg and EtHg; △, resolution of EtHg and MeHg. Other conditions were the same as in Fig. 1. | |
In addition, sodium dodecyl sulfate (SDS) surfactant and organic modifiers including methanol and acetonitrile were also studied as buffer additive to improve the separation. However, it was found that addition of SDS or organic modifiers resulted in longer separation time and no improvement of separation was observed. Therefore, no SDS and organic solvent were added in the background electrolyte.
Thus, a 30 mmol/L borate buffer at pH 9.2 was selected as the separation buffer in CE. Under the optimized conditions, the baseline separation of three organomercury species could be realized in 4 min. However, the detection limits of the method were about 1 mg/L for three organomercury species, which was far more satisfactory for analysis of organomercury in real environmental samples. Considering that, an on-line salt-induced stacking procedure was studied to further improve the sensitivity of this method.
The NaCl concentration in sample solutions and the injection time were optimized to realize the on-line stacking. Fig. 3 showed that when no NaCl was added in the sample, no stacking was observed. When the concentration of NaCl was higher than 30 mmol/L, splitting peaks appeared for three organomercury species, which was attributed to the electrolyte "memory effect" [21]. High sensitivity and satisfactory separation can be obtained when the concentration of NaCl in sample matrix was 20 mmol/L and then 20 mmol/L NaCl was selected as additive in sample matrix. The mechanism of on-line stacking was ascribed to transient isotachophoresis [22]. In stacking process, chloride in the sample served as leading ion, while borate ion in the background electrolyte as the terminating one [22]. Injection time was also investigated from 20 s to 240 s at the injection pressure of 30 mbar (Fig. S3 in Supporting information). The peak area increased with the increasing injection time; however, when the injection time was longer than 180 s, the baseline separation of three organomercury species cannot be achieved. Considering both of the resolution and sensitivity, the injection time of 180 s was selected.

|
Download:
|
| Fig. 3. Effect of NaCl concentration in sample matrix on stacking. From bottom to top, the concentrations of NaCl in sample matrix were (a) 0, (b) 10, (c) 20, (d) 30, (e) 40, (f) 50 mmol/L, respectively. Capillary: 75 mm id with 73.5 cm total length; injection: 30 mbar × 100 s. Other conditions were the same as in Fig. 1. | |
A typical electrohopherogram of MeHg, EtHg, and PhHg at optimized conditions is shown in Fig. 4. As can be seen, three organomercury species can be separated effectively in 25 min. Table S1 (Supporting information) shows the characteristics of the proposed method. The linearity of organomercury compounds was ranged from 400 mg/L to 2000 mg/L for PhHg, 200–2000 mg/L for EtHg and MeHg. The detection limits (S/N = 3) were 76.4 mg/L for MeHg, 83.0 mg/L for EtHg and 76.9 mg/L for PhHg, respectively. As shown in Table S2 (Supporting information), the detection limits of organomercury species obtained in this work are comparable to other CE-hyphenated methods [23-26].

|
Download:
|
| Fig. 4. Electropherograms of (a) the extract of fish tissue exposed by EtHg, (b) the extract of a certified reference material DORM-2 (dogfish muscle); (c) the extract of DORM-2 spiked with organomercury at 600 mg/L (as Hg). Injection: 30 mbar × 180 s. All other conditions were the same as in Fig. S3. | |
An alkaline extraction method was used for extracting organomercury compounds in the biological samples, and the final sample for CE injection was dissolved in a 10 mmol/L Na2S2O3 solution. The influence of Na2S2O3 on the stacking and separation was investigated. The results showed that 10 mmol/L Na2S2O3 has no influence on both on-line stacking and separation of the three organomercury species.
In order to validate the method developed in the present study, MeHg content in certified reference material DORM-2 (dogfish muscle) was determined. As shown in Table S3 (Supporting information), the result was in good agreement with the certified value. In addition, this method was used to determine the concentration of EtHg in fish tissues (Chinese rare minnow) exposed by EtHg chloride. The results agreed well with those obtained by high performance liquid chromatography-atomic fluorescence spectroscopy (Table S3 and Fig. 4).
In conclusion, a novel capillary electrophoresis method for the speciation of MeHg, EtHg, and PhHg has been developed. Precolumn UV derivatization and on-line stacking were optimized to improve the analytical performance. The developed method was validated by certified reference material and exposed fish sample, which suggests this method could be useful in the speciation of organomercury compounds in biological samples.
AcknowledgmentWe gratefully acknowledge the National Natural Science Foundation of China (No. 21777178) for financial support.
Appendix A. Supplementary dataSupplementary material related to this article can be found, in the online version, at doi:https://doi.org/10.1016/j.cclet.2018.10.015.
| [1] |
C.T. Driscoll, R.P. Mason, H.M. Chan, et al., Environ. Sci. Technol. 47 (2013) 4967-4983. DOI:10.1021/es305071v |
| [2] |
D.W. Boening, Chemosphere 40 (2000) 1335-1351. DOI:10.1016/S0045-6535(99)00283-0 |
| [3] |
E.J. Fleming, E.E. Mack, P.G. Green, et al., Appl. Environ. Microbiol. 72 (2006) 457-464. DOI:10.1128/AEM.72.1.457-464.2006 |
| [4] |
C.C. Gilmour, D.A. Elias, A.M. Kucken, et al., Appl. Environ. Microbiol. 77 (2011) 3938-3951. DOI:10.1128/AEM.02993-10 |
| [5] |
Y. Cai, R. Jaffé, R. Jones, Environ. Sci. Technol. 31 (1997) 302-305. DOI:10.1021/es960587a |
| [6] |
Y. Mao, Y. Yin, Y. Li, et al., Environ. Pollut. 158 (2010) 3378-3384. DOI:10.1016/j.envpol.2010.07.031 |
| [7] |
S.D. Siciliano, A. Sangster, C.J. Daughney, et al., J. Environ. Qual. 32 (2003) 2085-2094. DOI:10.2134/jeq2003.2085 |
| [8] |
D.A. Geier, L.K. Sykes, M.R. Geier, J. Toxicol. Environ. Health B Crit. Rev. 10 (2007) 575-596. DOI:10.1080/10937400701389875 |
| [9] |
Y. Xu, Y. He, X. Li, et al., Diagn. Microbiol. Infec. Dis. 75 (2013) 64-67. DOI:10.1016/j.diagmicrobio.2012.09.008 |
| [10] |
H. Hintelmann, M. Hempel, R.D. Wilken, Environ. Sci. Technol. 29 (1995) 1845-1850. DOI:10.1021/es00007a023 |
| [11] |
A. Deonarine, H. Hsukim, T. Zhang, et al., Chemosphere 138 (2015) 960-965. DOI:10.1016/j.chemosphere.2014.12.038 |
| [12] |
M. Li, A.T. Schartup, A.P. Valberg, et al., Environ. Sci. Technol. 50 (2016) 11559-11568. DOI:10.1021/acs.est.6b03206 |
| [13] |
N. Nedley, F.E. Ramirez, Drug Metab. Pharmacok. 33 (2018) S71-S72. |
| [14] |
M. Leermakers, W. Baeyens, P. Quevauviller, et al., TrAC-Trends. Anal. Chem. 24 (2005) 383-393. DOI:10.1016/j.trac.2004.01.001 |
| [15] |
A.R. Timerbaev, Talanta 52 (2000) 573-606. DOI:10.1016/S0039-9140(00)00364-7 |
| [16] |
P. Kubán, P. Pelcová, J. Margetínová, et al., Electrophoresis 30 (2010) 92-99. |
| [17] |
F. Yang, J. Li, W. Lu, et al., Electrophoresis 35 (2014) 474-481. DOI:10.1002/elps.201300409 |
| [18] |
Z.L. Peng, F. Qu, G.Q. Song, et al., Electrophoresis 26 (2010) 3333-3340. |
| [19] |
M.J. Shaw, P. Jones, P.R. Haddad, Analyst 128 (2004) 1209-1212. |
| [20] |
A.S. Ptolemy, Britz-Mckibbin P., J. Chromatogr. A 1106 (2006) 7-18. DOI:10.1016/j.chroma.2005.11.012 |
| [21] |
S.V. Ermakov, M.Y. Zhukov, L. Capelli, et al., Anal. Chem. 66 (1994) 4034-4042. DOI:10.1021/ac00094a028 |
| [22] |
C. Tu, H.K. Lee, J. Chromatogr. A 966 (2002) 205-212. DOI:10.1016/S0021-9673(02)00744-6 |
| [23] |
Y. Li, Y. Jiang, X.P. Yan, Electrophoresis 26 (2010) 661-667. |
| [24] |
B.H. Li, Anal. Methods 3 (2011) 116-121. DOI:10.1039/C0AY00480D |
| [25] |
Z.L. Peng, G.Q. Song, L.X. Zhao, et al., Chromatographia 64 (2006) 281-285. DOI:10.1365/s10337-006-0038-0 |
| [26] |
X. Jiang, X. Xu, X. Hou, et al., J. Anal. At. Spectrom. 31 (2016) 1423-1429. DOI:10.1039/C6JA00142D |