 2019, Vol. 30


Surface-enhanced Raman scattering (SERS) is a powerful scientific tool capable of ultra-sensitive molecule recognition and detection. By adopting metallic nanostructures substrate, the Raman signals of molecules can be improved by factors of 106–1016 due to the electromagnetic field and chemical enhancement [1-3]. Moreover, distinctive spectral features of analyte molecules with different vibrational modes can be acquired by SERS [4]. Therefore, the high selectivity of SERS enables the label-free positive identification of target analytes in complex environments [5]. As a type of metallic nanostructures material, metal nanoparticles (NPs) have been used as substrates, and greatly extend the application of SERS. Among noble metal NPs, Ag nanoparticles (AgNPs) is the favorable one due to excellent plasmonic ability, facile synthesis and high signal enhancement [6]. For example, the SERS enhancement performance of AgNPs has been proved superior to Au nanoparticles (AuNPs) according to lectures [7, 8]. Furthermore, our previous studies showed that AgNPs with excellent dispersivity and high SERS activity can be synthesized under mild conditions by using nitrogen-rich quantum dots (NDs) as reductant and stabilizer [9]. However, the chemical stability of AgNPs is inferior to that of AuNPs [10]. To conquer disadvantage of monometallic NPs substrate, bimetallic composites were carried out, and revealed superior SERS performance [11]. Therefore, Ag/ Au bimetallic nanostructures may be a stable, effective, and sensitive substrate for SERS.
In this work, NDs were used as reducing agent and stabilizer in AuNPs preparation, and NDs-Au@AgNPs SERS substrate was synthesized onto the NDs-AuNPs core in mild conditions via seed-mediated growth method. As reported in our previous work [9, 12], NDs were hydrothermal synthesized using precursor, 2- azidoimidazole, which introducing abundant nitrogen and oxygen-containing functional groups onto their surface. These NDs also turned out to have great reducibility in noble metal NPs synthesis, e.g. AgNPs and AuNPs preparation. By employing seedmediated growth method with the participation of NDs, preparation of NDs-Au@AgNPs SERS substrate is not only simple but also fast. More importantly, this proposed substrate possesses good stability, high activity, and great Raman signal enhancement.
To investigate the analytical performance of such a NDsAu@AgNPs SERS substrate for the determination of small molecules, a series of noxious aniline derivatives including p-nitroaniline (PNA), m-nitroaniline (MNA), o-nitroaniline (ONA), were selected. Considering the widely use of nitroaniline as intermediates in the synthesis of dyestuffs, medicines, pesticides, and herbicides, they are commonly encountered organic contaminants in environmental systems [13]. Moreover, due to their highly toxic nature, mutagenic effects and potential carcinogenic, nitroanilines have become more and more significant in environmental science and therefore have been included in the US Environmental Protection Agency (EPA) list of priority pollutants [14-17]. Despite their separation and determination have become one of the important studies of environmental analysis, the recognition of nitroaniline isomers is one of the most challenging due to their similar chemical and physical properties, e.g. charge density and structural complexity. Nowadays various analytical techniques including high-performance liquid chromatography (HPLC) [18-21], gas chromatography (GC) [22-24], solid-phase extraction (SPE) [25], spectrophotometry [26-28] and fluorescence spectroscopy [29] have been employed to analyze three nitroaniline isomers. Although the determination of the three analytes by the mentioned methods is feasible, ultraviolet absorption and fluorescence spectroscopy are poor selectivity, and the others require expensive instruments and time-consuming multistep procedures. Thus, it is very necessary to develop easily applicable and highly sensitive methods for effective recognition of isomers of nitroanilines. SERS has several advantages including high sensitivity, simplicity, fast detection speed, as well as its capability in the recognition of compounds. In this work, the SERS spectra of PNA, MNA, and ONA adsorbed on NDs-Au@AgNPs were studied, respectively. The spectra suggest that by using NDs-Au@AgNPs as substrates, the SERS technique is capable of recognizing the isomers at low concentrations. In addition, the possible adsorption behavior was further studied, which is of great significance for the related work about differentiation of isomers and the mechanism of SERS enhancement.
In this work, NDs with abundant surface functional groups were hydrothermal synthesized based on our previous work [9, 12]. The synthesized NDs do not need further processing or surface functionalization and can act as an excellent reducing and stabilizing agent towards the formation of AuNPs by simply mixing NDs with metal salts at 120 ℃ within 2 h. Taking advantage of abundant nitrogen and oxygen-containing functional groups on the surface of NDs, the method mentioned above is simple and facile, and no additional reductant, stabilizer and external energy are necessary.
Fig. S1A (Supporting information) shows the UV–vis spectra of NDs, NDs-AuNPs and NDs-Au@AgNPs. Owing to the p–p* transition of aromatic sp2 domains which likely resulted from the broad size distribution of NDs produced, the NDs showed an increasing absorbance with decreasing wavelength [30-32] (Fig. S1A, black line). One can clearly find from red line in Fig. S1A that an absorption band due to surface plasmon resonance (SPR) at 530 nm is observed, which confirms that AuNPs are formed under the present experimental conditions. It was also experimentally found that this peak disappeared after the addition of Ag+, and two new peaks appeared at 410 nm and 495 nm, which correspond to the characteristic absorption of the spherical AgNPs and AuNPs induced by blue shifted, respectively (Fig. S1A, blue line). The fluorescence (FL) emission spectra of the NDs at different excitation wavelengths are shown in Fig. S1B (Supporting information), the NDs displayed an excitation-dependent FL behavior, which is similar with most other fluorescence carbon quantum dots. The emission intensity increased as the excitation wavelength was increased from 280 nm to 320 nm after which it decreased and red shifted. The maximum FL emission of the NDs is located at 390 nm under 320 nm excitation.
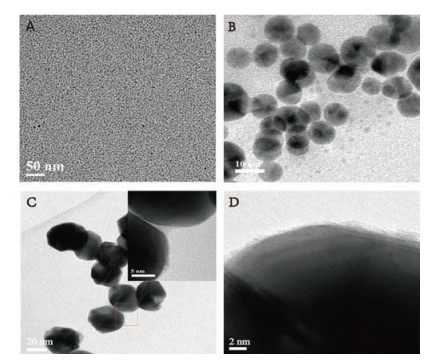
The morphology and size of as-synthesized nanomaterials were explored by transmission electron microscopy (TEM). It can be clearly seen from the TEM images (Fig. 1A) that the ultrasmall monodispersed NDs are formed with an average particle size of 2.8 nm, and the products consist of small particles which are well separated from each other. Fig. 1B shows the typical TEM image of NDs-AuNPs, which were synthesized by using NDs as reductant and stabilizer. The shape of NDs-AuNPs is nearly spherical and the diameters ranging from 8 nm to 15 nm. The NDs-Au@AgNPs were prepared via the seed-mediated method by using as-synthesized NDs-AuNPs as seeds. As shown in Fig. 1C, the TEM image of NDsAu@AgNPs shows that each composite nanoparticle displays a relatively quasi-type of shape morphology due to the core/shell formation. One can clearly see that the NDs-Au@AgNPs are mostly spherical in shape and exhibited moderate particle size monodispersity. The effective size of NDs-Au@AgNPs with ranging from 20 nm to 30 nm is much larger than that of the NDs-AuNPs. Moreover, the high magnification TEM image of NDs-Au@AgNPs reveals a clear uniform thin layer of silver coating corresponding to the high-contrast interior core (Fig. 1D), which is the direct evidence for the formation of Au-core-Ag-shell composite nanoparticles (NDs-Au@AgNPs). What is more, it is difficult to find NDs in the TEM picture, the reason might be that the low contrast of the substrate used [33].

|
Download:
|
| Fig. 1. TEM images of NDs (A), NDs-AuNPs (B) and NDs-Au@AgNPs (C/D). | |
Energy-dispersive X-ray spectroscopy (EDS) and X-ray photoelectron spectroscopy (XPS) were employed to analyze the elemental distribution and surface composition of the NDsAu@AgNPs. Fig. S2 (Supporting information) shows the EDS of one Au@Ag nanoparticle, which indicates the whole nanoparticle constitute both Au and Ag element, and also proved the formation of core (Au)-shell (Ag) structure. As manifested in Figs. S3A and B (Supporting information), the XPS full scan spectra of NDs and NDs-Au@AgNPs exhibit three peaks at 284.8, 399.9 and 532.0 eV, which are attributed to C 1s, N 1s, and O 1s, respectively. Compared to the XPS spectrum of NDs, the XPS full scan spectrum of the NDs-Au@AgNPs presents new peak of Ag and Au elements. As can be seen from Figs. S3C and D (Supporting information), high-resolution Au 4f and Ag 3d XPS spectra of NDs-Au@AgNPs show the binding energies of Au(0) (84.1 eV and 87.8 eV, corresponding to 4f7/2 and 4f5/2, respectively) and Ag(0) (367.7 eV and 373.7 eV, corresponding to 3d5/2 and 3d3/2, respectively), suggesting the metallic nature of gold and silver, and the results are in agreement with EDS characterization. These observations strongly demonstrate that NDs-Au@AgNPs has been formed.
The synthesis conditions including the preparation temperature and time, the concentrations of HAuCl4 and NDs are optimized for the NDs-AuNPs. As shown in Figs. S4A and B (Supporting information), the concentrations of HAuCl4 and NDs being too high or too low is not suitable for the preparation of NDs-AuNPs. When the volume of the HAuCl4 increased from 0.2 mL to 0.5 mL, the concentrations of obtained NDs-AuNPs significantly increased allowing absorbance value to arise from 0.13 up to 0.29. However, the continuing increase in HAuCl4 volume, i.e., from 0.5 mL to 0.7 mL, could decrease the absorbance value of obtained NDsAuNPs. Similarly, the absorbance at 530 nm reached the maximum value in the NDs volume of 5.0 mL and gradually decreased after that. Too high concentrations of HAuCl4 and NDs might lead to less formation and aggregation of NDs-AuNPs. Accordingly, the most suitable volume of HAuCl4 and NDs are 0.5 mL and 5.0 mL, respectively. Fig. S4C (Supporting information) displays that the absorbance at 530 nm increase with increasing incubation temperature in the range from 60 ℃ to 120 ℃ and do not undergo an obvious change after 120 ℃, suggesting that high temperature could be beneficial to the formation of NDs-AuNPs and the optimal preparation temperature is 120 ℃. Fig. S4D (Supporting information) shows the effect of reaction time, ranging from 0.5 h to 3 h. One can find that there is an obvious increase in absorbance when the reaction time is longer than 0.5 h, and the absorbance reach the maximum value at the preparation time of 2 h. Too long a reaction time presumably lead to the aggregation of NDs-AuNPs, which in turn induce a decrease in absorbance. The optimal reaction time of 2 h is thereby chosen for all the experiments. The influence of the temperature and the concentration of AgNO3 over the SERS performance of NDs-Au@AgNPs were also carefully investigated. Rhodamine 6G (R6G) was used as a model molecule to evaluate the SERS performances of the obtained NDs-Au@AgNPs by modifying them on silicon wafers, and the Raman peak at 1362 cm-1 was used as a characteristic peak for R6G molecule. As can be seen from Fig. S5A (Supporting information), the AgNO3 concentration can play a vital role in yielding core (Au)-shell (Ag) structure. The surface plasma resonance absorption of AgNPs is becoming increasingly obvious with increasing AgNO3 concentration, while the absorption peaks of NDs-AuNPs seeds decreased accordingly. Only when the numbers of resulted AgNPs and NDs-AuNPs achieve balanced, the NDs-Au@AgNPs with high SERS activity will be obtained. One can clearly find from Fig. S5B (Supporting information) that the Raman intensity at 1362 cm-1 reached the maximum value in the AgNO3 volume of 200 mL. Thus, we chose 200 mL AgNO3 as the best. As also shown in Figs. S5C and D (Supporting information), 75 ℃ is adopted as the optimal reaction temperature for the preparation of NDs-Au@AgNPs.
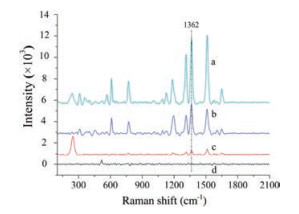
Besides, the NDs-Au@AgNPs were further investigated with a surface Raman enhancement study by using R6G as Raman-active probe. The SERS substrates were simply prepared by dropping R6G dye molecule solution on nanoparticles samples. Fig. 2 compares the Raman spectra of R6G molecules on NDs-AuNPs, NDs-AgNPs, and NDs-Au@AgNPs. The strong Raman peaks at 612 cm-1, 774 cm-1, 1362 cm-1, 1509 cm-1 and 1650 cm-1 were in good agreement with the previous reports of pure R6G [34]. One can clearly find from the Raman spectra of R6G that much stronger signals of R6G were obtained from the NDs-Au@AgNPs. The most intense peak at 1362 cm-1 is due to C--C stretching mode of R6G. The Raman intensities of R6G on the NDs-Au@AgNPs and NDsAgNPs at 1362 cm-1 are 5918 and 2650, respectively. In contrast, the Raman intensity on NDs-AuNPs is 402. The NDs-Au@AgNPs showed an obviously stronger SERS signal than NDs-AuNPs and NDs-AgNPs.

|
Download:
|
| Fig. 2. SERS spectra of R6G on NDs-Au@AgNPs (a), NDs-AgNPs (b), NDs-AuNPs (c) and normal Raman spectrum of pure R6G on silicon slice (d). | |
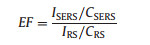
As known, the Raman enhancement factor (EF) is calculated to quantify the SERS activity. The corresponding EFSERS is experimentally defined as [35, 36]:
|
In this equation, CRS corresponds for the concentration of R6G which produces a Raman signal IRS under non-SERS condition. ISERS is the Raman signal of the R6G molecules on NDs-Au@AgNPs SERS substrate using the experimental analyte concentration (CSERS). Therefore, the calculated EF for R6G is 107.
To further investigate the enhancement of the Raman signal by the SERS-active substrates, we used different substances including malachite green, direct red, sudan black B, crystal violet, solvent yellow, methylene blue trihydrate, anthracene, naphthalene as target molecules. Fig. S6 (Supporting information) compares the Raman intensity spectra of different substances on NDs-Au@AgNPs and commercial SERS substrate. One can clearly see that NDsAu@AgNPs exhibits obvious SERS enhancement compared with that adsorbed on commercial SERS substrate. This enhancement can be attributed to the effective adsorption of target molecule onto the large number of SERS hot spots generated by the nanopores with sizes below 10 nm [37-39]. Moreover, NDs is rich in functional groups, therefore, NDs-Au@AgNPs which were prepared by using NDs as reductant and stabilizer will better enrichment to the basal surface of the target molecules by electrostatic interactions or coordination role. Furthermore, the suitable distance between NDs and metal nanoparticles was helpful for creating electromagnetic "hot spots" which caused larger SERS signal.
We further examined the SERS repeatability of NDs-Au@AgNPs by recording spectra from 11 randomly selected places on the same batch and taking SERS spectra with 11 different batches of the samples. One of the characteristic peaks of R6G at 1362 cm-1 is selected and the peak intensities are plotted in Fig. S7 (Supporting information). The relative standard deviations of the peak at 1362 cm-1 were 2.7% and 12.8%, respectively, indicating an excellent reproducibility and high uniformity of NDs-Au@AgNPs as SERS-active substrates.
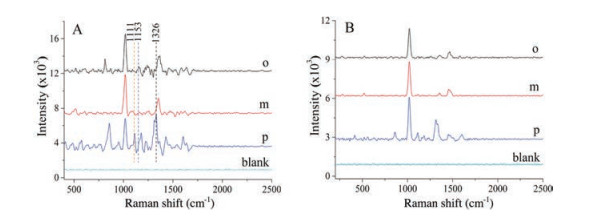
For SERS measurements, a methanol solution of PNA, MNA, or ONA (0.1 mmol/L) were dropped on the SERS substrates. The SERS spectra in NDs-Au@AgNPs solution and commercial gold colloidal solution for PNA (p), MNA (m), and ONA (o) are respectively represented in Figs. 3A and B. One can find that there are significant changes in the SERS spectra of PNA, MNA, and ONA molecules adsorbed on the NDs-Au@AgNPs substrates, and the SERS efficiency of the NDs-Au@AgNPs was much higher than the commercial gold colloidal. Comparing with commercial gold colloidal, more characteristic peaks appeared at locations 1111 cm-1 (CH in-plane bend) and 1153 cm-1 (C-NO2 stretch) by using NDs-Au@AgNPs as SERS substrate. Table S1 (Supporting information) lists vibrational assignments of the Raman bands for ONA, MNA and PNA. The three spectra show the common features mentioned above around 1016 cm–1 and 1326 cm–1, assigned respectively to the Ring breathing and NO2 symmetric stretching. In particular, the overall Raman scattering intensities of MNA are much weaker than those of PNA and ONA. The intensities of Raman bands associated with the nitro group of MNA are weak probably due to the nitro group of MNA cannot efficiently accept the electron donated by the amino group [40]. Moreover, the SERS spectrum of PNA is generally more intense than the SERS spectrum of ONA and MNA, indicating a more tilted position of ONA and MNA on the NDs-Au@AgNPs surface. More importantly, bands of CH in-plane bend is observed at 1111 cm-1 in the PNA but cannot be observed in the other two. The spectra also clearly show the individual characteristic Raman peaks at 818 cm-1 (NO2 wag) for ONA. The spectra suggest that by using NDs-Au@AgNPs as substrates, the SERS technique is capable of detecting nitroanilines at trace levels and is capable of recognizing the isomers at low concentrations. Furthermore, when commercial gold colloidal was used as SERS substrate, only PNA can be identified in three isomers, indicating that the commercial gold colloidal cannot be used in the recognition of nitroaniline isomers.

|
Download:
|
| Fig. 3. SERS spectra of nitroaniline isomers obtained from the NDs-Au@AgNPs substrates (A) and commercial SERS substrates (B). | |
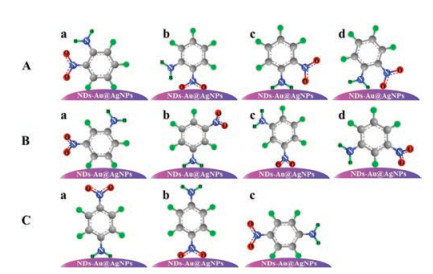
To clearly elucidate the nitroaniline modes, the adsorption of nitroaniline on NDs-Au@AgNPs substrates was studied. As manifested in Fig. 4A, there are four different adsorption mode of ONA on substrates. As can be seen from the assignments of vibrational bands (Table S1), among the Raman bands of ONA, the strongest is Ring breathing of benzene ring at 1016 cm-1, thus indicating that it is a short distance between the benzene ring of ONA and the substrate surface. Moreover, it was experimentally found that the intensities of peaks at 818 cm-1 for bending vibration and 1360 cm-1 for symmetric stretching vibration of NO2 group were significantly increased, while the low-intensity peaks at 1244 cm-1 and 1635 cm-1 for vibration of NH2 group were also observed. Based on the above results, it was inferred that the adsorption mode of ONA on NDs-Au@AgNPs substrates most likely to be a and b in Fig. 4A.

|
Download:
|
| Fig. 4. The possible adsorption behaviors of ONA (A), MNA (B) and PNA (C) in NDs-Au@AgNPs substrate. | |
The four adsorption modes of MNA on substrates is manifested in Fig. 4B. As also can be seen from Fig. 3A, the intensity of Ring breathing of benzene ring at 1024 cm-1 for MNA is stronger than ONA and PNA, and the peak at 1355 cm-1 for NO2 symmetric stretch was observed. One can also find that there is not any vibration peaks of NH2 group can be observed. These results suggest that the benzene ring of MNA is close to the substrates, while the NH2 group is distant. Therefore, the adsorption mode of MNA on NDs-Au@AgNPs substrates most likely to be c in Fig. 4B.
PNA is more polar molecule than the other two nitroaniline isomers [41]. One can clearly find from the SERS spectra of PNA in Fig. 3A that the intensities of peaks at 856 cm-1 for NO2 bend, 1016 cm-1 for Ring breathing and 1329 cm-1 for NO2 symmetric stretch were significantly increased, indicating that benzene ring and NO2 group are close to the substrate surface. On the contrary, the vibration of NH2 group at 1222 cm-1 and 1619 cm-1 are relatively weak. Based on the results above, it was inferred that the adsorption mode of PNA on NDs-Au@AgNPs substrates most likely to be b in Fig. 4C.
In summary, we have demonstrated a simple approach towards the synthesis NDs-Au@AgNPs using NDs as the reducing and stabilizing agent. The SERS properties of the NDs-Au@AgNPs demonstrate a significant enhancement of the Raman signal, and the enhancement factor was found to be 107. Furthermore, the asprepared NDs-Au@AgNPs SERS substrate was used for recognition and detection of isomers of nitroanilines. In addition, the possible adsorption behavior was further studied, which is of great significance for the related work about differentiation of isomers and the mechanism of SERS enhancement. Work presented here provides a fundamental understanding regarding the interaction of the nitroaniline isomers with NDs-Au@AgNPs that will aid in a range of industrial and environmental applications where nanotechnology is important. We believe that NDs-Au@AgNPs have potential in SERS applications as highly efficient substrates.
AcknowledgmentsThis work was supported by the National Natural Science Foundation of China (Nos. 21675178, 21475153 and 21575167), the Natural Science Foundation of Guangdong Province, China (No. 2016A030313358), and the Special Funds for Public Welfare Research and Capacity Building in Guangdong Province of China (No. 2015A030401036), and the Guangzhou Science and Technology Program of China (No. 201604020165), respectively.
Appendix A. Supplementary dataSupplementary material related to this article can be found, in the online version, at doi:https://doi.org/10.1016/j.cclet.2018.08.004.
| [1] |
L. Jensen, C.M. Aikens, G.C. Schatz, Chem. Soc. Rev. 37 (2008) 1061-1073. DOI:10.1039/b706023h |
| [2] |
P.L. Stiles, J.A. Dieringer, N.C. Shah, van Duyne R.P., Annu. Rev. Anal. Chem. 1 (2008) 601-626. DOI:10.1146/annurev.anchem.1.031207.112814 |
| [3] |
S.M. Nie, S.R. Emory, Science 275 (1997) 1102-1106. DOI:10.1126/science.275.5303.1102 |
| [4] |
Y.E. Shi, W.S. Wang, J.H. Zhan, Nano Res. 9 (2016) 2487-2497. DOI:10.1007/s12274-016-1135-5 |
| [5] |
Y.Q. Dong, Q. Wang, L.S. Wan, X. You, Y.W. Chi, J. Mater. Chem. C 4 (2016) 7472-7477. DOI:10.1039/C6TC01943A |
| [6] |
Y. Li, X.J. Zhao, P.P. Zhang, et al., J. Mater. Chem. C 3 (2015) 4126-4133. DOI:10.1039/C5TC00196J |
| [7] |
L.J. Tang, S. Li, F. Han, et al., Biosens. Bioelectron. 71 (2015) 7-12. DOI:10.1016/j.bios.2015.04.013 |
| [8] |
M.Y. Khaywah, S. Jradi, G. Louarn, et al., J. Phy. Chem. C 119 (2015) 26091-26100. DOI:10.1021/acs.jpcc.5b04914 |
| [9] |
Z.H. Lin, J.N. Yang, Z.J. Tang, G.K. Li, Y.L. Hu, Talanta 178 (2018) 515-521. DOI:10.1016/j.talanta.2017.09.072 |
| [10] |
C. Zhang, S.Z. Jiang, C. Yang, et al., Sci. Rep. 6 (2016) 25243. DOI:10.1038/srep25243 |
| [11] |
L. Zhang, C. Wang, Y. Zhang, Appl. Surf. Sci. 258 (2012) 5312-5318. DOI:10.1016/j.apsusc.2012.01.101 |
| [12] |
Z.J. Tang, Z.H. Lin, G.K. Li, Y.L. Hu, Anal. Chem. 89 (2017) 4238-4245. DOI:10.1021/acs.analchem.7b00284 |
| [13] |
X.F. Guo, J. Lv, W.D. Zhang, et al., Talanta 69 (2006) 121-125. DOI:10.1016/j.talanta.2005.09.008 |
| [14] |
A.D. Dimou, V.A. Sakkas, T.A. Albanis, Int. J. Environ. Anal. Chem. 84 (2004) 173-182. DOI:10.1080/0306731031000149660 |
| [15] |
G.H. Xiang, C.L. Tong, H.Z. Lin, J. Fluoresc. 17 (2007) 512-521. DOI:10.1007/s10895-007-0203-3 |
| [16] |
M. Hasani, F. Emami, Talanta 75 (2008) 116-126. DOI:10.1016/j.talanta.2007.10.038 |
| [17] |
X.Y. Lin, Y.N. Ni, S. Kokot, J. Hazard. Mater. 243 (2012) 232-241. DOI:10.1016/j.jhazmat.2012.10.026 |
| [18] |
L.F. Yao, H.B. He, Y.Q. Feng, S.L. Da, Talanta 64 (2004) 244-251. DOI:10.1016/j.talanta.2004.02.019 |
| [19] |
S.P. Wang, H.J. Chen, J. Chromatogr. A 979 (2002) 439-446. DOI:10.1016/S0021-9673(02)01435-8 |
| [20] |
C.L. Tong, Y. Guo, W.P. Liu, Chemosphere 81 (2010) 430-435. DOI:10.1016/j.chemosphere.2010.06.066 |
| [21] |
V. Pino, A.M. Afonso, V. González, W.L. Hinze, J. Liq. Chromatogr. Relat. Technol. 26 (2003) 1-15. DOI:10.1081/JLC-120017148 |
| [22] |
H. Kataoka, J. Chromatogr. A 733 (1996) 19-34. DOI:10.1016/0021-9673(95)00726-1 |
| [23] |
J.S. Chiang, S.D. Huang, Talanta 75 (2008) 70-75. DOI:10.1016/j.talanta.2007.10.036 |
| [24] |
P.J. Marriott, R.M. Kinghorn, R. Ong, et al., J. High Resolut. Chromatogr. 23 (2000) 253-258. DOI:10.1002/(ISSN)1521-4168 |
| [25] |
S.D. Huang, C.P. Cheng, Y.H. Sung, Anal. Chim. Acta 343 (1997) 101-108. DOI:10.1016/S0003-2670(96)00588-0 |
| [26] |
H.D. Revanasiddappa, K. Kumar, M. Bilwa, Mikrochim. Acta 137 (2001) 249-253. DOI:10.1007/s006040170018 |
| [27] |
J. Ghasemi, A. Niazi, Talanta 65 (2005) 1168-1173. DOI:10.1016/j.talanta.2004.08.052 |
| [28] |
M. Hasani, F. Emami, J. Chemometr. 27 (2013) 341-352. DOI:10.1002/cem.v27.10 |
| [29] |
J.H. Wang, G.Y. Li, X.J. Liu, et al., Inorg. Chim. Acta 473 (2018) 70-74. DOI:10.1016/j.ica.2017.12.030 |
| [30] |
J.J. Zhou, Z.H. Sheng, H.Y. Han, M.Q. Zou, C.X. Li, Mater. Lett. 66 (2012) 222-224. DOI:10.1016/j.matlet.2011.08.081 |
| [31] |
A. Prasannan, T. Imae, Ind. Eng. Chem. Res. 52 (2013) 15673-15678. DOI:10.1021/ie402421s |
| [32] |
J.B. Essner, C.H. Laber, G.A. Baker, J. Mater. Chem. A 3 (2015) 16354-16360. DOI:10.1039/C5TA02949J |
| [33] |
L.M. Shen, M.L. Chen, L.L. Hu, X.W. Chen, J.H. Wang, Langmuir 29 (2013) 16135-16140. DOI:10.1021/la404270w |
| [34] |
G.F. Li, H. Li, Y.J. Mo, X.J. Huang, L.Q. Chen, Chem. Phys. Lett. 330 (2000) 249-254. DOI:10.1016/S0009-2614(00)01123-4 |
| [35] |
Le Ru E.C., E. Blackie, M. Meyer, P.G. Etchegoin, J. Phys. Chem. C 111 (2007) 13794-13803. DOI:10.1021/jp0687908 |
| [36] |
S.K. Bhunia, L. Zeiri, J. Manna, S. Nandi, R. Jelinek, ACS Appl. Mater. Interfaces 8 (2016) 25637-25643. DOI:10.1021/acsami.6b10945 |
| [37] |
M.M.P. Arnob, F.S. Zhao, J.T. Li, W.C. Shih, ACS Photon. 4 (2017) 1870-1878. DOI:10.1021/acsphotonics.7b00239 |
| [38] |
F.S. Zhao, J.B. Zeng, M.M.P. Arnob, et al., Nanoscale 6 (2014) 8199-8207. DOI:10.1039/C4NR01645A |
| [39] |
T. Zhang, Y.Q. Sun, L.F. Hang, et al., ACS Appl. Mater. Interfaces 10 (2018) 9792-9801. DOI:10.1021/acsami.7b17461 |
| [40] |
T. Tanaka, A. Nakajima, A. Watanabe, T. Ohno, Y. Ozaki, J. Mol. Struct. 661 (2003) 437-449. |
| [41] |
K.L. Posey, M.G. Viegas, A.J. Boucher, et al., J. Phys. Chem. C 111 (2007) 12352-12360. DOI:10.1021/jp071833f |