 2019, Vol. 30


b CAS Key Laboratory of Chemistry of Northwestern Plant Resources and Key Laboratory for Natural Medicine of Gansu Province, Lanzhou Institute of Chemical Physics, Chinese Academy of Sciences, Lanzhou 730000, China
S1 endonucleases, a well-known multifunctional nuclease, can hydrolyze the phosphodiester bonds in single-stranded DNA or RNA [1-3]. The determination of S1 endonuclease activity is of great significance because it plays a vital role in biological processes and biotechnology. Numerous traditional approaches for the determination of S1 endonuclease have been used, such as radioactive labeling, polyacrylamide gel electrophoresis (PAGE), enzyme-linked immune sorbent assay (ELISA), and high-performance liquid chromatography (HPLC) [4-7], which suffer from isotope labeling, time-intensive, laborious, and cost-expensive. Therefore, it is still highly significant and desirable to develop efficient, low cost, rapid, and amenable approaches for assessing S1 endonuclease activity and screening for its potential inhibitors.
To overcome these limitations, a large number of detection approaches have been proposed in recent years, including fluorescence, microchip electrophoresis, electrochemistry, chemiluminescence, and colorimetry [8-17]. Among all these approaches fluorescent method has become an ever-growing and attractive means because of its simple manipulation, flexibility, fast analysis speed, and high sensitivity.
With the development of nanotechnology, nanostructures of noble metals have been used in various fields of chemistry due to their conspicuous optical and electrical properties. Especially, Ag nanorods (AgNRs) attracted tremendous interest owing to their anisotropic configuration and unique optical properties which are known to be dramatically affected by their shape, size, as well as surrounding surface environments. AgNRs, which are often used as the surface-enhanced Raman scattering (SERS) substrates or surface plasmon resonance (SPR) probes, have many potential applications in biological and chemical analysis including microRNA, 2-methylisoborneol, benzoyl peroxide, virus, and so on [18-24]. Owing to the excellent chemical properties and tunable absorption spectrum of the AgNRs, they may be used as a new kind of fluorescence quencher to construct FRET system.
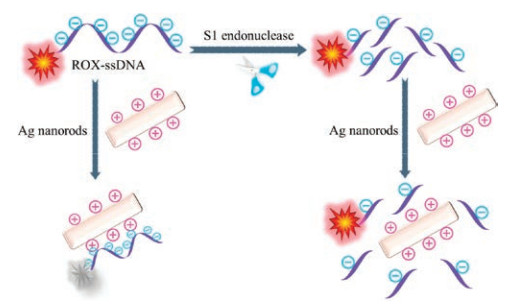
Inspired and encouraged by the above-mentioned properties, we established a fluorescence sensing platform for the determination of S1 endonuclease by positively-charged AgNRs-based FRET approach for the first time. As illustrated in Scheme 1, the attendant proximity of the negatively-charged dye-labeled ssDNA probe (ROX-ssDNA) to the positively AgNRs exhibits strong electrostatic interaction and efficient FRET, and then leads to fluorescence quenching of the ROX-ssDNA when a ROX-ssDNA mixed with AgNRs. However, if S1 endonuclease is introduced into the system, ROX-ssDNA was cleaved into mono- or short-oligonucleotides fragments, which resulted in the releasing of a short ROX-oligonucleotide fragment. Therefore, an increase in fluorescence was observed. It is mainly attribute to the reduced electrostatic interaction between short-oligonucleotide fragment and AgNRs, which decreased the FRET efficiency. By monitoring the change in fluorescence intensity, S1 endonucleases activity has been successfully investigated. In addition, this sensing platform has also been applied to study the inhibition of S1 endonuclease and S1 endonuclease detection from complex biological matrixes. Particularly, such approach does not require sophisticated operation and high cost, which exhibited excellent sensitivity and specificity toward S1 endonuclease. Meanwhile, this strategy might pave the way to use AgNRs as novel quenchers for more sensing systems.

|
Download:
|
| Scheme 1. Schematic illustration of the proposed approach for the analysis of S1 endonuclease activity by AgNRs and ROX-ssDNA. | |
AgNRs were prepared according to a previously reported paper with small variations [25-27]. The specific details of the preparation can be found in the electronic supplementary information. Subsequently, the prepared AgNRs were characterized by means of TEM, UV–vis absorption spectrum and zeta potential analysis. As presented in Fig. 1, AgNRs dimensions were estimated from TEM to be about 90 nm in length and about 48 nm in diameter (Fig. 1A). In addition, the AgNRs exhibit a transversal mode of 433 nm and a longitudinal mode of 607 nm (Fig. 1B). Furthermore, the zeta potential of AgNRs revealed net positive charges (zeta potential + 36.8 mV, Fig. S1 in Supporting information).

|
Download:
|
| Fig. 1. TEM image (A) and UV–vis spectrum (B) of the as-prepared AgNRs. | |
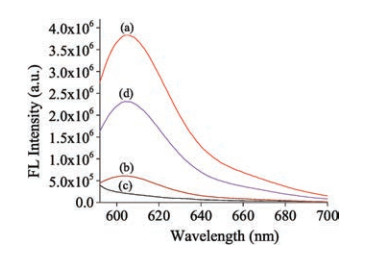
In order to illustrate the feasibility of our proposed FRET protocol, the fluorescence spectra under different experimental conditions were investigated. As displayed in Fig. 2, the system only containing ROX-ssDNA exhibited very strong fluorescence intensity at 603 nm (curve a). Upon the addition of AgNRs, the fluorescence of ROX-ssDNA had been significantly quenched (intensity at 603 nm decreased about 83.8%, curve b). Moreover, the mixture of AgNRs and S1 endonuclease showed little fluorescence (curve c). However, it had a significant recovery upon the addition of S1 endonuclease and ROX-ssDNA into AgNRs solution (curve d). This is because S1 endonuclease can hydrolyze ROX-ssDNA, and then released short-oligonucleotides fragments into the solution and detached from the AgNRs, led to the fluorescence restoration of this system. Thus, the proposed strategy can be used to analyze S1 endonuclease.

|
Download:
|
| Fig. 2. Fluorescence emission spectra of the present system at different experimental conditions. (a) 100 nmol/L ROX-ssDNA; (b) AgNRs + ROX-ssDNA (100 nmol/L); (c) AgNRs + S1 endonuclease (1.0 U/mL); (d) AgNRs + ROX-ssDNA (100 nmol/L) + S1 endonuclease (1.0 U/mL). | |
A series of experimental parameters such as the amount of AgNRs, the incubation time of ROX-ssDNA and AgNRs, and the oxidation cleavage time of S1 endonuclease were examined and optimized. The volume of AgNRs is a crucial parameter. As exhibited in Fig. S2 (Supporting information), the fluorescence intensity of the system before or after addition of S1 endonuclease decreased gradually with the increase of the amount of AgNRs. The result indicated that the optimum volume of Ag NRs used in this system was 20 mL based on the optimal signal-to-noise level. Fig. S3 (Supporting information) displayed the fluorescence quenching of ROX-ssDNA in the presence of AgNRs as a function of incubation time. It can be seen that the fluorescence signal significantly decreased as the incubation time increased from 0 min to 2 min, and a slow decrease over a period of 5 min. 10 min later, the fluorescence signal achieved the minimum value and remained stable with further increase of the incubation time. Therefore, 10 min was selected as the best incubation time. To achieve the best analytical performance, the oxidation cleavage time of S1 endonuclease was also optimized. As plotted in Fig. S4 (Supporting information), the fluorescence intensity of the system enhanced rapidly in the first 20 min, followed by a slow process over a period of 40 min. The optimal fluorescence restoration was obtained after 1.0 h incubation time. Thus, 1.0 h was chosen as the optimal oxidation cleavage time of S1 endonuclease for the following experiments.
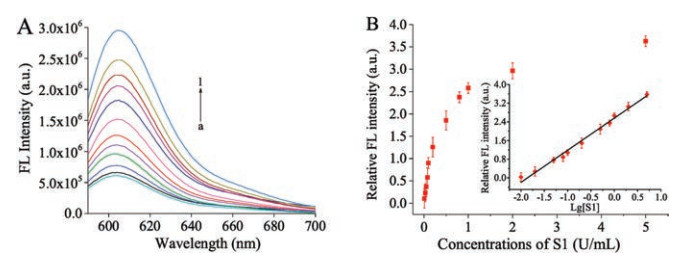
Under the above optimum conditions, we investigated the fluorescence intensity of the proposed strategy for S1 endonuclease at varying concentrations. Fig. 3A depicted the fluorescence response to the S1 endonuclease concentrations in the range from 0 U/mL to 5.0 U/mL. As expected, the fluorescence intensities of the system gradually increased at 603 nm with the increase of S1 endonuclease concentrations (Fig. 3B). The relative fluorescence intensity △F [△F = (F–F0)/F0] displayed a good linear correlation to the logarithm of the target S1 endonuclease concentration in the range of 0.01–5.0 U/mL (Fig. 3B inset), where FS and F stands for the fluorescence intensities of the system at 603 nm in the absence and presence of S1 endonuclease, respectively. The limit of detection (LOD) was estimated to be 0.004 U/mL at a signal-tonoise ratio (S/N) of 3, which is lower than other previously reported values (As shown in Table S1 in Supporting information [1, 28-32]). Assay reproducibility was also examined by investigating a standard solution of S1 endonuclease at 9 times. The RSD was found to be 3.8%

|
Download:
|
| Fig. 3. (A) Fluorescence emission spectra of this sensing system at various concentrations of S1 endonuclease (from a to l: 0, 0.01, 0.02, 0.05, 0.08, 0.1, 0.2, 0.5, 0.8, 1.0, 2.0 and 5.0 U/mL). (B) Relationship of the relative fluorescence intensity [(F–F0)/F0] at 603 nm of the system with the S1 endonuclease concentration. Inset shows the linear response of the assay system to the logarithm of the target S1 endonuclease concentration. Error bars show the standard deviation of three independent experiments. | |
Besides sensitivity, specificity is another crucial factor for a new proposed analytical strategy with potential applications in complex biological matrixes. Therefore, the specificity of the proposed sensing platform was verified by comparing the fluorescence intensity changes of samples containing S1 endonuclease (2.0 U/mL) or several kinds of common interfering proteins (40 U/mL), such as GOx, Dpan Ⅰ, DNase Ⅰ, Nt.BbvCI and BSA. As presented in Fig. 4, among all the proteins examined, only S1 endonuclease caused the significant fluorescence recovery of this system. In this case, the concentration of these control proteins was 20 times greater than that of the target S1 endonuclease. The above results clearly verified that the proposed strategy had extraordinary specificity for S1 endonuclease.

|
Download:
|
| Fig. 4. FL intensity of the system at 603 nm toward blank, GOx, Dpan Ⅰ, Nt.BbvCI, BSA, DNase Ⅰ and S1 endonuclease. The concentration of S1 endonuclease was 2.0 U/mL and the others were 40 U/mL. | |
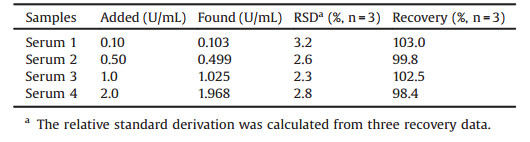
In order to further validate the proposed method in complex biological samples, spiked-recovery experiments with different concentrations of S1 endonuclease were conducted using human serum. The results presented in Table 1 show an acceptable accuracy and satisfactory recoveries in the range of 98.4%–103%, and the RSDs were between 2.3% and 3.2%. The above results confirmed that our proposed approach could provide a useful and promising tool for monitoring S1 endonuclease in complex biological samples.
|
|
Table 1 Results for the determination of S1 endonuclease in complex biological samples. |
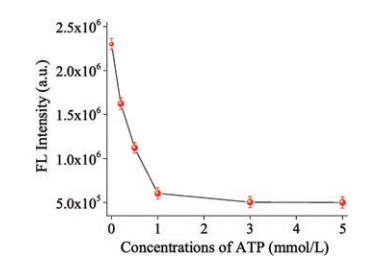
In this work, ATP was selected as the inhibitor to demonstrate the ability of the proposed optical sensor for screening the inhibitors of S1 endonuclease [33, 34]. Fig. 5 showed the fluorescence intensity changes of this method with various concentrations of ATP in the range of 0–5.0 mmol/L. It was found that the fluorescence emission intensity of AgNRs-ROX ssDNA-S1 endonuclease system decreased gradually when ATP existed. This result manifested that the cleavage reaction of ROX-ssDNA by S1 endonuclease was inhibited. Furthermore, it could be observed that the concentration of ATP to achieve minimum fluorescence intensity was about 1.0 mmol/L. Experimental results indicate that 1.0 mmol/L ATP can almost absolutely inhibit the cleavage reaction of ROX-ssDNA by S1 endonuclease. This phenomenon was further investigated by gel electrophoresis. The results were presented in Fig. S5 (Supporting information), lane 1 was the single band of ROX-ssDNA. When S1 endonuclease was added to the solution of ROX-ssDNA, the single band of ROX-ssDNA disappeared (lane 2), indicating S1 endonuclease can hydrolyze ROX-ssDNA. Lane 3 represented the mixture of the ROX-ssDNA/S1 endonuclease/ATP, there was one single band at the same migration position as that in lane 1, and the result fully demonstrated that the hydrolysis of ROX-ssDNA by S1 endonuclease was prohibited. Based on the above facts, our approach could be applied to evaluate S1 endonuclease inhibition, which provides a potential application in quantitative drug screening based on the S1 endonuclease inhibition, and may further be employed to screen other S1 endonuclease inhibitors by a simple way.

|
Download:
|
| Fig. 5. The influence of ATP on the activity of S1 endonuclease. Concentration of ATP is 0, 0.25, 0.5, 1.0, 3.0, and 5.0 mmol/L, respectively. | |
In summary, a simple, promising fluorescence strategy for the determination of S1 endonuclease activity and inhibition was established for the first time based on positively AgNRs and negatively-charged ROX-ssDNA. Significantly, such approach does not require sophisticated operation and high cost, which exhibited excellent sensitivity and high specificity toward S1 endonuclease Simultaneously, the proposed approach was applied to the detection of S1 endonuclease in complex biological matrixes with satisfactory results. Conceivably, this strategy might pave the way to use AgNRs as novel quenchers for more sensing systems.
AcknowledgmentsThe work was financially supported by the Promotion Project of Basic Ability of Young and Middle-aged Teachers of Universities in Guangxi (No. 2018KY0433) and the National Natural Science Foundation of China (Nos. 21822407, 21405163).
Appendix A. Supplementary dataSupplementary material related to this article canbefound, in the online version, at doi:https://doi.org/10.1016/j.cclet.2018.11.017
| [1] |
Z. Zhou, J. Zhu, L. Zhang, et al., Anal. Chem. 85 (2013) 2431-2435. DOI:10.1021/ac303440d |
| [2] |
J.L. Butour, A.M. Mazard, C. Vieussens, et al., Chem. Biol. Interact. 73 (1990) 195-205. DOI:10.1016/0009-2797(90)90003-6 |
| [3] |
S.C. West, Nat. Rev. Mol. Cell Biol. 4 (2003) 435-445. |
| [4] |
Sheridan Ⅲ R.B., P.C. Huan, Nucleic Acids Res. 4 (1977) 299-318. DOI:10.1093/nar/4.2.299 |
| [5] |
Y. Peng, X. Li, J. Ren, et al., Chem. Commun (2007) 5176-5178. |
| [6] |
A. Jeltsch, A. Fritz, J. Alves, et al., Anal. Biochem. 213 (1993) 234-240. DOI:10.1006/abio.1993.1415 |
| [7] |
L. McLaughlin, F. Benseler, E. Graeser, et al., Biochemistry 26 (1987) 7238-7245. DOI:10.1021/bi00397a007 |
| [8] |
L. Guo, Z. Zhang, Y. Tang, Chin. Chem. Lett. 29 (2018) 305-308. DOI:10.1016/j.cclet.2017.08.032 |
| [9] |
Z. Qing, X. He, T. Qing, et al., Anal. Chem. 85 (2013) 12138-12143. DOI:10.1021/ac403354c |
| [10] |
R. Cao, B. Li, Y. Zhang, et al., Chem. Commun. 47 (2011) 12301-12303. DOI:10.1039/c1cc15994a |
| [11] |
Z. Zhou, J. Zhu, L. Zhang, et al., Anal. Chem. 85 (2013) 2431-2435. DOI:10.1021/ac303440d |
| [12] |
X. Lou, Y. Xiao, Y. Wang, et al., ChemBioChem 10 (2009) 1973-1977. DOI:10.1002/cbic.v10:12 |
| [13] |
Y. Qin, J. Zhao, Y. Huang, et al., Anal. Methods 8 (2016) 1852-1857. DOI:10.1039/C5AY02831K |
| [14] |
Y. Qi, F.R. Xiu, S. Wang, et al., J. Lumin. 196 (2018) 306-312. DOI:10.1016/j.jlumin.2017.12.058 |
| [15] |
J. Ding, W. Qin, Biosens. Bioelectron. 47 (2013) 559-565. DOI:10.1016/j.bios.2013.03.066 |
| [16] |
Y. Cheng, J. Dai, C. Sun, et al., Angew. Chem. Int. Ed. 57 (2018) 3123-3127. DOI:10.1002/anie.201712803 |
| [17] |
X. Wang, J. Dai, X. Min, et al., Anal. Chem. 90 (2018) 8162-8169. DOI:10.1021/acs.analchem.8b01456 |
| [18] |
Z. Jiang, G. Wen, Y. Luo, et al., Sci. Rep 4 (2014) 5323. |
| [19] |
R. Botta, P. Eiamchai, M. Horprathum, et al., Sens. Actuator B.-Chem. 271 (2018) 122-127. DOI:10.1016/j.snb.2018.05.110 |
| [20] |
J.D. Driskell, R.A. Tripp, Chem. Commun. 46 (2010) 3298-3300. DOI:10.1039/c002059a |
| [21] |
S. Liu, X.D. Tian, Y. Zhang, et al., Anal. Chem. 90 (2018) 7275-7282. DOI:10.1021/acs.analchem.8b00488 |
| [22] |
S. Shanmukh, L. Jones, J. Driskell, et al., Nano Lett. 6 (2006) 2630-2636. DOI:10.1021/nl061666f |
| [23] |
J. Jiang, S. Zou, L. Ma, et al., ACS Appl. Mater. Interfaces 10 (2018) 9129-9135. DOI:10.1021/acsami.7b18039 |
| [24] |
H.Y. Wang, Y.A. Gao, M.W. Zhao, et al., Chin. Chem. Lett. 21 (2010) 872-875. DOI:10.1016/j.cclet.2010.01.036 |
| [25] |
L. Vigderman, E.R. Zubarev, Chem. Mater. 25 (2013) 1450-1457. DOI:10.1021/cm303661d |
| [26] |
X. Ye, C. Zheng, J. Chen, et al., Nano Lett. 13 (2013) 765-771. DOI:10.1021/nl304478h |
| [27] |
M. Tebbe, C. Kuttner, M. Mayer, et al., J. Phys. Chem. C 119 (2015) 9513-9523. DOI:10.1021/acs.jpcc.5b03155 |
| [28] |
Z. Liu, P. Hu, H. Zhao, et al., Anal. Chim. Acta 706 (2011) 171-175. DOI:10.1016/j.aca.2011.08.032 |
| [29] |
B. Shi, Y. Qin, M. Huang, et al., Anal. Methods 7 (2015) 5600-5605. DOI:10.1039/C5AY00743G |
| [30] |
Y. Zhang, Y. Wang, B. Liu, Anal. Chem. 81 (2009) 3731-3737. DOI:10.1021/ac802488m |
| [31] |
X. Yang, F. Pu, J. Ren, et al., Chem. Commun. (Camb.) 47 (2011) 8133-8135. DOI:10.1039/c1cc12216a |
| [32] |
Y. Xiao, F. Shu, K.Y. Wong, et al., Anal. Chem. 85 (2013) 8493-8497. DOI:10.1021/ac402125g |
| [33] |
J. Li, Q. Zhao, Y. Tang, Sensors 16 (2016) 865. DOI:10.3390/s16060865 |
| [34] |
P. Wrede, A. Rich, Nucleic Acids Res. 7 (1979) 1457-1467. DOI:10.1093/nar/7.6.1457 |