 2019, Vol. 30


In comparison with lithium, sodium has more advantages in plentiful resources, low cost, high half-cell potential and stable electrochemical performance [1, 2]. Thus, development of largescale application of room-temperature all-solid-state sodium ionic battery has exceedingly important significance [3-6]. The most interesting class of anode active materials are polyanionic framework type titanium phosphates such as TiP2O7, LiTi2(PO4)3, and NaTi2(PO4)3 [7-12]. These materials offer redox potentials in the desirable range (allowing for a high voltage cell), have high ionic conductivity, and relatively low costs of production. Of these materials, NaTi2(PO4)3 (NTP) with a theoretical capacity of 132.8 mA h/g, wide electrochemical window, and pronounced thermal stability [13-16].
Synthesis of NTP has been reported using sol-gel method, conventional solid-state route, hydrothermal route, etc. [10-15]. However, these methods involve high temperature (above 500 ℃) post-treatment. Therefore, a concise synthesis of NTP with controllability and higher ionic conductivity is of great significance.
In this work, we present an improved solvothermal synthesis of NTP nanocrystals with controlled size and aspect ratio of 0.7, as well as high ionic conductivity. Compared with the literature [16-18], our synthesis temperature is lower (140 ℃), and the reaction time is shorter (3 h). Meanwhile, the relationship between the size of NTP nanocrystals and reaction conditions were studied in detail, and a room-temperature ionic conductivity as high as 1.1 × 10⁻³ S/cm is achieved. The results suggest that our method is of great potential in synthesizing NTP nanocrystals at low cost.
The raw materials for synthesizing NTP nanocrystals include sodium acetate trihydrate (99.995% metals basis), titanium butoxide (≥98.0 wt%) and concentrated phosphoric acid (85wt%). Firstly, 2 mmol of sodium acetate trihydrate, 6 mL of concentrated phosphoric acid and 24 mL of anhydrous ethanol was added into a small beaker to dissolve completely by the ultrasonic cleaner. Then, 24 mL of anhydrous ethanol and 2 mmol of titanium butoxide were added into the big beaker by being stirred with a magnetic stirrer for 5 min. Furthermore, the solution containing titanium butoxidewas dropped intothe small beaker with constantlystirring, and the stirring speed should be controlled at 1000 rpm. When the color became lighter, the stirring speed was lower down to 800 rpm. The mixture needed 10 min to mix completely. If the mixing time wastoolong, there would be a small amount of sediment production. Then the mixture was transferred into a 100-mL teflon reactor, thereafter the reactor was placed in an oven for solvothermal reaction. Finally, the reactor was naturally cooled down to room temperature and the product were washed and collected by centrifugation method.
The crystalline structure of the NTP power was analyzed by a Bruker D8 polycrystalline X-ray diffractometer (XRD) (Cu Kα radiation λ = 1.5406 Å, Ni filter, 40 kV, 40 mA, 30 s for each step of 0.02°, 2θ in the range of 10°-80°). The chemical states of the surfaces of the samples were investigated by X-ray photoelectron spectroscopy (XPS) with the AXIS Nova 250 XPS at a pass energy of 50 eV (0.1 eV/step), using Alα as the exciting X-ray source. The spectra were calibrated with respect to the C 1s peak resulting from the adventitious hydrocarbon, which has an energy of 284.8 eV. The microstructure was observed using a JEM-2100 transmission electron microscope (TEM) at an accelerating voltage of 200 kV. Size distribution of particles was showed by a Zeta-PALS Dynamic light scattering. The AC impedance spectroscopy was performed on a CHI-660E electrochemical workstation at a frequency range of 0.01-105 Hz. The products were tested between two steel electrodes under a pressure of 20 MPa (thickness of 0.5 ± 0.07 mm, diameter of 1 cm).
Dense packing of NTP nanocrystals is benefit to ion transport. Theoretical studies have demonstrated that the packing density of ellipsoid particles reach highest when the aspect ratio is 0.7 [22-27]. The optimal reaction condition to obtain ellipsoidal NTP nanocrystals with controlled size and the aspect ratio was systematically studied by altering the reaction temperature and reaction time. First, keeping the reaction time of 3 h, the synthesis temperatures were chosen as 130 ℃, 135 ℃, 140 ℃, 145 ℃, 150 ℃ and 160 ℃, the corresponding samples were denoted as NTP-130- 3 h, NTP-135-3 h, NTP-140-3 h, NTP-145-3 h, NTP-150-3 h, and NTP-160-3 h, respectively. Then, varying reaction times from 2 h to 5 h with constant reaction temperature of 140 ℃, samples (NTP-140-2 h, NTP-140-2.5 h, NTP-140-3 h, NTP-140-4 h, and NTP- 140-5 h) were prepared.
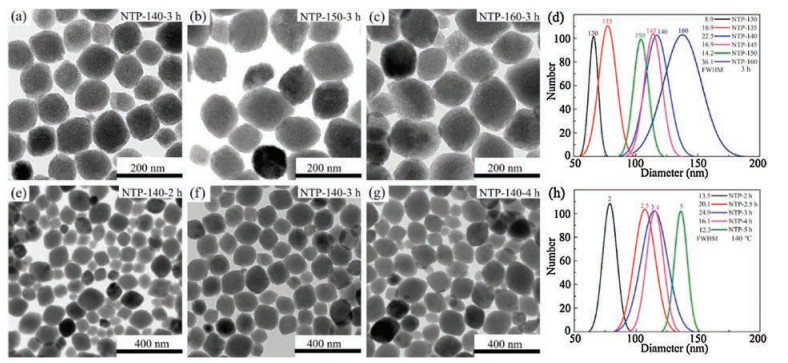
In Fig. 1, TEM images of the NTP nanocrystals reflect that the size of the NTP nanocrystals varies from 120 nm to 160 nm as the reaction temperature increasing from 140 ℃ to 160 ℃, as shown in Figs. 1a-c. Size distribution of particles was showed by a Zeta-PALS dynamic light scattering. The full width at half maximum (FWHM) of the size distribution of the NTP nanocrystals prepared at 130 ℃ for 3 h is the narrowest, and the uniformity of the particles is better under this condition (Fig. 1d), which is better than that of the literature [27-31]. As the reaction time (Figs. 1e-g) increase, the spectral peak of the particle distribution increases gradually. When the reaction temperature is constant at 140 ℃, the FWHM of the spectral of the NTP nanocrystals prepared at 140 ℃ for 3 h is the biggest (Fig. 1h), and the aspect ratios of all the NTP nanocrystals are the closest to 0.7 (Fig. 1f). The size and uniformity of the NTP nanocrystals can be controlled by adjusting the reaction conditions. Overall, by changing the reaction conditions, its morphology and size could be well controlled.

|
Download:
|
| Fig. 1. (a-c) TEM images of the NTP nanocrystals prepared at different temperatures (140-160 ℃) for 3 h. (d) Size distribution of the NTP nanocrystals prepared at different temperatures (130-160 ℃) for 3 h and the FWHM of the spectral of the NTP nanocrystals (8.9, 16.9, 22.5, 16.9, 14.2, 36.1). (e-g) TEM images of the NTP nanocrystals prepared at 140 ℃ for different times (2-4 h). (h) Size distribution of the NTP nanocrystals prepared at 140 ℃ for different times (2-5 h) and the FWHM of the spectral of the NTP nanocrystals (13.5, 20.1, 24.9, 16.1, 12.3). | |
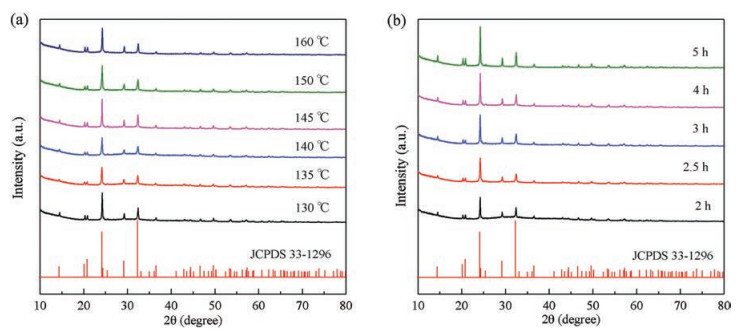
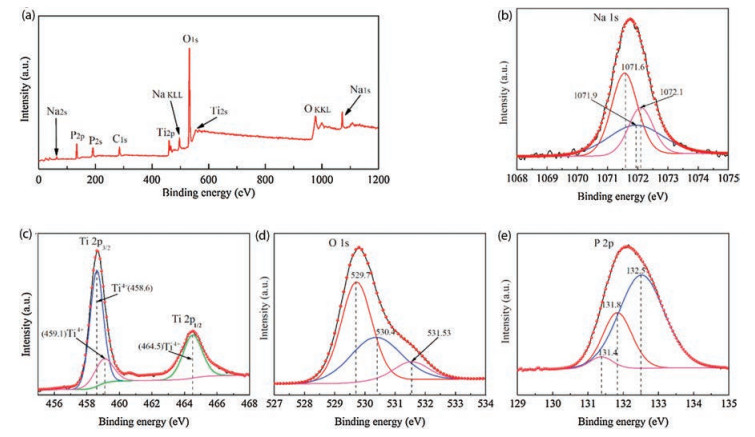
As shown in Fig. 2, all diffraction peaks match well with the standard diffraction peaks (JCPDS No. 33-1296) [19-21], illustrating that all the prepared samples have pure phases without any impurities. Fig. 3a shows a wide XPS survey of the reaction products. Looking at the detailed Ti 2p spectrum of the NTP nanocrystals, only Ti4+ is present. There are three peaks at 458.6 eV, 459.1 eV and 464.5 eV, which originate from titanium atoms at different crystalline sites in the NTP nanocrystals [29-33]. As depicted in Fig. 3c, the fitted energy difference between the Ti 2p1/2 and Ti 2p3/2 lines is approximately 5.9 eV, which somewhat corresponds to the reference value ΔE = 5.8 eV for Ti4+ [33-36]. As shown in Figs. 3b-e, the results of high-resolution XPS spectra of Na 1s, Ti 2p, O 1s, and P 2p imply that the prepared samples have pure NTP nanocrystals, which is consistent with the reported results [33-36].

|
Download:
|
| Fig. 2. XRD patterns of the NTP nanocrystals for samples prepared at different temperatures for 3 h (a) or at 140 ℃ for different times (b). | |

|
Download:
|
| Fig. 3. (a) Survey XPS spectra of the NTP nanocrystals. (b-e) High-resolution XPS spectra of Na 1s, Ti 2p, O 1s, and P 2p acquired from the NTP nanocrystals. The black line is the experimental line and the colored line is the simulated line. | |
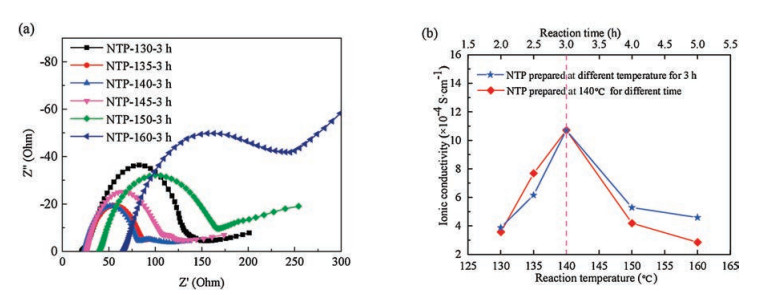
Fig. 4a gives the AC impedance spectroscopy of samples prepared at different temperatures for 3 h, and the AC impedance spectroscopy of samples prepared at 140 ℃ for different times and the calculation of ionic conductivity are given in Supporting information. The ionic conductivity of the sample was calculated and tested using the reported method [28, 29]. As shown in Fig. 4b, the ionic conductivity of samples prepared at different reaction conditions reveals that the most room-temperature ionic conductivity of the NTP nanocrystals prepared at 140 ℃ for 3 h is 1.1 ×10⁻³ S/cm, and its conductivity is the higher than that of 10-4 S/cm of the literature [29-36]. It implies a moderate sizedistribution of NTP nanocrystals (The aspect ratios of all the NTP nanocrystals are the closest to 0.7). obtained at 140 ℃ for 3 h is helpful for increasing packing density, and the packing density is the larger, so its conductivity is the higher.

|
Download:
|
| Fig. 4. (a) The AC impedance spectroscopy of samples prepared at different temperatures for 3 h. (b). Ionic conductivity of the NTP nanocrystals prepared at different temperatures for 3 h or for different times at 140 ℃. | |
In summary, NTP nanocrystals were synthesized by the concise solvothermal method. The NTP nanocrystals prepared at 140 ℃ for 3 h had pure phases without any impurities, and its roomtemperature ionic conductivity is of 1.1 × 10⁻³ S/cm. Its aspect ratio, size and morphology have been well controlled.
AcknowledgmentThis work was financially supported by the National Natural Science Foundation of China (Nos. 2016YFF0100901, 61274054 and 61504064).
Appendix A. Supplementary dataSupplementary material related to this article can be found, in the online version, at doi:https://doi.org/10.1016/jcclet.2018.06.020.
| [1] |
Y. Luo, Y. Tang, S. Zheng, et al., J. Mater. Chem. A 10 (2018) 4236-4259. |
| [2] |
X. Deng, Z. Wei, C. Cui, et al., J. Mater. Chem. A 9 (2018) 4013-4022. |
| [3] |
F. Díaz-González, A. Sumper, O. Gomis-Bellmunt, et al., Renew. Sust. Energy Rev. 16 (2012) 2154-2171. DOI:10.1016/j.rser.2012.01.029 |
| [4] |
B. Dunn, H. Kamath, J.M. Tarascon, Science 334 (2011) 928-935. DOI:10.1126/science.1212741 |
| [5] |
Z. Yang, J. Zhang, M.C. Kintner-Meyer, et al., Chem. Rev. 111 (2011) 3577-3613. DOI:10.1021/cr100290v |
| [6] |
L. Wang, Y.G. Sun, L.L. Hu, et al., J. Mater. Chem. A 18 (2017) 8752-8761. |
| [7] |
W. Wu, S. Shabhag, J. Chang, et al., J. Electrochem. Soc. 162 (2015) A803-A808. DOI:10.1149/2.0121506jes |
| [8] |
W. Wu, A. Mohamed, J.F. Whitacre, J. Electrochem. Soc. 160 (2013) A497-A504. DOI:10.1149/2.054303jes |
| [9] |
R.B. Shivashankaraiah, H. Manjunatha, K.C. Mahesh, et al., J. Electrochem. Soc. 159 (2012) A1074-A1082. DOI:10.1149/2.074207jes |
| [10] |
Y. Cui, Y. Hao, W. Bao, et al., J. Electrochem. Soc. 160 (2012) A53-A59. |
| [11] |
H. Wang, K. Huang, Y. Zeng, et al., Electrochim. Acta 52 (2007) 3280-3285. DOI:10.1016/j.electacta.2006.10.010 |
| [12] |
W. Wu, S. Shanbhag, A. Wise, et al., J. Electrochem. Soc. 162 (2015) A1921-A1926. DOI:10.1149/2.0071511jes |
| [13] |
S.H. Bo, Y. Wang, J.C. Kim, et al., J. Mater. Chem. A 4 (2016) 9044-9053. DOI:10.1039/C6TA03027K |
| [14] |
H.Y.P. Hong, Mater. Res. Bull. 2 (1976) 173-182. |
| [15] |
S.A.N.M.A. Moshareva, A.B. Yaroslavtsev, Inorg. Mater. 52 (2016) 1283-1290. DOI:10.1134/S0020168516120074 |
| [16] |
C. Wu, P. Kopold, Y.L. Ding, et al., ACS Nano (2015) 6610-6618. |
| [17] |
H. Kabbour, D. Coillot, M. Colmont, et al., J. Am. Chem. Soc. 133 (2011) 11900-11903. DOI:10.1021/ja204321y |
| [18] |
Y. Yue, W. Pang, Mater. Res. Bull. 25 (1990) 841-844. DOI:10.1016/0025-5408(90)90060-F |
| [19] |
R. Velchuri, B.V. Kumar, V.R. Devi, et al., Int. J. Nanotechnol. 7 (2010) 1077-1086. DOI:10.1504/IJNT.2010.034712 |
| [20] |
E.A. Asabina, V.I. Pet'kov, A.R. Kotel'nikov, et al., Russ. J. Inorg. Chem. 51 (2006) 1167-1175. DOI:10.1134/S0036023606080043 |
| [21] |
W.X. Xu, H.S. Chen, Z. Lv, Physica A 390 (2011) 2452-2467. DOI:10.1016/j.physa.2011.02.048 |
| [22] |
S. Tong, Master Thesis, Computer Simulation and Property Analysis of Random Close Packing Algorithm of Unequal Ellipses, Tianjin University, 2012, pp. 1-66.
|
| [23] |
X. Jia, R.A. Williams, Powder Technol. 120 (2001) 175-186. DOI:10.1016/S0032-5910(01)00268-6 |
| [24] |
S.P. Armes, M. Aldissi, Polymer 31 (1990) 569-574. DOI:10.1016/0032-3861(90)90404-M |
| [25] |
G.C. Barker, M. Grimson, New Sci. 126 (1990) 37-40. |
| [26] |
D.P. Haughey, G.S.G. Beveridge, Can. J. Chem. Eng. 47 (1969) 130-140. DOI:10.1002/cjce.v47:2 |
| [27] |
A. Rosato, K.J. Strandburg, F. Prinz, et al., Phys. Rev. Lett. 58 (1987) 1038-1043. DOI:10.1103/PhysRevLett.58.1038 |
| [28] |
G.B. Xu, L.W. Yang, X.L. Wei, et al., J. Power Sources 327 (2016) 580-590. DOI:10.1016/j.jpowsour.2016.07.089 |
| [29] |
C. Xu, Y. Xu, C. Tang, et al., Nano Energy 28 (2016) 224-231. DOI:10.1016/j.nanoen.2016.08.026 |
| [30] |
Y. Fang, L. Xiao, J. Qian, et al., Adv. Energy Mater. 6 (2016) 1-8. |
| [31] |
D. Sun, G. Jin, Y. Tang, et al., J. Electrochem. Soc. 163 (2016) A1388-A1393. DOI:10.1149/2.1181607jes |
| [32] |
D. Xu, P. Wang, R. Yang, Ceram. Int. 44 (2018) 7159-7164. DOI:10.1016/j.ceramint.2018.01.160 |
| [33] |
M. Li, L. Liu, P. Wang, et al., Electrochim. Acta 252 (2017) 523-531. DOI:10.1016/j.electacta.2017.09.020 |
| [34] |
H.K. Roh, H.K. Kim, M.S. Kim, et al., Nano Res. 9 (2016) 1844-1855. DOI:10.1007/s12274-016-1077-y |
| [35] |
D. Capsoni, M. Bini, S. Ferrari, et al., J. Phys. Chem. C 114 (2010) 13872-13878. |
| [36] |
G. Xu, Z. Li, X. Wei, et al., Electrochim. Acta 254 (2017) 328-336. DOI:10.1016/j.electacta.2017.09.121 |