 2019, Vol. 30


The direct synthesis of dimethyl carbonate (DMC) from CO2 and methanol over the CeO2 catalyst has attracted wide attention because of its implications in CO2 utilization and sustainable development [1]. However, the DMC yield is far from satisfactory due to the thermodynamics of the reaction, which is generally unfavorable owning to equilibrium limitation. According to the previous study [2, 3], 2-cyanopyridine (2-CP) can act as efficient dehydration agent by in situ hydrolysis, leading to the improvement of methanol conversion and DMC yield. Meanwhile, in terms of commercialization requirements and atom economy, it is also desirable for the recyclability of the 2-cyanopyridine by dehydrating 2-picolinamide (2-PA) back to 2-cyanopyridine.
As for the dehydration of primary amides to nitriles, classical dehydrating agents such as acidic (e.g., P2O5, POCl3, SOCl2) [4-6] and basic reagents (e.g., NaBH4) [7] are known to be effective. In addition to these dehydrating agents, many catalysts have also been reported to be applied for dehydration of amides to nitriles. For example, Stephan Enthaler reported various homogeneous catalysts such as Cu [8], Zn [9] and Fe ion for dehydration of amides to nitriles [10]. On the other hand, Kiyotomi Kaneda proposed V/HT catalyst [11] and Noritaka Mizuno applied lacunary silicotungstate as the efficient heterogeneous catalysts for the dehydration of amides [12].
However, there have been few papers reported on the dehydration of 2-picolinamide to 2-cyanopyridine [3, 9, 13-15]. Moreover, in most of these work, excess amount of dehydrating agents which are expensive and nonrenewable have been used for the dehydration of 2-picolinamide to 2-cyanopyridine, such as ethyl dichlorophosphate [13], N-methyl-N-(trimethylsilyl) trifluoroacetamide [9], trifluoromethane sulfonic acid anhydride and trimethylamine [14]. Although there was a report on U ion catalyzing the dehydration of 2-cyanopyridine, it has inevitably utilized dehydrating agents [15]. If catalytic dehydration of 2-picolinamide could be performed without any additives, it would be a green procedure for 2-cyanopyridine synthesis due to its high atom efficiency (only water is formed as a byproduct).
In this work, silica supported potassium oxide acting as a heterogeneous catalyst was developed for the dehydration of 2-picolinamide to produce 2-cyanopyridine without any additives. The effect of catalyst preparation conditions on the catalytic activity was studied. XRD and FT-IR was employed to clarify the active sites of the catalyst. To gain the further insight into the importance of Si-OH to the formation of the active species, the adjustment of the amount of Si-OH was carried out by silylation and hydroxylation procedure.
The K2O/SiO2 catalyst was prepared by incipient wetness impregnation method. SiO2 (A), SiO2 (B) and SiO2 (C) with the different specific surface area and the pore size distribution were adopted as the supports, respectively. Before being impregnated with potassium carbonate, the commercially available silica supports were heated at 700 ℃ in order to dehydroxylate hydrogen-bonded Si-OH to obtain more free Si-OH group. Then an aqueous solution of K2CO3 was slowly added to the support, with rapid stirring at room temperature. Different loadings were achieved by adjusting the amount of K2CO3. After being evaporated and dried at 110 ℃ for 12 h, the catalyst was then calcined in air at various temperatures for 3 h. The sections of silica surface modification, catalyst characterization and activity tests are presented in Supporting information.
Three kinds of silica were employed as the supports. Fig. S1 (Supporting information) gives the N2 adsorption–desorption isotherms and pore-size distribution of the different supports. For the mesoporous and microporous supports, the pore sizes were calculated from the desorption branch of the isotherm using the BJH model and HK model, respectively. The specific surface areas were calculated by Barrett-Emmett-Teller (BET) equation. As illustrated in Fig. S1a (Supporting information), the type IV patterns of the adsorption curves of SiO2 (B) and SiO2 (C) suggested the typical hysteresis loop of mesoporous materials according to the classification of the International Union of Pure and Applied Chemistry (IUPAC) [16]. For SiO2 (A), at the low pressure, the adsorption–desorption curves showed the existence of microporous structure. The pore size distribution in Fig. S1b (Supporting information) verified the different mesopore sizes and micropore sizes for these three kinds of silica [17, 18]. SiO2 (A) and SiO2 (B) had a narrow Gaussian-like unimodal pore size distribution. Nevertheless, SiO2 (C) showed a broad distribution.
The pore diameter, specific surface area and pore volume of the different supports were listed in Table S1 (Supporting information). As it showed, the average pore diameters of SiO2 (A), SiO2 (B) and SiO2 (C) were 1.1, 5.5 and 8.7 nm, respectively. And the specific surface areas of SiO2 (A), SiO2 (B) and SiO2 (C) were 479, 578 and 330 m2/g. The specific surface area decreased in the order SiO2 (B) >SiO2 (A) >SiO2 (C). The order of pore size was as following: SiO2 (C) >SiO2 (B) >SiO2 (A). Table S2 (Supporting information) listed the textural information of 0.8 K/SiO2 (B) catalyst calcined at different temperature. As calcination temperature increased, the pore diameter increased and the specific area decreased dramatically.
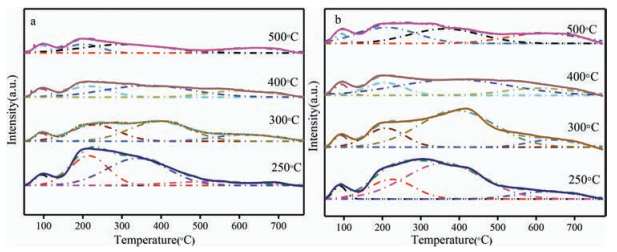
As shown in Fig. 1a, He-TPD was performed to examine the amount of residual K2CO3 of the 0.8 K/SiO2 (B) catalysts calcined at different temperatures, which was induced by the slow decomposition rate of the catalysts [19]. CO2-TPD was employed to evaluate the basicity of the samples calcined at different temperatures as illustrated in Fig. 1b. It was noted from Fig. 1b that, desorption peaks were divided into four parts. Peak 1 at around 100 ℃ corresponded to the physical adsorption of CO2. Peak 2 centered at approximately 200 ℃ was attributed to weak basicity of SiO2 (B) [20, 21]. The peaks at around 400 ℃ and 650 ℃, denoted as peak 3 and peak 4, respectively, were attributed to medium and strong basicity. Peak 3 was derived from reactions of basic species with siliceous supports while peak 4 originated from the production of K2O caused by the decomposition of bulk phase of K2CO3 [22].

|
Download:
|
| Fig. 1. (a) He-TPD profiles of the samples calcined at different temperatures, (b) CO2-TPD profiles of the samples calcined at different temperatures. | |
However, in light of the slow decomposition rate of the 0.8 K/SiO2 (B) catalysts, the catalysts calcined at different temperatures may not decompose completely after calcination. Furthermore, as Yamaguchi reported [18], supported K2CO3 can release CO2 at around 400 ℃ and 750 ℃ which were close to the positions of peak 3, and peak 4 of CO2-TPD. Therefore, it indicated that when calculating the amounts of medium basicity and strong basicity of the catalysts, the amount of CO2 produced by the decomposition of loaded K2CO3 should be subtracted. Hence, decomposition peaks in Fig. 1(a) were divided into four parts in accordance with Fig. 1(b) in order to calculate the amount of basicity. For the peak at around 650 ℃, denoted as peak 4 in Fig. 1a, it corresponded to the decomposition of the bulk phase of K2CO3 [19]. Moreover, for the two temperature branches from 200 ℃ to 500 ℃, denoted as peak 2 and peak 3, CO2 was produced by the reaction between K2CO3 and Si-OH which gave rise to the medium basic sites [22]. The peak centered at 100 ℃ was assigned to weak adsorption interaction between CO2 and the catalyst.
The data of He-TPD and CO2-TPD were demonstrated in Table S3 (Supporting information). The basicity was calculated by eqs. (1) and (2) assuming that the peak area of CO2 desorption peak in CO2-TPD was proportional to the basicity amount. As calcination temperature increased from 250 ℃ to 500 ℃, the total peak area of peak 2 and peak 3 and peak 4 in Fig. 1a decreased which means the catalysts were decomposed more completely. Meanwhile, when the calcination temperature increased from 250 ℃ to 300 ℃, the amount of medium basic sites of Fig. 1b increased because of more K2CO3 reacting with Si-OH. Nevertheless, when it increased from 300 ℃ to 500 ℃, the medium basicity decreased. As mentioned in Fig. 1a, reaction of potassium carbonates species with siliceous supports proceeded from 200 ℃ to 300 ℃ to form medium basicity, while above 300 ℃ more potassium carbonates decomposed into potassium oxide contributing to the increase of the amount of strong basicity. Hence, when the calcination temperature was above 300 ℃, more potassium carbonates were decomposed into potassium oxide instead of reacting with Si-OH contributing to the medium basicity. Therefore, the catalyst calcined at 300 ℃ had the maximum medium basic sites. When the calcination temperature was higher than 300 ℃, the amounts of medium basicity decreased.
In order to identify the nature of active sites, the catalysts were characterized in depth. Fig. 2 displays the XRD patterns of the SiO2 (B) supported potassium oxide catalysts with different loadings. The sample loading K of 0.8 mmol/g had the same XRD patterns as the parent amorphous silica, and neither any characteristic peaks of K2CO3 (JCPDS No. 16-0820) nor any new phase such as K2O (JCPDS No. 26-1327) was noticed, indicative of finely dispersed active sites on SiO2. When the loading amount of K increased to 5.1 mmol/g, characteristic peak of K2CO3 was observed and the new phase attributed to potassium silicate (Si—O—K) (JCPDS No. 49-0163) appeared. It is likely that on the surface of fully hydroxylated silica, K+ ions replaced the protons of isolated hydroxyl groups to form Si—O—K groups (K2CO3 + 2Si-OH→ 2Si—O—K + H2O + CO2) [22-24], which was considered to be the active basic species.

|
Download:
|
| Fig. 2. XRD patterns of the K2O/SiO2 catalysts with different loading amounts. | |
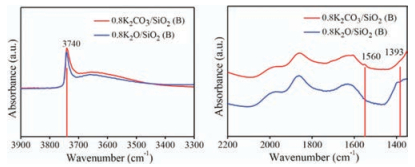
Fig. 3 shows the comparison of FT-IR spectrum of 0.8 K2CO3/ SiO2 (B) (without calcination) and 0.8 K2O/SiO2 (B) (calcined at 300 ℃ for 3 h). The existence of the vibration band centered at 3740 cm-1 in the FT-IR spectrum implied that the K2CO3/SiO2 (B) sample possessed abundant free OH groups [25]. And the band at 3650 cm-1 was assigned to non-linearly H bonded vicinal OH groups [26]. The band at 1560 cm-1 referred to the bidentate carbonate species [23]. Obviously, weakened vibration band of free OH groups was observed for K2O/SiO2 (B) after calcination. Meanwhile, the decomposition of carbonate occurred with the disappearance of the band at 1560 cm-1 for K2O/SiO2 (B). On the other hand, it was noted that the band at 1393 cm-1 appeared. It may be attributed to the newly generated Si—O—K group of potassium silicate, which may be the active species. It indicated Si—O—K was formed by the reaction between K2CO3 and free silanol group on silica surface. In a word, Si-OH played crucial role in the formation of Si—O—K. This point will be further discussed with the surface modification of the support.

|
Download:
|
| Fig. 3. FT-IR spectra of different samples. | |
The series of catalysts were tested in dehydration of 2- picolinamide to produce 2-cyanopyridine. Fig. S2 (Supporting information) shows the effect of the loading amount of K2CO3 on the yield of 2-CP. Obviously, the optimum K loading amount was found to be 0.8 mmol/g. Initially, the yield increased notably with increasing K loading amount from 0.3 mmol/g to 0.8 mmol/g. About 20.4% yield of 2-CP was observed for 0.8 K/SiO2 (B) at 10 h. However, further increase of K to 2.0 mmol/g lowered the yield of 2-CP. It is probable that for finely dispersed K2CO3 on silica support, the interaction between K2CO3 and the surface of support weakens the combination of K+ and CO32- ions, which is helpful to the decomposition of K2CO3 and further formation of Si—O—K active sites [27]. At low loading of K2CO3, the active basic sites were more finely dispersed on the silica surface but the amount of active sites was limited, resulting in rather low catalytic activity of 0.3 K/SiO2 (B). Thus, with the increase in the loading amount of K2CO3, the amount of active sites also increased, contributing to the improvement of the yield of 2-CP for 0.8 K/SiO2 (B). However, with excess K2CO3 loaded, the K2CO3 may not be dispersed well on silica and, consequently, a part of the loaded K2CO3 could not be decomposed after calcination. More importantly, the excess K2CO3 could cover the active base sites. And for this reason, catalytic activity was lowered with further increase in the loading amount of K2CO3. It is suggested that only a fraction of the fairly well dispersed K2CO3 species favors the dehydration of 2-PA. Therefore, based on the superior catalytic activity, 0.8 mmol/g was found to be the optimum K loading amount.
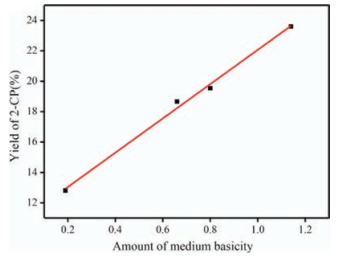
Particularly, the effect of calcination temperature on the 0.8 K/SiO2 (B) catalyst activity was also investigated in depth. As depicted in Fig. S3 (Supporting information), the catalyst calcined at 300 ℃ reached the best performance of 23.6%. When the calcination temperature was higher than 300 ℃, the catalyst activity decreased. Although the catalysts calcined at 250 ℃ and 300 ℃ had almost the same specific area and pore diameter as illustrated in Table S2 (Supporting information), the catalyst calcined at 300 ℃ had better performance. Hence, it can be deduced that there was other factor determining the catalyst activity. Remarkably, the yield of 2-CP showed linear relationship with amounts of medium basicity expressed by the peak area determined by CO2-TPD as shown in Fig. 4, indicating that the medium basic sites derived from Si—O—K which was produced by the reactions of loaded K2CO3 with siliceous supports were the active sites. Therefore, the uniquely high catalytic activity of the catalyst calcined 300 ℃ originated from the maximum medium basicity of the catalyst.

|
Download:
|
| Fig. 4. The linear relationship between the amount of medium basicity and catalyst activity. | |
In order to further clarify the importance of Si-OH to the formation of active species, the surface modification of SiO2 was performed to alter the amount of Si-OH. The silylation and hydroxylation of SiO2 (B) were employed to reduce and increase the amount of silanol groups, respectively. As Table S5 (Supporting information) shows, the activity of the catalysts 0.8 K/Sil-SiO2 (B) was lowered than that of 0.8 K/SiO2 (B) whereas the performance of 0.8 K/SiO2 (B)-OH increased to 26.3%.
It was also noted from Table S5 (Supporting information) that the changes in pore diameter and specific surface area of the 0.8 K/SiO2 (B)-OH catalyst were negligible compared to 0.8 K/SiO2 (B), whereas the specific surface area of 0.8 K/Sil-SiO2 (B) was much larger. It is likely that the silylation of SiO2 (B) prevented the reaction between K2CO3 and Si-OH and avoided the structure collapse of SiO2 (B) [20].
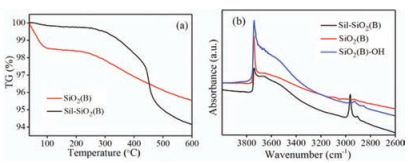
Fig. 5b shows the FT-IR spectra of different supports in the range of 4000–2600 cm-1. For silylated silica, a new adsorption band appears at 2960 cm-1 corresponding to the C-H stretching vibration. It implies -CH3 was covalently bonded to silica particles [28]. Moreover, the Si-OH adsorption band at 3740 cm-1 which was of importance to the formation of active species weakened, indicating the reaction between Si-OH and HMDS on the surface of SiO2 (B) occurred [25]. It was proved that the free Si-OH decreased, which was induced by the silylation of SiO2 (B). For hydroxylated silica, comparatively, it is obvious that Si-OH adsorption band at 3740 cm-1 increased dramatically [29], indicating the increase of the amount of free Si-OH.

|
Download:
|
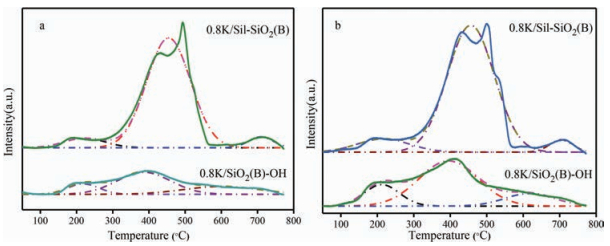
| Fig. 5. (a) TG curves of different supports, (b) FT-IR spectra of different supports. | |
Fig. 5a shows the weight loss curves of the as-synthesized silylated SiO2 (B) sample. The thermal stability and surface group of the silica were tested in the range of 40 ℃ to 600 ℃. The sample started to lose weight dramatically from 450 ℃ to 500 ℃ which corresponded to the oxidation of surface Si–CH3 groups [30], which is in concordance with the result of FT-IR.
Fig. 6 shows the He-TPD and CO2-TPD results of 0.8 K/sil-SiO2 (B) and 0.8 K/SiO2 (B)-OH catalysts. The same calculation method as mentioned above was employed to evaluate the medium basicity. The peak areas of medium basicity for 0.8 K/sil-SiO2 (B) and 0.8 K/SiO2 (B)-OH were 0.22 and 1.22, respectively. Therefore, it can be deduced that the amount of Si-OH affected the amount of medium basicity of the catalysts. For hydroxylated silica, the free silanol increased causing the increased medium basicity which contributed to the higher catalyst activity. For silylated silica, the decreased Si-OH led to the fewer medium basicity and lower catalyst activity. It can be concluded that the surface Si-OH reacted with K2CO3 to form the active species Si—O—K. The catalyst performance was directly related to the amount of free silanol.

|
Download:
|
| Fig. 6. (a) He-TPD profiles of different samples, (b) CO2-TPD profiles of different samples. | |
In conclusion, silica loaded with potassium carbonate was demonstrated to be a medium solid-base catalyst for the dehydration of 2-picolinamide to form 2-cyanopyridine. The catalyst prepared by loading 0.8 mmol/g K on SiO2 (B) after calcination at 300 ℃ for 3 h was found to be the optimum catalyst, which can give the highest medium basicity and the best catalytic activity reaching 23.6% yield of 2-CP. The catalytic activities of the catalysts showed a striking correlation with their corresponding amounts of medium basic sites. The decomposition products of the loaded K2CO3 were either K2O species or Si—O—K group in the composite. Si—O—K group acting as medium basicity was probably the active basic sites for dehydration of 2-picolinamide to 2-cyanopyridine. The adjustment of the amount of Si-OH by silylation and hydroxylation procedure provided further evidence that Si—O—K was the active species. For hydroxylated silica, the medium basicity increased with the increase of free silanol which contributed to the higher catalyst activity. For silylated silica, the decreased Si-OH led to the fewer medium basicity and hence lower catalyst activity.
AcknowledgmentFinancial support from the National Natural Science Foundation of China (NSFC Nos. 21176179, U1510203, 21325626) is gratefully acknowledged.
Appendix A. Supplementary dataSupplementary data associated with this article can be found, in the online version, at https://doi.org/10.1016/j.cclet.2018.04.012.
| [1] |
B. Liu, C. Li, G. Zhang, L. Yan, Z. Li, New J. Chem. 41 (2017) 12231-12240. DOI:10.1039/C7NJ02606D |
| [2] |
S.P. Wang, J.J. Zhou, S.Y. Zhao, Y.J. Zhao, X.B. Ma, Chin. Chem. Lett. 26 (2015) 1096-1100. DOI:10.1016/j.cclet.2015.05.005 |
| [3] |
M. Honda, M. Tamura, Y. Nakagawa, et al., ChemSusChem 6 (2013) 1341-1344. DOI:10.1002/cssc.201300229 |
| [4] |
R.E. Kent, S.M. McElvain, Org. Synth. 25 (1945) 61-62. DOI:10.15227/orgsyn.025.0061 |
| [5] |
D.T. Mowry, Chem. Rev. 42 (1948) 189-283. DOI:10.1021/cr60132a001 |
| [6] |
D.B. Reisner, E.C. Horning, Org. Synth. 30 (1950) 22-23. DOI:10.15227/orgsyn.030.0022 |
| [7] |
J.A. Krynitsky, H.W. Carhart, Org. Synth. 32 (1952) 65-67. DOI:10.15227/orgsyn.032.0065 |
| [8] |
S. Enthaler, M. Weidauer, Catal. Lett. 141 (2011) 1079. DOI:10.1007/s10562-011-0660-9 |
| [9] |
S. Enthaler, S. Inoue, Chem. Eur. J. 7 (2012) 169-175. |
| [10] |
S. Enthaler, Eur. J. Org. Chem. 2011 (2011) 4760-4763. |
| [11] |
S. Sueoka, T. Mitsudome, T. Mizugaki, K. Jitsukawa, K. Kaneda, Chem. Commun. 46 (2009) 8243-8245. |
| [12] |
S. Itagaki, K. Kamata, K. Yamaguchi, N. Mizuno, ChemCatChem 5 (2013) 1725-1728. DOI:10.1002/cctc.v5.7 |
| [13] |
C.W. Kuo, J.L. Zhu, J.D. Wu, et al., Chem. Commun. 3 (2007) 301-303. |
| [14] |
J.K. Rhee, J.I. Lim, W.B. Im, J.N. Yang, Bull. Korean Chem. Soc. 14 (1993) 301-302. |
| [15] |
S. Enthaler, J. Chem. Eur. 17 (2011) 9316-9319. DOI:10.1002/chem.v17.34 |
| [16] |
Z. Huang, W. Bensch, W. Sigle, et al., J. Mater. Sci. 43 (2008) 244-253. DOI:10.1007/s10853-007-2173-x |
| [17] |
F.J. Brieler, M. Fröba, L. Chen, et al., Chem. Eur. J. 8 (2002) 185-194. |
| [18] |
C. Lastoskie, K.E. Gubbins, N. Quirke, J. Phys. Chem. 97 (1993) 4786-4796. DOI:10.1021/j100120a035 |
| [19] |
T. Yamaguchi, Y. Wang, M. Komatsu, M. Ookawa, Catal. Surv. Jpn. 5 (2002) 81-89. DOI:10.1023/A:1015108902323 |
| [20] |
Z.Y. Wu, Q. Jiang, Y.M. Wang, et al., Chem. Mater. 18 (2006) 4600-4608. DOI:10.1021/cm0608138 |
| [21] |
X. Liu, L. Li, X. Song, et al., Catal. Lett. 146 (2016) 1910-1916. DOI:10.1007/s10562-016-1832-4 |
| [22] |
L. Zhu, F. Lu, X.D. Liu, X.Q. Liu, L.B. Sun, Chem. Commun. 51 (2015) 10058-10061. DOI:10.1039/C5CC02502H |
| [23] |
D.M. Alonso, R.M. Moreno-Tost, M.D.Z. Poves, M.L. Granados, Catal. Commun. 8 (2007) 2074-2080. DOI:10.1016/j.catcom.2007.04.003 |
| [24] |
K. Wang, J. Jiang, X. Liang, Ind. Crop. Prod. 92 (2016) 127-135. DOI:10.1016/j.indcrop.2016.07.036 |
| [25] |
X.S. Zhao, G.Q. Lu, A.K. Whittaker, G.J. Millar, H.Y. Zhu, J. Phys. Chem. B 101 (1997) 6525-6531. DOI:10.1021/jp971366+ |
| [26] |
P. Hoffmann, E. Knözinger, Surf. Sci 188 (1987) 181-198. DOI:10.1016/S0039-6028(87)80150-4 |
| [27] |
W. Xie, H. Peng, L. Chen, Appl. Catal. A 300 (2006) 67-74. DOI:10.1016/j.apcata.2005.10.048 |
| [28] |
Y. Yuan, Y. Chen, W.L. Chen, R.J. Hong, Sol. Energy 118 (2015) 222-231. DOI:10.1016/j.solener.2015.04.044 |
| [29] |
J. Köhler, J.J. Kirkland, J. Chromatogr. A 385 (1987) 125-150. DOI:10.1016/S0021-9673(01)94628-X |
| [30] |
A.P. Rao, A.V. Rao, G.M. Pajonk, Appl. Surf. Sci. 253 (2007) 6032-6040. DOI:10.1016/j.apsusc.2006.12.117 |