 2019, Vol. 30


b State Key Laboratory of Precision Measurement Technology and Instruments, Department of Precision Instrument, Tsinghua University, Beijing 100086, China;
c Center for Imaging and Systems Biology, Minzu University of China, Beijing 100081, China
Mass spectrometry imaging (MSI) is a powerful tool that enables untargeted investigation into the spatial distribution of molecular species in a variety of samples [1]. MSI can present the spatial distribution and signal intensity of a wide array of analytes ranging from small molecules such as lipids, amino acids, organic acids and drugs to big proteins [2-11] in one scan [12]. Until now, MSI was used primarily in various biomedical research areas like oncology, neurological disorders, cardiology and rheumatology [13-16].
Currently, unique MSI techniques are successfully implemented on many kinds of mass analyzers, including ion trap, quadrupole (Q), time of flight (TOF), Fourier transform ion cyclotron resonance (FT-ICR), orbitrap and their tandem forms. The first-mover advantage of matrix-assisted laser desorption/ionization (MALDI)-TOF-MSI in the development process of MSI technology makes TOF a common technique. On the other hand, the invention of ambient ionization simplified the sample preparation process [9, 17, 18] and enabled MSI to be used under atmospheric pressure and ambient conditions on mass spectrometers with an atmospheric pressure interface. Our group previously used MSI analysis by combining an imaging platform based on air flow-assisted desorption electrospray ionization mass spectrometry imaging (AFADESI) [19, 20] technology with mass spectrometers like TOF (AccuTOF CS, JMS-T100CS, JEOL), Q-TRAP (QTRAP 5500, AB Sciex), and Q-TOF (Qstar Elite, AB Sciex) [21]. With these platforms, we obtained rich drug distribution information from an image of the whole-body section [18], realized fast, real-time mass spectrometry analysis of unknown tablets added in illegal fodder [22], and established methods to precisely diagnose breast cancer [23] and lung cancer [24], hoping to provide nearly real-time information to guide surgical resections and rapid pathology diagnosis for clinical inspection.
The recently developed mass analyzer orbitrap achieved the collection and analysis of molecules by rotating and oscillating them around an axial electrode with an electrostatic field. After detecting the frequency of harmonic oscillations proportional to (m/z)-1/2, the individual mass-to-charge (m/z) value was transformed using fast FT. The adjustable resolution higher than 140, 000 was demonstrated on common commercial mass spectrometers [25, 26], along with wide mass range [27]. Benefiting from these advantages, this type of instrument was already applied to MSI analysis [28-31].
In this study, a high-performance MSI platform was constructed and characterized on a high-resolution Q-Orbitrap mass spectrometer connected with an AFADESI ion source through a modified interface. High-quality MSI analysis of bio-tissue was achieved with systematically optimized parameters.
Experimental conditions such as chemical reagents, sample preparation, employed instruments and details of AFADESI-MSI analysis are given in Supporting information. Specially, the schematic chart of AFADESI-MSI on a Q-Orbitrap mass spectrometer is shown in Fig. 1.

|
Download:
|
| Fig. 1. Schematic chart showing the AFADESI-MSI on a Q-Orbitrap mass spectrometer. | |
Before optimizing parameters of AFADESI-MSI system, the uniform samples (Fig. S1b in Supporting information) used were characterized. As shown in Figs. S3b and S3c (Supporting information), the molecular ion peak of the alkaline group of basic blue 7 at m/z 478.32 was observed, and the peak shape of the extracted ion current (EIC) of m/z 478.32 was anastomotic with the distribution of the stripes. In addition, the relative standard deviation (RSD) calculated by the peak area was 3.17%, confirming that the evenly distributed materials prepared by the inkjet printing can be used as uniform samples for optimizing and investigating the parameters of the AFADESI-MSI system.
After that, a demonstration of the enhanced ionic intensity through adjusting crucial parameters of the AFADESI-MSI system was characterized by detecting the uniform samples described above (Fig. S3a). The obtained results are displayed in Figs. S4 and S5 (Supporting information). From the results of the investigation on spray voltage (the voltage difference between the tip of the sprayer and the transport tube, Vspray, Fig. 2a) and transport tube voltage (the voltage difference between the transport tube and the orifice, Vtube, Fig. 2b), we can see that the ionic intensity of m/z 478.32 and its standard deviation increased simultaneously along with the increase of Vspray. Vtube had little effect on the ionic intensity. As a result, the optimal Vspray and Vtube were selected as 8 kV and 3 kV, respectively. In the case of extracting gas flow rate (GasE, Fig. 2c) and sweep gas flow rate (GasS, Fig. 2d), the experimental results corresponded to a previous study in which the GasE flow rate was proportional to the intensity of ions. No signal could be detected if the GasE flow rate was lower than 15 L/min. The result showed that airflow played a decisive role in the transport of ions under atmospheric pressure. The GasS flow rate showed little effect on ionic intensity, indicating that the AFADESI-MSI system could use higher GasS to improve robustness of the system without any sensitivity loss. In addition, the distance from needle to transport tube, the distance from needle to sample surface, capillary temperature and fragmentation voltage were also investigated (Fig. 3). The distance between the needle and the transport tube (Fig. 3a) and the fragmentation voltage (Fig. 3d) had no significant effect on the ionic intensity. As for the distance from needle to sample surface (Fig. 3b), a higher ionic intensity was achieved when the needle was 0.6-0.8 mm from the sample surface. In addition to that, the increase in capillary temperature significantly improved the ion response, probably due to faster desolvent at a higher temperature. Finally, the optimal parameters are summarized in Table S2 (Supporting information), and the following measurements were all carried out under the optimized conditions.

|
Download:
|
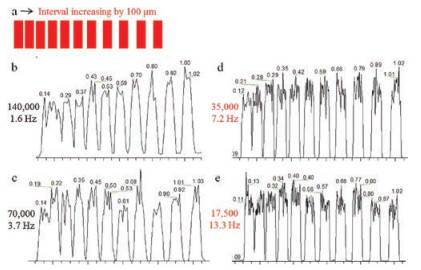
| Fig. 2. The results showing the spatial resolution affected by mass resolution: (a) uniform sample; mass resolution 140, 000 (b); 70, 000 (c); 35, 000 (d); 17, 500 (e). | |

|
Download:
|
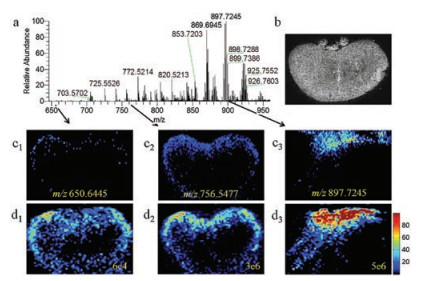
| Fig. 3. Comparison between different mass scan range: (a) mass spectrum of rat kidney; (b) optical image of rat kidney; (c) 100–1000 Da; (d)100–500 Da, 500–1000 Da. | |
After parameters optimization, we investigated the effect of mass resolution on spatial resolution. The time of the analysis was one of the parameters that limited the possibility of improving spatial resolution [32]. By increasing mass resolution, more time was needed for complete spectra acquisition. The Q-Orbitrap mass spectrometer has an adjustable mass resolution up to 140, 000. During the experiment, the red stripes with evenly distributed rhodamine 6 G were analyzed (Fig. S1a) to collect EIC of the molecular ion of rhodamine 6 G at m/z 443.2318 in positive ion mode at a resolution of 140, 000 (Fig. 2b, 1.6 Hz), 70, 000 (Fig. 2c, 3.7 Hz), 35, 000 (Fig. 2d, 7.2 Hz) or 17, 500 (Fig. 2e, 13.3 Hz). With a decrease in mass resolution, there was an increase in the generation of data points. Moreover, the shape of the peak was closer to a rectangle. When the mass resolution was set to 35, 000 or 17, 500, 30% baseline separation could be acquired at the spatial resolution of 100 μm, which is the optimal spatial resolution of the AFADESI-MSI based on a Q-Orbitrap mass spectrometer. In the case of high mass resolution (70, 000 and 140, 000), the spatial resolution was lower (~200 μm).
Besides, the effect of spray solvent flow rate on spatial resolution and sensitivity was also investigated. The analysis of the sample was achieved by serially desorbing and ionizing the sample surface with electrospray in the AFADESI-MSI system. The spot size determined by the flow rate of spray solvent directly limits the spatial resolution of MSI. Here, we investigated the changes in spatial resolution and sensitivity by setting the flow rate of spray solvent to 2 μL/min, 5 μL/min, and 10 μL/min (Figs. S6c, e, f in Supporting information). The change in vertical resolution was displayed in Fig. S6b (Supporting information), from which we can see the vertical resolution decreased apparently along with the increase of spray solvent flow rate. By decreasing the flow rate of the spray solvent, a higher spatial resolution can be achieved without evidently losing sensitivity. For instance, when the solvent sprayed at the speed of 2 μL/min, the observed spatial resolution was 100 μm × 150 μm along with sensitivity comparable to the results under high flow rates. In addition, high flow rates increased the ionic intensity slightly (Fig. S6d in Supporting information). However, high flow rate decreased the ionization efficiency, which adversely influences the stability between different spots and the quality of MS images. Therefore, the optimal flow rate of the spray solvent for the AFADESI-MSI system was selected as 2–5 μL/min.
Except for spray solvent flow rate, MS scan range can also affect imaging sensitivity and performance. We investigated the influence of the MS scan range on imaging sensitivity and performance by analyzing the rat kidney tissue sections in both one-time scan mode (100–1000 Da) and segment scan mode (100–500 Da, 500– 1000 Da). The representative mass spectra (Fig. S7 in Supporting information) showed that there is no significant difference for the mass and spectral shape of high-abundance ions in different scan modes. The ionic intensity in the amplified region of lowabundance ions has been enhanced, probably because the number of low-abundance ions injected into the mass spectrometer was increased when using segment scan mode. During the Q-Orbitrap mass spectrometry analysis, the total amount of ions injected into the C-trap was fixed to eliminate the spatial effect between different ions. When segment scan is performed, all the ions are divided into two parts according to mass region. Fewer background ions exist in the high-mass range, which means an increased number of low-abundance ions be injected into C-trap to generate higher signal-to-noise ratio (S/N) and more mass information. After that, the raw data obtained were transformed and output as MS images. Three ions with low (m/z 650.6445; 6e4), medium (m/z 756.5477; 3e6) and high (m/z 897.7245; 5e6) normalized intensity values were selected to investigate the effect of the mass scan range on imaging performance (Figs. 3c1-c3 and d1-d3). Segment scan gained higher ionic intensity and S/N compared to the onetime scan, especially for low-abundance compounds where segment scan provided a clear histological distribution profile while one-time scan only displayed a few noise points. Nevertheless, segment scan had an adverse effect on the spatial resolution of MSI because it halved the sampling frequency. In conclusion, segment scan can significantly improve the sensitivity and performance of MSI and increase the detection of low-abundance compounds.
Along with mass scan range, the resolution of imaging output is another important factor that limits the imaging performance and accuracy of the results [33]. Here, rat kidney tissue sections were analyzed with a mass resolution of 70, 000. The resolution of imaging output was represented by reconstructing ions with different mass tolerance of △m/z 0.003 and △m/z 0.3. Images of ions with the same integer mass number but different m/z were particularly interesting (Fig. 4). It can be seen from the mass spectra and MS images (Fig. 4a) of a background ion (m/z 172.9562) and two sample ions (m/z 172.9896 and 173.0074) that the three ions were well distinguished and the two sample ions have obvious histological distribution characteristics in high-resolution (ion tolerance set to 0.003) images. In the low-resolution (ion tolerance set to 0.3) image, sample ions were confused with the background ion. The comparation demonstrated that high-resolution imaging output can eliminate the interference of background ions and obtain the true histological distribution characteristics of sample ions. Fig. 4b displays the mass spectra and MS images of three sample ions (m/z 217.0167, 217.0285 and 217.0470), from which we can see that high-resolution of imaging output also eliminated sample ion mutual interference and obtained their true histological distribution characteristics.

|
Download:
|
| Fig. 4. High-resolution of imaging output eliminates the back-ground interference (a) and the sample ions mutual interference (b) for ion imaging in MSI. | |
In conclusion, the application of an optimized AFADESI-MSI tandem Q-Orbitrap mass spectrometer system on bio-tissue analysis was demonstrated here to provide stable and reliable imaging results. Accurate molecular formula information generated from high-resolution data can be used for structural identification.
The MSI platform was systematically optimized and characterized using uniform samples. In general, the increase of the extracting gas flow rate in the AFADESI transport system can significantly enhance the intensity of ions, further showing that airflow plays a decisive role in the transportation of ions under atmospheric pressure. The spatial resolution of the acquired MS images can be improved by either increasing the sampling frequency or decreasing the flow rate of spray solvent. Finally, the optimal spatial resolution achieved on this system was shown to be 100 μm × 150 μm. In addition, the results of the investigation on mass scan range using rat kidney tissue sections indicated that segment scan improved the S/N and sensitivity of obtained MS images. This has great significance for imaging analysis of low-abundance compounds because more mass spectral information can be acquired with better imaging quality. High-resolution imaging output can eliminate the interference between ions which have similar m/z values and obtain the real distribution characteristics of analytes in tissue samples.
With these improvements on ionic intensity, resolution and sensitivity of AFADESI-MSI tandem high-resolution mass spectrometer system and the inherent advantage of the structure identification ability of tandem mass spectrometry, we can foresee a promising future of this technique in the bioanalysis field. Bearing in mind that there is a trade-off between mass resolution, spatial resolution and sensitivity, a comprehensive consideration of these factors should be undertaken in MSI experiments.
AcknowledgmentsThis work was supported by the National Instrumentation Program (No. 2016YFF0100304), the National Natural Science Foundation of China (Nos. 21335007, 81773678), the CAMS Innovation Fund for Medical Sciences (No. 2016-I2 M-1-009), and PUMC Youth Fund and the Fundamental Research Funds for the Central Universities (No. 3332015177).
Appendix A. Supplementary dataSupplementary material related to this article canbefound, in the online version, at doi:https://doi.org/10.1016/j.cclet.2018.06.006.
| [1] |
A.R. Buchberger, K. Delaney, J. Johnson, Anal. Chem. 90 (2018) 240-265. DOI:10.1021/acs.analchem.7b04733 |
| [2] |
N. Bjarnholt, B. Li, J.D. Alvise, Nat. Prod. Rep. 31 (2014) 818-837. DOI:10.1039/C3NP70100J |
| [3] |
D. Calligaris, I. Norton, D.R. Feldman, J. Mass. Spectrom. 48 (2013) 1178-1187. DOI:10.1002/jms.3295 |
| [4] |
T. Greer, R. Sturm, L. Li, J. Proteom. 74 (2011) 2617-2631. DOI:10.1016/j.jprot.2011.03.032 |
| [5] |
A. Nilsson, R.J. Goodwin, M. Shariatgorji, Anal. Chem. 87 (2015) 1437-1455. DOI:10.1021/ac504734s |
| [6] |
S. Taira, D. Kaneko, Anal. Sci. 30 (2014) 197-203. DOI:10.2116/analsci.30.197 |
| [7] |
D. Touboul, A. Brunelle, O. Laprevote, Biochimie 93 (2011) 113-119. DOI:10.1016/j.biochi.2010.05.013 |
| [8] |
P.J. Trim, M.C. Djidja, T. Muharib, J. Proteom. 75 (2012) 4931-4940. DOI:10.1016/j.jprot.2012.07.016 |
| [9] |
C. Wu, A.L. Dill, L.S. Eberlin, Mass. Spectrom. Rev. 32 (2013) 218-243. DOI:10.1002/mas.v32.3 |
| [10] |
J.Y. Kim, E.S. Seo, H. Kim, Nat. Commun. 8 (2017) 2113-2125. DOI:10.1038/s41467-017-02216-6 |
| [11] |
T. Wu, X.H. Yang, C.J. Zhang, Chin. Chem. Lett. 27 (2016) 901-904. DOI:10.1016/j.cclet.2016.02.020 |
| [12] |
A. Brunelle, D. Touboul, O. Laprevote, J. Mass. Spectrom. 40 (2005) 985-999. |
| [13] |
P.M. Vaysse, R.M.A. Heeren, T. Porta, Analyst 142 (2017) 2690-2712. DOI:10.1039/C7AN00565B |
| [14] |
Y. Ouyang, J. Liu, B. Nie, RSC Adv. 7 (2017) 56044-56053. DOI:10.1039/C7RA11839B |
| [15] |
J. Chen, Y. Hu, Q. Lu, Analyst 142 (2017) 1119-1124. DOI:10.1039/C6AN02721K |
| [16] |
M. Nazari, M.T. Bokhart, P.L. Loziuk, Analyst 143 (2018) 654-661. DOI:10.1039/C7AN01828B |
| [17] |
B. Feng, J. Zhang, C. Chang, Anal. Chem. 86 (2014) 4164-4169. DOI:10.1021/ac403310k |
| [18] |
Z. Luo, J. He, Y. Chen, Anal. Chem. 85 (2013) 2977-2982. DOI:10.1021/ac400009s |
| [19] |
J. He, F. Tang, Z. Luo, Rapid. Commun. Mass. Spectrom. 25 (2011) 843-850. DOI:10.1002/rcm.4920 |
| [20] |
F. Tang, Y. Chen, J. He, Chin. Chem. Lett. 25 (2014) 687-692. DOI:10.1016/j.cclet.2014.01.046 |
| [21] |
Z. Luo, J. He, F. Tang, Chem. J. Chin. U. 33 (2012) 908-913. |
| [22] |
Z. Luo, J. He, N. Li, Chin. J. Anal. Chem. 39 (2011) 1743-1747. |
| [23] |
X. Mao, J. He, T. Li, Sci. Rep. 6 (2016) 21043-21054. DOI:10.1038/srep21043 |
| [24] |
T. Li, J. He, X. Mao, Sci. Rep. 5 (2015) 14089-14100. DOI:10.1038/srep14089 |
| [25] |
R.M. Alberici, P.H. Vendramini, M.N. Eberlin, Anal. Methods 9 (2017) 5029-5036. DOI:10.1039/C7AY00858A |
| [26] |
F.D.S. Araújo, R.L. Vieira, E.P.L. Molano, RSC Adv. 7 (2017) 29953-29958. DOI:10.1039/C7RA03895J |
| [27] |
A. Makarov, Anal. Chem. 72 (2000) 1156-1162. DOI:10.1021/ac991131p |
| [28] |
A.R. Korte, B.J. Nikolau, Anal. Bioanal. Chem. 407 (2015) 2301-2309. DOI:10.1007/s00216-015-8460-5 |
| [29] |
R.R. Landgraf, M.C. Prieto Conaway, T.J. Garrett, Anal. Chem. 81 (2009) 8488-8495. DOI:10.1021/ac901387u |
| [30] |
D.C. Perdian, Anal. Chem. 82 (2010) 9393-9400. DOI:10.1021/ac102017q |
| [31] |
P.D. Verhaert, K. Strupat, Methods Mol. Biol. 656 (2010) 433-449. DOI:10.1007/978-1-60761-746-4 |
| [32] |
A. Bodzon-Kulakowska, P. Suder, Mass. Spectrom. Rev. 35 (2016) 147-169. DOI:10.1002/mas.21468 |
| [33] |
J. Laskin, I. Lanekoff, Anal. Chem. 88 (2016) 52-73. DOI:10.1021/acs.analchem.5b04188 |