 2019, Vol. 30


It has attracted increasing interest to develop electrochemical energy conversion and storage technologies including water electrolysis, fuel cells, and metal–air batteries [1-5]. Among them, water electrocatalysis is a clean, facile way for hydrogen generation but is bottlenecked by the sluggish oxygen evolution reaction (OER), which involves four electron-proton coupled process and requires higher overpotential to overcome the kinetic barrier [6-9]. Precious metal-based catalysts such as metal iridium and ruthenium oxides are known to exhibit the best overall performance for the OER, but suffer from high cost and element scarcity, severely limiting their practical applications in electrochemical devices [10]. Therefore, the development of efficient OER electrocatalysts based on cheap and abundant elements is of paramount significance.
Recently, in searching cost-effective and earth-abundant electrochemical catalyst, there are extensive research interests directing to mixed transition metal oxides [11-13]. For example, ternary oxides with two different metal cations such as NiCo2O4 [14], CoMn2O4 [15, 16], FeMoO4 [17], CoMoO4 [18], and NiMoO4 [19], have been considered to be promising and highly active catalysts for the OER, mainly because of their larger reserves and rich redox reactions [20]. Among them, NiMoO4, showing considerable chemical stability, electrochemical activity and electrical conductivity, has been investigated as electrode materials for supercapacitors and lithium batteries [21-25] and is anticipated to hold great potential for the OER. Singh et al. [26] investigated the OER performance of NiMoO4 powders, which showed a Tafel slope of ~70 mV/dec. This performance lags far behind the benchmark Ru-based catalyst, leaving much room for improvement. Besides, a comparative study on the performance of ternary NiMoO4 and the binary NiO and MoO3 would aid in the understanding of the synergistic effect of Ni and Mo but is not reported to the best of our knowledge.
Herein, we report the preparation of NiMoO4 nanorods via a simple hydrothermal method and their electrocatalytic properties towards the OER in alkaline condition. Our results indicate that the one-dimensional nanostructured NiMoO4 exhibits high OER activity and durability. An overpotential of 340 mV is obtained at a current density of 10 mA/cm2, with a remarkable Tafel slope of 45.6 mV/dec. This performance is comparable to the benchmark Ru-based oxide catalysts. Furthermore, we comparatively prepare NiO and MoO3 nanomaterials via hydrothermal route and investigate their OER performance. The results clearly suggest that the ternary oxide NiMoO4 significantly outperform the binary oxide NiO and MoO3. Although MoO3 is almost electrocatalytically inactive, the inclusion of Mo in NiMoO4 promotes the pre-redox reaction of Ni in forming the active Ni species. The study highlights the importance of morphological control and synergistic effect of bimetallic elements in making active and robust oxide OER catalyst.
All the chemicals and raw materials were used as received without further purification. Ammonium molybdate hexahydrate ((NH4)6Mo7O24·4H2O, 99%) and ruthenium dioxide (RuO2) were supplied by Meryer Chemical Technology. Nickel nitrate hexahydrate (Ni(NO3)2·6H2O, 99%), urea and Nafion (5 wt%) were purchased from Innochem and Sigma-Aldrich, respectively. Ethanol was offered by Tianjin Guangfu Fine Chemical Research Institute.
Synthesis of NiMoO4, NiO and MoO3: In a typical synthesis, 2.622 g of (NH4)6Mo7O24·4H2O (15 mmol), 4.362 g of Ni (NO3)2·6H2O (15 mmol) and 0.45 g of urea (7.5 mmol) were dissolved with excess distilled water (70 mL) in a glass beaker. The resultant mixture was magnetically stirred to form a homogeneous solution at room temperature. After stirring for 30 min, the solution was transferred into a 100 mL Teflon-lined stainless steel autoclave, which was maintained at 160 ℃ for 12 h. After naturally cooling to room temperature, the samples were collected by centrifugation at 8000 rpm for 3 min and washed sequentially with deionized water and ethyl alcohol for three times separately. The samples were dried in a vacuum oven at 60 ℃ for 6 h and were finally annealed at 400 ℃ for 2 h in air under a temperature ramping rate of 5 ℃ per min to obtain NiMoO4 nanorods. The synthesis of NiO and MoO3 proceeded with single Ni or Mo precursors following similar procedures but without using urea.
Powder X-ray diffraction (XRD) patterns were performed by Rigaku MiniFlex600 powder diffractometer with a Cu Kα X-ray source at a scanning rate of 2°/min. Scanning electron microscopy (SEM) images were recorded with a JEOL JSM-7500F microscope operated at 5 kV. Transmission electron microscopy (TEM) images were obtained on a Philips Tecnai G2F-20 at an acceleration voltage of 200 kV. For TEM measurements, the samples were prepared by dispersing in ethanol and dropping the suspension on a holey carbon net supported on copper grids. X-ray photon electron spectroscopy (XPS) data were collected by using a Kratos Axis Ultra DLD spectrometer with a monochromatic Al-Ka X-ray source.
Electrochemical measurements were carried out with a computer-controlled workstation bipotentiostats (Pine Instrument) assembled with a modulated speed rotator (PHYCHEM) in a three-electrode system at room temperature. Saturated calomel electrode (SCE) and Pt foil served as the reference electrode and counter electrode, respectively. A glassy carbon electrode (diameter 5.61 mm) covered with a thin layer of catalyst was conducted as working electrode. To prepare the working electrode, 10 mg catalyst samples were dispersed in the mixture of 950 μL isopropanol and 50 μL Nafion solution (5 wt%) by sonication for 30 min to form a homogeneous ink. The mixture (9 μL) was dropped onto the surface of the electrode and dried under ethanol atmosphere at room temperature to form a thin catalyst film (loading 0.283 mg/cm2). For comparison, NiO, MoO3 and commercial RuO2 catalysts were also prepared on glassy carbon electrode following similar procedures.
The electrocatalytic OER activity of the catalysts was evaluated by linear sweeping voltammetry (LSV) at a scan rate of 5 mV/s from 0 to 0.9 V versus SCE at a rotation speed of 1600 rpm (round per minute). The measurements were performed in 1 mol/L KOH electrolyte at room temperature. All the potentials in LSV curve are iR-corrected unless stated. Electrochemical impedance spectroscopy (EIS) was measured by Parstat 2273A potentiostat/galvanostat workstation (AMETEK) with a frequency scan range from 100 kHz to 10 mHz.
The NiMoO4 nanorods were synthesized by a reported hydrothermal method with modified procedures [27], as schematically illustrated in Fig. 1a. Binary NiO and MoO3 oxides were also prepared for comparison. Fig. 1b shows The XRD patterns and the corresponding Rietveld refinement. The diffraction profiles indicate high crystallinity and can be readily indexed to monoclinic NiMoO4 (space group C2/m, JCPDS card No. 86-361), without other impurity diffraction peaks such as NiO or MoO3. Based on Rietveld refinement, the lattice parameters are a = 9.643 Å, b = 8.810 Å and c = 7.707 Å. Fig. 1b schematically shows the monoclinic crystal structure of NiMoO4, in which Mo and Ni atoms occupy the tetrahedral and octahedral sites, respectively. The octahedral NiO6 and adjacent tetrahedral MoO4 are interconnected by sharing edge, which benefit ionic diffusion and charge transfer and would contribute to the OER performance [20, 28, 29]. XRD patterns of NiO and MoO3 (Fig. S1 in Supporting information) fully agree with the standard profile of JCPDS No. 89-3080 and No. 21-569, respectively.

|
Download:
|
| Fig. 1. (a) Schematic illustration of the formation of NiMoO4 nanorods. (b) Experimental XRD patterns and Rietveld-refined profiles. (c) Crystal structure of NiMoO4. | |
Raman spectroscopy of NiMoO4 was conducted and shown in Fig. S2 (Supporting information). The peaks centered at 263, 378, 706, 818, 910 and 960 cm-1 correspond to Ni—O—Mo characteristic vibration [27, 30]. The broad bands at 818 and 910 cm-1 are due to the asymmetric stretching modes of Mo—O bond, while the band at 960 cm-1 can be ascribed to the symmetric stretching modes of Mo—O link. The peak present at 706 cm-1 is assigned to the asymmetric vibration of Ni—O—Mo. Furthermore, there are another two weak peaks at 263 and 378 cm-1, which are assignable to the deformation modes of Mo—O—Mo linkage.
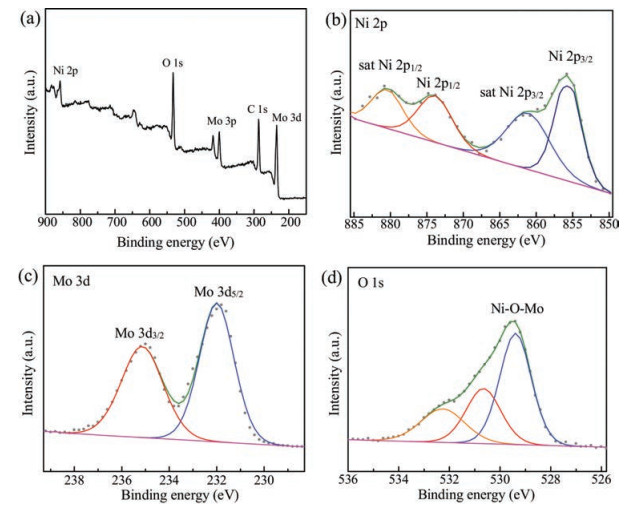
To analyze the surface chemical state and composition of NiMoO4 nanorods, XPS spectroscopy (Fig. 2) was conducted. As depicted in Fig. 2a, the C 1s, O 1s, Ni 2p, Mo 3p and Mo 3d peaks are clearly observed in the survey spectrum. For Ni 2p level in Fig. 2b, two core-level signals appear at 855.6 eV and 873.9 eV, which correspond to Ni 2p3/2 and Ni 2p1/2 with separation of 18.3 eV and can be assigned to the Ni2+ oxidation state. Additionally, there are two other satellite peaks located at 861.5 and 880.4 eV. XPS scan in the Mo region (Fig. 2c) of NiMoO4 presents two peaks at a binding energy of 235.2 eV and 231.8 eV, which are in good agreement with the Mo 3d5/2 and 3d3/2 levels, respectively. The peak positions and the separation up to 3.1 eV between the two peaks reveal the presence of Mo6+. Moreover, in O 1s spectrum (Fig. 2d), two fitted peaks at 529.4 eV and 530.6 eV can be assigned to the typical metal–oxygen (Ni—O—Mo) bond while the peak at the high energy of 532.6 eV is attributed to surface-absorbed oxygen species. These XPS results clearly confirm the formation of NiMoO4 and are consistent with previous report [31, 32].

|
Download:
|
| Fig. 2. (a) Survey curve, (b) Ni 2p, (c) Mo 3d, and (d) O 1s XPS spectra of NiMoO4. | |
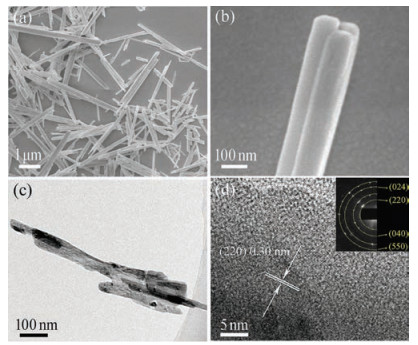
Fig. 3a shows the SEM image of the synthesized NiMoO4. The sample presents a nanorod shape with length of 1–3 μm and average diameter of 100 nm. A closer inspection (Fig. 3b) of the NiMoO4 nanorods demonstrates that they are composed of three axially-bound single rods. TEM imaging (Fig. 3c) further reveals 1D nanorod morphology and the firm binding of several rods. In HRTEM (Fig. 3d), the lattice fringes can be observed with spacing of 3.0 Å, which well matches with the interplanar distance of (220) facet of NiMoO4. The marked rings of selected area electron diffraction (SAED) pattern (Fig. 3d, inset) conform well to (220), (040), (024), and (550) planes of NiMoO4 and indicate polycrystallinity of the sample. In comparison, the binary NiO and MoO3 oxides synthesized using similar hydrothermal method show irregular particulate and spherical shape (Fig. S3 in Supporting information). The morphological difference suggests that the use of urea precursor exerts prominent effect on the nucleation and crystal growth behaviors of Ni and Mo oxides.

|
Download:
|
| Fig. 3. (a) Low and (b) high-magnification SEM images of NiMoO4. (c) TEM and (d) HRTEM images of NiMoO4 (inset, SAED pattern). | |
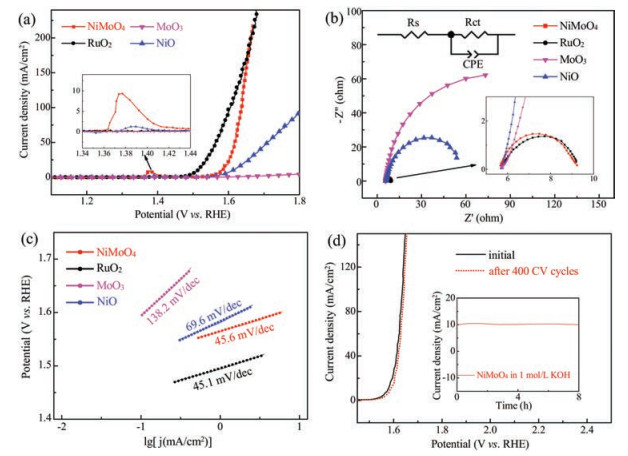
To evaluate the electrocatalytic performance for the OER, 7 mg NiMoO4 samples were mixed with 3 mg carbon (Vulcan XC-72) and loaded onto rotating disk electrodes (RDEs) with a mass loading of 0.283 mg/cm2 to prepare the working electrode. Reference materials including MoO3, NiO and benchmark RuO2 were also tested for comparison. Fig. 4a shows the typical LSV curves. RuO2 exhibits a superior OER catalytic activity with a 0.21 V onset potential. NiMoO4 demonstrates an onset potential of 0.29 V, which is positive than that of NiO (0.31 V) and MoO3 (0.35 V) and slightly larger than the value of RuO2. Note that the current density of NiMoO4 surpasses RuO2 after an overpotential of 0.42 V, suggesting remarkable catalytic performance of NiMoO4. Besides, to generate a current density of 10 mA/cm2, NiMoO4 nanorods require an overpotential of 0.34 V, which is much smaller than that on NiO. In comparison, MoO3 is almost inactive. There are distinct redox peaks between 1.36 V and 1.42 V during the OER for both NiMoO4 and NiO. These redox signals originate from the electron transfer from Ni2+ to Ni3+, which is generally proposed to be the electrocatalytically active species [33]. The higher current density of this pre-OER peak suggests that NiMoO3 favors the formation of the active sites as compared to NiO.

|
Download:
|
| Fig. 4. (a) LSV polarization curves of NiMoO4, MoO3, NiO, and benchmark RuO2 at a scan rate of 5 mV/s in 1 mol/L KOH. Inset (a) enlarges the pre-OER redox peaks. (b) Nyquist plots and (c) Tafel plots of NiMoO4, MoO3, NiO, and benchmark RuO2. Inset (b) shows the magnified part at high frequency range and the equivalent circuit. (d) Polarization curves of NiMoO4 before and after 400 cycles at a scan rate of 20 mV/s between 1.45 V and 1.7 V. Inset (d) displays the chronoamperometry (I–t) curve of NiMoO4 at an overpotential of 270 mV over 8 h. | |
Fig. 4b displays the electrochemical impedance spectroscopies (EIS) of different catalyst samples. A semicircle at high frequency region reflects the charge transfer resistance of the OER process. By fitting the EIS data with a simplified equivalent circuit (Fig. 4b inset), the NiMoO4 nanorods exhibit a charge transfer impedance of 3.62Ω, which is close to that of RuO2 (3.60Ω) and is significantly lower than that of MoO3 (148.6Ω) and NiO (54.81Ω). The results suggest a faster electrode kinetics of the OER process on NiMoO4 nanorods. The superior charge transfer performance of NiMoO4 over MoO3 and NiO could be attributed to the higher electrical conductivity of the composite oxide containing bimetallic Ni and Mo for dual-site charge exchange.
Fig. 4c shows the Tafel plots to further evaluate the catalytic kinetics of different samples. The Tafel slopes are 45.6, 69.6, 138.2 and 45.1 mV/dec for NiMoO4, NiO, MoO3 and RuO2, respectively. The lower Tafel slope of NiMoO4 again implies its higher OER activity. The NiMoO4 nanorods outperform other reported forms of NiMoO4 such as powders and nanotubes [26, 34] and are comparable to other ternary oxides such as NiCo2O4 [35], in terms of overpotential and Tafel slopes (Table S1 in Supporting information). Besides the activity, NiMoO4 exhibits remarkable catalytic durability. As shown in Fig. 4d, the polarization profile is essentially maintained after a continuous CV scanning of 400 cycles in 1 mol/L KOH solution. Moreover, from the chronoamperometry (Fig. 4d inset) test, there is no apparent current loss during a continuous operation at a constant overpotential of 270 mV for 8 h, further suggesting long-time stability of NiMoO4. To further understand the catalytic ability of the samples, electrochemically active surface area (ECSA), which has been widely used to evaluate the OER electrocatalytic performance [36-38], was determined by measuring double-layer capacitance (CDL) from the CV curves at various scan rates (Fig. S4 in Supporting information). The ECSA values (Table S2 in Supporting information) determined from the slopes of ic-v fitting lines are 16.1, 11.4, 7.0 and 61.8 cm2 for NiMoO4, NiO, MoO3 and RuO2, respectively. Remarkably, the specific activity (SA) at 1.65V is 2.41mA/cm2 for NiMoO4, which is 4.6, 60.2 and 3.6 times that of NiO (0.52mA/cm2), MoO3 (0.04mA/cm2) and RuO2 (0.67mA/cm2), further confirming the high eletrocatalytic activity of NiMoO4. The samples were analyzed after OER test. The nanorod morphology of NiMoO4 was essentially maintained after continuous polarization, as evidenced by SEM image (Fig. S5). However, Raman spectroscopy (Fig. S2) indicated the generation of NiOOH and MoO3, as viewed from the detected peaks at 545 and 863cm-1. The presence of NiOOH could facilitate the OER rate and enhance electrocatalytic performance [39]. Combination the Raman analysis and the CV results, the inclusion of Mo in NiMoO4 is proposed to promote the transition from Ni(Ⅱ) to Ni(Ⅲ), thus contributing to higher electrocatalytic activity.
In summary, we report a facile hydrothermal synthesis of NiMoO4 nanorodsand their electrocatalytic properties towardsthe oxygen evolving reaction. The prepared NiMoO4 nanorods exhibit high catalytic activity for the OER in alkaline condition, displaying a considerable overpotential of 340mV at a current density of 10mA/cm2 and a remarkably low Tafel slope of 45.6mV/dec. Additionally, negligible activity recession is observed for a continuous 8h of OER testing. The performance of NiMoO4 nanorods is comparable to the benchmark Ru-based oxide catalyst and significantly outperforms the binary NiO and MoO3 oxides, suggesting synergistic effect of Ni and Mo. The results presented here indicate the promising application of nanostructured NiMoO4 toward oxygen electrocatalysis.
AcknowledgementsThis work was financially supported by the Ministry of Science and Technology (No. 2017YFA0206700), the National Natural Science Foundation of China (No. 51571125) and Ministry of Education (No. B12015).
Appendix A. Supplementary dataSupplementary data associatedwith this article can be found, in the online version, at https://doi.org/10.1016/j.cclet.2018.03.035.
| [1] |
F.Y. Cheng, J. Chen, Chem. Soc. Rev. 4 (2012) 2172-2192. |
| [2] |
Y. Na, B. Hu, Q.L. Yang, et al., Chin. Chem. Lett. 26 (2015) 141-144. DOI:10.1016/j.cclet.2014.09.011 |
| [3] |
W. Chen, Y.F. Gong, J.H. Liu, Chin. Chem. Lett. 28 (2017) 709-718. DOI:10.1016/j.cclet.2016.10.023 |
| [4] |
X. Han, F.Y. Cheng, C.C. Chen, et al., Inorg. Chem. Front. 3 (2016) 866-871. DOI:10.1039/C6QI00066E |
| [5] |
T. Ma, C. Li, X. Chen, et al., Inorg. Chem. Front. 4 (2017) 1628-1633. DOI:10.1039/C7QI00367F |
| [6] |
X.X. Zou, Y. Zhang, Chem. Soc. Rev. 44 (2015) 5148-5180. DOI:10.1039/C4CS00448E |
| [7] |
N.T. Suen, S.F. Hung, Q. Quan, et al., Chem. Soc. Rev. 46 (2017) 303-562. DOI:10.1039/C7CS90005H |
| [8] |
H.X. Zhong, J. Wang, F.L. Meng, et al., Angew. Chem. Int. Ed. 55 (2016) 9937-9941. DOI:10.1002/anie.201604040 |
| [9] |
A.S. Huang, G.H. Zhao, H.X. Li, Chin. Chem. Lett. 18 (2017) 997-1000. |
| [10] |
Y. Lee, J. Suntivich, K. May, J. Phys. Chem. Lett. 3 (2012) 399-404. DOI:10.1021/jz2016507 |
| [11] |
F.Y. Cheng, J. Shen, B. Peng, et al., Nat. Chem. 3 (2011) 79-84. DOI:10.1038/nchem.931 |
| [12] |
C. Li, X.P. Han, F.Y. Cheng, et al., Nat. Commun. 5 (2015) 7345. |
| [13] |
Z.H. Yan, H.M. Sun, X. Chen, et al., Nano Res. 11 (2018) 3282-3293. DOI:10.1007/s12274-017-1869-8 |
| [14] |
H.C. Chien, W.Y. Cheng, Y.H. Wang, J. Mater. Chem. 21 (2011) 18180-18182. DOI:10.1039/c1jm14025f |
| [15] |
J.J. Shi, K.X. Lei, W.Y. Sun, et al., Nano Res. 10 (2017) 3836-3847. DOI:10.1007/s12274-017-1597-0 |
| [16] |
J. Du, C.C. Chen, F.Y. Cheng, et al., Inorg. Chem. 54 (2015) 5467-5474. DOI:10.1021/acs.inorgchem.5b00518 |
| [17] |
R.N. Singh, J.P. Singh, A. Singh, Int. J. Hydrogen Energy 33 (2008) 4260-4264. DOI:10.1016/j.ijhydene.2008.06.008 |
| [18] |
M.Q. Yu, L.X. Jiang, H.G. Yang, Chem. Commun. 51 (2015) 14361-14364. DOI:10.1039/C5CC05511C |
| [19] |
Z.X. Yin, Y.J. Chen, Y. Zhao, J. Mater. Chem. A 3 (2015) 22750-22758. DOI:10.1039/C5TA05678K |
| [20] |
S.J. Peng, L.L. Li, H.B. Wu, et al., Adv. Energy Mater. 5 (2015) 1401172-1401179. DOI:10.1002/aenm.201401172 |
| [21] |
B. Wang, S.M. Li, X.Y. Wu, et al., J. Mater. Chem. A 3 (2015) 13691-13698. DOI:10.1039/C5TA02795K |
| [22] |
J.H. Ahn, G.D. Park, Y.C. Kang, et al., Electrochim. Acta 174 (2015) 102-110. DOI:10.1016/j.electacta.2015.05.149 |
| [23] |
K. Xiao, L. Xia, G.X. Liu, et al., J. Mater. Chem. A. 3 (2015) 6128-6135. DOI:10.1039/C5TA00258C |
| [24] |
D.P. Cai, B. Liu, D.D. Wang, et al., Electrochim. Acta 125 (2014) 294-301. DOI:10.1016/j.electacta.2014.01.049 |
| [25] |
S.E. Moosavifard, J. Shamsi, S. Fani, et al., RSC Adv. 4 (2014) 52555-52561. DOI:10.1039/C4RA09118C |
| [26] |
R.N. Singh, R. Awasthi, A.S. Sinha, et al., J. Solid State Electrochem. 13 (2009) 1613-1619. DOI:10.1007/s10008-008-0744-7 |
| [27] |
P.R. Jothi, S. Kannan, G. Velayutham, J. Power Sources 277 (2015) 350-359. DOI:10.1016/j.jpowsour.2014.11.137 |
| [28] |
K. Eda, Y. Kato, Y. Ohshiro, et al., J. Solid State Electrochem. 183 (2010) 1334-1339. DOI:10.1016/j.jssc.2010.04.009 |
| [29] |
M. Wiesmann, H. Ehrenberg, G. Wltschekb, et al., J. Magn. Magn. Mater. 150 (1995) 1-4. DOI:10.1016/0304-8853(95)00516-1 |
| [30] |
P.R. Jothi, K. Shanthi, R.R. Salunkhe, et al., Eur. J. Inorg. Chem. 22 (2015) 3694-3699. |
| [31] |
L. Huang, J.W. Xiang, W. Zhang, et al., J. Mater. Chem. A 3 (2015) 22081-22087. DOI:10.1039/C5TA05644F |
| [32] |
B. Wang, S.M. Li, X.Y. Wu, et al., Phys. Chem. Chem. Phys. 18 (2016) 908-915. DOI:10.1039/C5CP04820F |
| [33] |
Q.C. Dong, C.C. Sun, Z.Y. Dai, et al., ChemCatChem 8 (2016) 1-7. DOI:10.1002/cctc.201501371 |
| [34] |
Z. Yin, Y. Chen, Y. Zhao, et al., J. Mater. Chem. A 3 (2015) 22750-22758. DOI:10.1039/C5TA05678K |
| [35] |
J. Yin, P.P. Zhou, L. An, et al., Nanoscale 8 (2016) 1390-1400. DOI:10.1039/C5NR06197K |
| [36] |
M.H. Yu, X.Y. Cheng, Y.X. Zeng, et al., Angew. Chem. Int. Ed. 55 (2016) 6762-6766. DOI:10.1002/anie.201602631 |
| [37] |
S.J. Deng, Y. Zhong, Y.X. Zeng, et al., Adv. Mater. 29 (2017) 1700748. DOI:10.1002/adma.201700748 |
| [38] |
S.J. Deng, Y. Zhong, Y.X. Zeng, et al., Adv. Sci. 1700 (2017) 772. |
| [39] |
H.M. Sun, X.B. Xu, Z.H. Yan, et al., Chem. Mater. 29 (2017) 8539-8547. DOI:10.1021/acs.chemmater.7b03627 |