 2019, Vol. 30

 ,
Tairong Kuangb,*
,
Tairong Kuangb,*
b The Key Laboratory of Polymer Processing Engineering of Ministry of Education, South China University of Technology, Guangzhou 510640, China;
c Zhijiang College, Zhejiang University of Technology, Hangzhou 310014, China
As the energy crisis and environmental pollution become more serious, environmentally friendly energy has attracted wide attention from researchers. Lithium-ion batteries, one of the most important eco-friendly energy sources, have gained focus of current research, especially considering the increasing demand for energy storage equipment caused by the rapid growth of electronic equipment (mobile phones, computers, etc.) [1-5]. Moreover, today's lithium-ion batteries are difficult to meet the high performance requirements of products such as electric vehicles.
Most anode materials of lithium ion batteries used in practical applications are carbon materials, such as carbon fiber, natural graphite, and artificially modified graphite. Lignin, a heterogeneous and amorphous polymer that constitutes a large portion of the cell walls of vascular plants, is one of the amplest biomass just after cellulose on earth [6-9]. It can be obtained from a variety of low-cost woody plants and even from papermaking wastewater [10]. Lignin is of great application value for it containing a large number of reactive groups, such as methoxy, hydroxyl [6]. Its specific structure is not clear yet, we only know it composed of macromolecular structure with benzene and methoxy [11]. The estimated natural production of lignin on earth is in the range of 5×10⁸-36×108 tons annually and annual production of commercial lignin is more than 70 million tons [12, 13]. So lignin has attracted great interests in developing value-added products such as sorbents of exhaust gas CO2 and electrode materials of supercapacitors and lithium-ion batteries [14-22]. Sodium ligno-sulfonate with relative molecular weight 1000-20000 can be obtained by attaching a sulfonate-containing group such as -SO3Na to lignin [23]. Since lignosulfonate contains hydrophilic groups such as sulfonate, carboxylate, and phenolic hydroxyl, it is soluble in various aqueous solutions, as a result, the application of lignosulfonate become widely.
Molybdenum disulfide (MoS2) is a typical representative of transition metal sulfide materials [24, 25]. The crystal of MoS2 belongs to the hexagonal system, and the lamellar MoS2 with single sheet composed of three layers of atomic layers. The middle layer molybdenum atoms are bonded to sulfur atoms of upper and lower layers by Mo-S covalent bonds [26]. When the MoS2 monolayer accumulates in ABAB, we get the most stable lamellar MoS2 with a 0.62 nm distance of two MoS2 layers [26]. This distance facilitates the insertion and extraction of lithium ions, so MoS2 has a high specific capacity and charge and discharge efficiency [27-31]. However, the main drawback with MoS2 as the electrode material of lithium ion battery is the poor cycle stability due to the insuperable expansion of MoS2 nanoparticles.
On the other hand, carbon materials, such as activated carbon, porous carbon, carbon nanotubes, nanofibers, carbon aerogels, graphene and other carbon materials, especially mesoporous carbon, can improve the dispersion and conductivity of metal nanoparticles [32-36]. Meanwhile, the carbon scaffold with high graphitization could endure the volume expansion during the charging-discharging process [37]. When lignin is carbonized at high temperature, porous carbon spheres are formed, which exhibits the electrochemical properties of typical carbon materials. Since lignin is derived from biomass and usually discarded as waste, it is promising to use lignin as a cheap alternative material in woody materials. On the other hand, few studies have investigated the fabrication of lignin-derived LPN and their potential usage in high-performance electrode materials [32, 38].
To overcome the unstable specific capacity of common MoS2 anode material, we prepared lignin and MoS2 as core-shell composites MoS2@porous carbon nanospheres (MoS2@PCN), in which PCN working as both the carbon source and the matrix with layered MoS2 binding to the surface of PCN. Owing to the unique hierarchical structure, this composite not only reserved all advantages of the spherical structure, but also increased the reversible capacity and the cycling performance. In addition, the graphitized carbon skeleton in PCN acts as a buffer to alleviate the volume expansion of MoS2 during charge-discharge. At the same time, the graphitized carbon skeleton in PCN also increases conductivity and acts as a conduit for electron transfer.The experimental details are as follows.
Lignosulphonate, isopropanol, sodium molybdate hexahydrate, thiourea were purchased from Aladdin Reagents. Porous carbon Nanosphere (PCN) was prepared using a combined carbonization/activation method and a typical process was shown as below. First, 0.5 g lignosulphonate was dissolved into 10 mL deionized water and then the solution was slowly dripped into 100 mL isopropyl alcohol. The product was separated by centrifugation and was dried at 60 ℃ for 24h to obtain LPN. Porous carbon nanosphere (PCN) was obtained by carbonization of LPN at 800 ℃ for 2h. Secondly, PCN, thiourea, Sodium molybdate hexahydrate were added into 60 mL isopropanol, then the mixture was transferred into a high pressure reactor and the reaction took place at high temperatures and pressures. The resulting product was heated to 800 ℃ in a nitrogen atmosphere and carbonized for 2h to obtain MoS2@PCN. The major process steps employed in this work are illustrated in Scheme 1.

|
Download:
|
| Scheme 1. Schematic procedure for the preparation of MoS2@PCN derived from lignosulfonate. | |
In order to understand the material properties, we chose the following test methods for characterization.
Fourier transform infrared spectroscopy (FTIR) data were collected on a Nicolet 6700 (Thermo Nicolet Corporation) with a measuring range 4000cm-1 to 400cm-1 and a resolution of 0.4cm-1. DLS data were collected on a BI-200SM (American Brookhaven) with water as the solvent. Thermogravimetry (TG) test was performed using a TA Instrument SDT Q600 under a N2 atmosphere with 10 ℃/min ramp rate from room temperature to 1000℃. X-ray diffraction (XRD) data were collected on an X'Pert PRO (Malvern Panalytical). Raman spectra were recorded on a LabRam HRUV (HORIBAJobin Yvon). Scanning electron microscopy (SEM) was carried out with S-4700 (HITACHI), and the accelerate voltage was 10kV and the working distance was 8 mm. Transmission electron microscopy (TEM) was carried out with JEM-100CX Ⅱ (JEOL) field emission electron microscope at an accelerate voltage of 300 kV. Brunauer-Emmet-Teller (BET) isotherms and specific surface area (i.e., BET surface area) were performed on an ASAP 2020(Micromeritics). X-ray photoelectron spectroscopy (XPS) analysis was performed on a Kratos AXIS (Shimadzu) employing a monochromatic Al Ka X-Ray. Raman spectrum was taken with a Lab RAM HR UV800 Raman spectrometer (JOBIN YVON) using an excitation wavelength of 632.81 nm at room temperature.
The electrodes for LIBs were prepared according to the following steps. Poly(vinylidene fluoride) and N-methyl pyrroli-done (mass ratio, 1:10) were mixed to obtain a conductive gel. A small amount of N-methyl pyrrolidone was added to evenly mixed MoS2@PCN, acetylene black and conductive gel (mass ratio 8:1:1) and the mixture was stirred for 3 h to form a uniform slurry. The slurry was applied on copper and then dried in a vacuum oven at 60℃ for 3 h. The dried electrodes were then pressed (15 MPa) and placed in a vacuum oven for an over-night dry at 60 ℃. Finally, the half cells were assembled in an Ar filled glove-box, using 1 mol/L LiPF6 solution ina1:1 (v/v) mixture of ethylene carbonate (EC) and dimethyl carbonate (DMC) as electrolyte and Li foil as counter electrode to form a CR2025 button battery.
The adhesive was prepared with PTFE and deionized water (1:20 mass ratio). Then MoS2@PCN composite, acetylene black and PTFE binder were mixed at a weight ratio of 8:1:1, and the resulting slurry was pasted onto an graphite sheet (1 cm×2 cm) and dried at 80℃ for 12h.
A three-electrode battery system was built for cyclic voltammo-gram (CV) testing. The graphite sheet with mixture is the working electrode with Ag/AgCl electrode as a reference electrode, Pt wafer as the counter electrode and KOH (6mol/L) as the electrolyte [37, 39].
Galvanostatic cycling tests were conducted on a Neware battery system in the voltage range of 1.0-3.0V (vs. Li+/Li) at 30 ℃ in a thermostatic desiccator. Cyclic voltammetry (CV) tests were performed on a CHI660D electrochemical work-station at 0.1 mV/s in the voltage range of 1.0-3.0V. The specific capacitance of the electrode was calculated by the following formula.

|
where C was the specific capacitance (F/g), I was the current (A), V was the potential window (V), v was the scan rate (mV/s), and m was the mass of the sample used for the electrochemical test (g).
The characterization results and discussion are as follows.
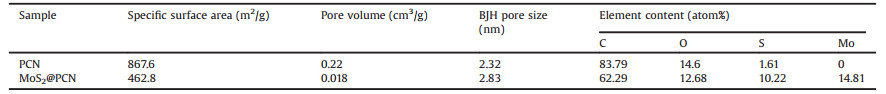
Lignosulfonates are rich in reactive groups such as sulfonic acid groups and phenolic hydroxyl groups, and various chemical reactions can be carried out to obtain lignin derivatives [6]. In order to understand the functional groups ofLPN, LPN was tested by FTIR. The FTIR spectrum of LPN is shown in Fig. 1a. The absorption peak at 3432cm-1 is broad and strong, indicating that the lignin contains hydroxyl groups. The phenolic hydroxyl groups in lignin directly affect the physical and chemical properties. The peak at 1650cm-1 was attributed to the vibration of the benzene ring C=C double bond. The band at 1250 cm-1 assigned to sulfonic acid group was strong. In general, lignosulfate contains large amounts of reactive groups such as sulfonic acid groups, hydroxyl groups and the like. Fig. 1b shows the weight loss curves of the LPN and MoS2@PCN during the high temperature calcination process in N2 atmosphere. In the 0-150℃ region, mainly small molecules, e.g., H2O and dispersant vaporized. The residue content is 67.9 wt%. And the weight of the nanocomposite decreased by about 4% when the temperature increased to 800 ℃. This result indicates that the porous structure of the material did not collapse along with the adsorption effect above 800 ℃. Fig. 1c shows DLS results of LPN. We can see that the diameter is between 500-600 nm, slightly larger than the results obtained in SEM. That is because DLS measures the diameter of the hydrated particles. Figs. 1d and e show the N2 absorption-desorption isotherms and pore size distribution curves (inner plot) of MoS2@PCN and PCN sample. The detailed porous structure data are summarized in Table 1. The rise in the first stage of Fig. 1d indicates that monolayer physisorption formed. With increasing pressure, a straight line appears on the isotherm, which reflects the establishment of multilayer adsorption. Further pressure increase leads to capillary condensation. The observation ofhysteresis loops indicated that the material has a certain pore structure. The BET surface area ofPCN is 867.6 m2/g (Table 1), higherthan 462.8 m2/gof MoS2@PCN. This is because MoS2 blocked some holes ofPCN. With the addition of MoS2, the volume content of mesopores and macropores increase, while the volume content of micropores decreases. A porous structure is essential with incorporation of macropores and mesopores to minimize ion diffusion distance for fast charge transport and increase surface area for promoting electrolyte/electrode contact [39, 40]. Fig. 1f is the Raman spectrum of PCN. The D peak at 1317 cm-1 represents the degree of disorder and defects in the carbon material, and the G peak at 1608 cm-1 represents the graphite carbon material. The peak area ratio, i.e., ID/IG = 1.07 suggested the degree of graphitization of the material was high. From the above data, it can be seen that after the high-temperature calcination of the LPN, the formed porous carbon spheres have a high degree of graphitization, favoring the electron transport and thus improves the electrochemical performance. Figs. 1g and h present the XPS spectra of PCN. The three peaks in Fig. 1g represent C=C—C (284.7eV), C-O (286.1eV), O—C=C (288.7 eV) respectively. The contents of C-O and O—C=C are 25.4% and 3.58%, respectively. This indicates that the surface of the PCN contains more oxygen-containing functional groups and LPN is not completely carbonized after high temperature calcination. Oxygen-containing functional groups caused by this incomplete carbonization enhance electrochemical capacitive properties. The four peaks in Fig. 1g represent thiophene(164 eV), R-O-S-S-R(165 eV), sulfone (169.4eV) and inorganic sulfur (170.6eV). According to semiquantitative analysis by XPS, the relative contents of S and Mo element in the material are 10.22% (atom%) and 14.81% (atom%), respectively. The mass ratio of Mo and S is about 3:2, in accordance with the composition of MoS2.

|
Download:
|
| Fig. 1. (a) FTIR spectrum of LPN; (b) TG curves in N2 atmosphere of LPN and MoS2@PCN; (c) DLS result of LPN; (d) N2 absorption-desorption isotherms and pore size distribution curves (inner plot) of MoS2@PCN; (e) N2 absorption-desorption isotherms and pore size distribution curves (inner plot) of PCN; (f) The Raman spectra for representative PCN; (g, h) The XPS spectra of PCN. | |
|
|
Table 1 The specific surface area, pore volume, pore size of four samples. |
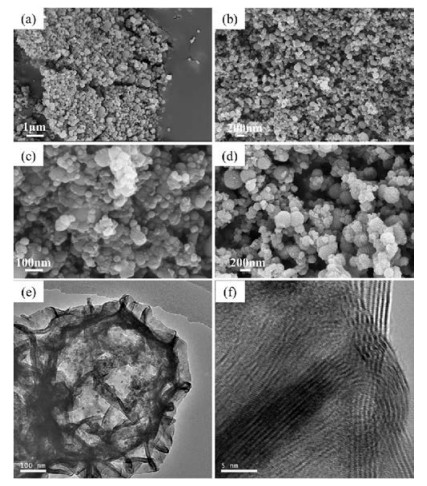
SEM observation (Fig. 2) shows that the surface morphology and structure of LPN, porous carbon spheres and their composites. Figs. 2a and b are the LPNs without and with ultrasonic treatment, respectively. Large differences in sizes of LPN can be observed in Fig. 2a while uniform size distribution was seen in Fig. 2b. That means ultrasonic can reduce the size difference between microspheres. From the Fig. 2c, we can be seen that after heating at 800 ℃, the structure of carbonized LPN remains unchanged. Fig. 2d is SEM of MoS2; we can see that the sheet-like MoS2 is attached to the surface of carbonized LPN. The diameters of the microspheres are calculated in a range of 200 nm-300 nm. Figs. 2e and f show the TEM of the MoS2@PCN. Large amount of pores can be observed in the carbonized LPN, which greatly increases the specific surface area of the carbon spheres and facilitates the transport of ions. From Fig. 2e, we can see that the MoS2 is growing on the surface of the LPN. And the LPN has a large number of pore structures that confirms the result of BET results. The sheet-like MoS2 on the surface of the material grows outward, and the length is about 70 nm. The distance between the sheets is about 100 nm. As shown in Fig. 2f, it is calculated that the lamellar distance between the MoS2 layers is 0.62 nm, which is almost the same as the general MoS2 layer spacing. This distance facilitates the insertion and extraction of lithium ions during charging and discharging.

|
Download:
|
| Fig. 2. (a) SEM ofLPN without ultrasonic; (b) SEM ofLPN with ultrasonic; (c) SEM of carbonizedLPN; (d)SEMofMoS2@PCN; (e, f)TEMofMoS2@PCN. | |
Fig. S1 (Supporting information) showed XRD patterns of MoS2@PCN. All observed diffraction peaks can be systematically indexed to those of the hexagonal phase of MoS2, which are in good agreement with the values of standard card (JCPDS No. 37-1492). The diffraction peak at 14° corresponding to the crystal surface (002) represents a distinct single-layer structure. The peak at 29° is the crystal surface (112) of MoS2. The strength ofthese two peaks is very high, which means that the crystallinity of MoS2 with these two structures is relatively perfect. Clearly, diffraction peaks of elemental Mo were not detected in the XRD pattern, indicating that no carbon thermal reduction occurs during the second calcination of MoS2@PCN. The higher peak intensities indicate that the MoS2 nanostructures are of high crystallinity.
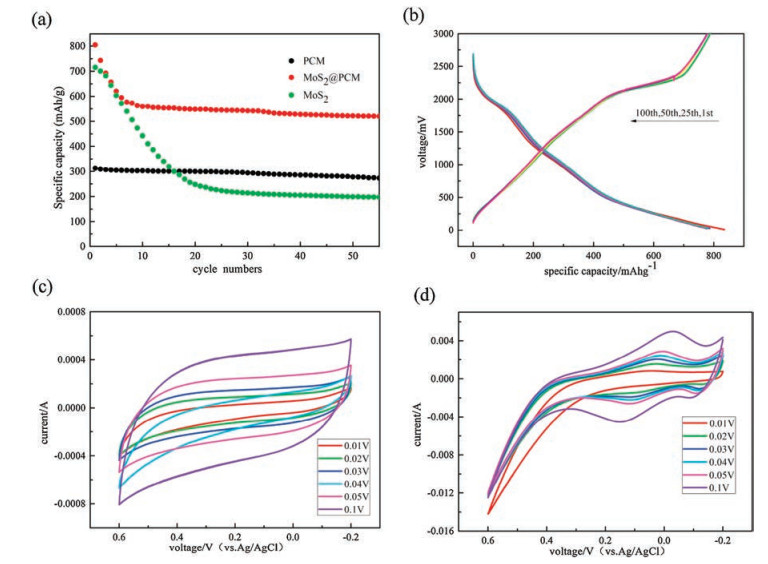
Fig. 3a shows the cycling performance of three materials at low current charge and discharge conditions. The theoretical specific capacity of graphite is 355 mAh/g and the specific capacity of PCN used in this work is about 300 mAh/g. It shows the typical characteristics of carbon materials (good cycle stability). In the first few cycles the specific capacity of MoS2 is high, but after several cycling it falls rapidly. In contrast, MoS2@PCN has a stable cycling performance while the specific capacity is 519 mAh/g after 50 cycles. Fig. 3b is the voltage capacitance curve of MoS2@PCN. During the charging process there is a platform at a voltage of 2100 mV, where lithium ions embedding in the anode material; and during the discharge process, there are 2 platforms at voltages of 2000mV and 1100mV, where lithium ions escape from the anode material. The electrochemical properties of PCN and MoS2@PCN are measured by using cyclic voltammetry (CV) over the potential window of 0-0.7 Vina6 mol/L KOH aqueous solution with a three-electrode cell system. Figs. 3c and d show the CV curve ofPCN and MoS2@PCN at different sweep rate of 0.01-0.1 V/s. In Figs. 3 c and d, the obtained CV curve is symmetrical with the curve of the reducing wave, indicating that the electron transfer is reversible while this material is as an electrode reaction. The area around the CV curve increases with increasing scan rate, however, the shape of the CV curves does not change distinctly, reflecting the good capacitive performance and good power performance of MoS2@PCN electrode material. And the calculated specific capacitances at different scanning rate are presented in Fig. S2 (Supporting information). As scanning rate increases, specific capacitance decreases. Compare the specific capacitances of PCN, the specific capacitances MoS2@PCN is higher. This is also confirmed by the above conclusions.

|
Download:
|
| Fig. 3. (a) Comparative cycling performance at a current density of 0.1 A/gofPCN, M0S2 and MoS2@PCN; (b) Charge-discharge voltage profiles ofMoS2@PCN; (c, d)CV curves of PCN and MoS2@PCN with various scan rates. | |
In summary, we have developed a feasible self-assembly and carbonization method to prepare lignin-derived PCN and its efficient embedment of MoS2 without any additives. The system is eco-friendly, as it using natural lignosulfonate as the carbon precursor in water solution. The obtained Mo-based PCN intermediate can be simply converted to highly crystalline MoS2@PCN via thermal annealing without significant changes in morphology. The annealed product is phase-pure MoS2 and highly graphitized carbon with a high surface area. The hybrid structure has a high specific surface area (462.8 m2/g) and hierarchical pores, which can enhance Li-ion transportation in the electrode, increase the conductivity, and suppress the deformation of MoS2. More importantly, the hybrid nanosphere anode exhibited and retained a high discharging capacity of 519 mAh/g at 0.1 A/g after 50 cycles for a Li-ion battery. We think this hybrid nanocomposite may provide a new route to develop high performance Li-ion battery from natural biomass or organizational structures.
AcknowledgmentsT. Kuang would like to acknowledge the financial support of National Natural Science Foundation of China (No. 51803062), National Natural Science Foundation of Guangdong Province (No. 2018A030310379), National Postdoctoral Program for Innovation Talents (No. BX201700079), China Postdoctoral Science Foundation Funded Project (No. 2017M620371), and Foundation for Distinguished Young Talents in Higher Education of Guangdong Province (No. 2017KQNCX001). F. Chen thanks the financial support of Natural Science Foundation of China (No. 51673175), and Natural Science Foundation of Zhejiang Province (Nos. LY16E030012, LY17E030006 and LY18E030009).
Appendix A. Supplementary dataSupplementary material related to this article can be found, in the online version, at doi:https://doi.org/10.1016/j.cclet.2018.10.007.
| [1] |
X. Wang, X. Lu, B. Liu, et al., Adv. Mater. 45 (2015) 4763-4782. |
| [2] |
Q. Zhang, M. Kaisti, A. Prabhu, et al., Electrochim. Acta 261 (2017) 256-264. |
| [3] |
Q. Zhang, H.S. Majumdar, M. Kaisti, et al., IEEE Trans. Electron Dev. 62 (2015) 1291-1298. |
| [4] |
M. Xu, N. Bai, H. Li, et al., Chin. Chem. Lett. 29 (2018) 1313-1316. DOI:10.1016/j.cclet.2018.04.023 |
| [5] |
H. Yang, W. Cui, Y. Han, B. Wang, Chin. Chem. Lett. 29 (2018) 842-844. DOI:10.1016/j.cclet.2017.09.024 |
| [6] |
D. Kai, M. Tan, L. Pei, et al., Green Chem. 18 (2016) 1175-1200. DOI:10.1039/C5GC02616D |
| [7] |
T. Saito, R. Brown, M. Hunt, et al., Green Chem. 14 (2012) 3295-3303. DOI:10.1039/c2gc35933b |
| [8] |
X. Wang, Q. Zhang, C. Nam, et al., Angew. Chem. Int. Ed. 56 (2017) 11826-11830. DOI:10.1002/anie.201706147 |
| [9] |
X. Ouyang, Y. Yang, G. Zhu, X. Qiu, Chin. Chem. Lett. 26 (2015) 980-982. DOI:10.1016/j.cclet.2015.05.011 |
| [10] |
J. JuWon, Z. Libing, J.L. Lutkenhaus, et al., ChemSusChem 8 (2015) 428-432. DOI:10.1002/cssc.201402621 |
| [11] |
L. Zhang, A. Sosa, K. Walters, Energy Fuel 30 (2016) 7367-7378. DOI:10.1021/acs.energyfuels.6b01220 |
| [12] |
G. Rja, S. Mhb, A. Kranenbarg, et al., Ind. Crops Prod. 20 (2004) 191-203. DOI:10.1016/j.indcrop.2004.04.021 |
| [13] |
S. Constant, H.L. Wienk, A.E. Frissen, et al., Green Chem. 18 (2016) 2651-2665. DOI:10.1039/C5GC03043A |
| [14] |
S. Chatterjee, T. Saito, ChemSusChem 8 (2015) 3941-3958. DOI:10.1002/cssc.201500692 |
| [15] |
W. Zhang, H. Lin, Z. Lin, et al., ChemSusChem 8 (2015) 2114-2122. DOI:10.1002/cssc.201403486 |
| [16] |
X. Xu, J. Zhou, L. Jiang, et al., Carbon 80 (2014) 91-102. DOI:10.1016/j.carbon.2014.08.042 |
| [17] |
Q.B. Meng, J. Weber, ChemSusChem 7 (2014) 3312-3318. DOI:10.1002/cssc.v7.12 |
| [18] |
P.J. Carrott, C.M. Ribeiro, Bioresource Technol. 98 (2007) 2301-2312. DOI:10.1016/j.biortech.2006.08.008 |
| [19] |
W.E. Tenhaeff, O. Rios, K. More, M. McGuire, Adv. Funct. Mater. 24 (2013) 86-94. |
| [20] |
M.S. Seehra, S.K. Pyapalli, J. Poston, O.E. Atta, A.B. Dawson, Indian Acad. Wood Sci. 12 (2015) 29-36. DOI:10.1007/s13196-015-0141-7 |
| [21] |
W.J. Liu, J. Hong, H.Q. Yu, Green Chem. 17 (2015) 4888-4907. DOI:10.1039/C5GC01054C |
| [22] |
G. Chieffi, N. Fechler, D. Esposito, RSC Adv. 5 (2015) 63691-63696. DOI:10.1039/C5RA06635B |
| [23] |
M.M. Titirici, R.J. White, et al., Chem. Soc. Rev. 44 (2015) 250-290. DOI:10.1039/C4CS00232F |
| [24] |
V. Hornof, G. Neale, P. Bourgeois, Chem. Eng. 59 (1981) 554-556. |
| [25] |
X. Wang, H. Feng, Y. Wu, L. Jiao, Am. Chem. Soc. 135 (2013) 5304-5307. DOI:10.1021/ja4013485 |
| [26] |
D. Jariwala, V. Sangwan, L. Lauhon, T. Marks, M. Hersam, ACS Nano 8 (2014) 1102-1120. DOI:10.1021/nn500064s |
| [27] |
Y.H. Lee, X.Q. Zhang, W. Zhang, et al., Adv. Mater. 24 (2012) 2320-2325. DOI:10.1002/adma.201104798 |
| [28] |
B. Radisavljevic, M. Whitwick, A. Kis, ACS Nano 5 (2011) 9934-9938. DOI:10.1021/nn203715c |
| [29] |
S. Bertolazzi, J. Brivio, A. Kis, ACS Nano 5 (2011) 9703-9709. DOI:10.1021/nn203879f |
| [30] |
B. Radisavljevic, A. Radenovic, J. Brivio, V. Giacometti, A. Kis, Nat. Nanotechnol. 6 (2011) 147-150. DOI:10.1038/nnano.2010.279 |
| [31] |
D. Late, B. Liu, H. Matte, V. Dravid, C. Rao, ACS Nano 6 (2016) 5635-5641. |
| [32] |
S. Dutta, S. De, Mater. Today 5 (2018) 9771-9775. DOI:10.1016/j.matpr.2017.10.165 |
| [33] |
F. Chen, W. Zhou, H. Yao, et al., Green Chem. 15 (2013) 3057-3063. DOI:10.1039/c3gc41080c |
| [34] |
M. Zhi, C. Xiang, J. Li, M. Li, N.Q. Wu, Nanoscale 5 (2013) 72-88. DOI:10.1039/C2NR32040A |
| [35] |
X.H. Huang, J.P. Tu, C.Q. Zhang, et al., Electrochim. Acta 52 (2007) 4177-4181. DOI:10.1016/j.electacta.2006.11.034 |
| [36] |
K. Chang, W. Chen, Mater. Chem. 21 (2011) 17175-17184. DOI:10.1039/c1jm12942b |
| [37] |
Z.P. Zhou, F. Chen, T. Kuang, et al., Electrochim. Acta 274 (2018) 288-297. DOI:10.1016/j.electacta.2018.04.111 |
| [38] |
F. Chen, Z.P. Zhou, L. Chang, et al., Microporous Mesoporous Mater. 247 (2017) 184-189. DOI:10.1016/j.micromeso.2017.03.010 |
| [39] |
X. Lei, K. Yu, R. Qi, et al., Chem. Eng. J. 347 (2018) 607-617. DOI:10.1016/j.cej.2018.04.154 |
| [40] |
Y. Zhai, Y. Dou, D. Zhao, et al., Adv. Mater. 23 (2011) 4828-4850. DOI:10.1002/adma.201100984 |