 2019, Vol. 30


Silicates have been widely employed as catalyst supports [1], adsorbents [2] and energy storage materials [3], etc. Among multitudes of silicates, calcium silicate has especially aroused widespread concern for their availability for drug delivery [4], photoluminescence host [5-7], etc., owing to their versatile compositions and distinct advantages such as non-toxicity, good biocompatibility, bioactivity, as well as degradability. In particular, one-dimensional (1D) calcium silicate (CaSiO3) nanostructures could be used as bioactive materials [8] and polymer fillers [9]. To date, 1D CaSiO3 nanostructures have been synthesized via either NaCl/NP-9 aided molten salt synthesis (MSS) [10], or organic surfactant [11, 12]/solvent [11, 13]/microwave [14] assisted hydrothermal-thermal conversion (HTC). However, organic species [10-13], specific apparatus [14], relatively high temperature [10, 15]/long time [11-13, 16], or rigorous requirement of nanoscaled raw materials [15] are pre-requisite in the aforementioned techniques, indicating the unavoidable malign impact to the environment, complicated procedure, as well as high energy consumption. Thus, it is still of great significance to realize controllable synthesis of the uniform high aspect ratio 1D CaSiO3 nanostructures via a facile and environmentally benign route, so as to better fulfill their excellent properties and extend potential applications.
Herein, a facile green and low-cost HTC method (200 ℃, 12.0 h; 800 ℃, 2.0 h) was developed for the uniform high aspect ratio CaSiO3 nanowires (diameter: 40-130 nm, aspect ratio: 40-230) without any organic additive, the optical properties were investigated, and the great potential as a promising structure and function integrated photoluminescent host candidate via Tb3+ doping was evaluated for the first time.
In a typical procedure for CaSiO3 nanowires, 10.0 mL of Na2SiO3 solution (0.502 mol/L) was slowly dropped into 40.0 mL of CaCl2 solution (0.187 mol/L) under vigorous magnetic stirring at room temperature (R.T.). After 10 min, the resultant white slurry was transferred into a Teflon-lined stainless steel autoclave, which was then sealed, heated to 200 ℃, kept in an isothermal state for 12.0 h, and cooled down to R.T. naturally. The precipitate was filtered, washed with DI water for three times, and dried at 60 ℃ for 12.0 h. Then the hydrothermal product was moved to a porcelain boat located in a horizontal quartz tube furnace, which was then treated via a similar multi-step aging heating procedure [17]. Specifically, the furnace was first heated to 670 ℃ (5 ℃/min), then to 800 ℃ (1 ℃/min), and kept at 670, 750 and 800 ℃ individually for 0.5, 0.5 and 2.0 h, leading to the CaSiO3 nanowires. For the synthesis of the CaSiO3:1.2%Tb3+ nanophosphors, 0.090 mmol of Tb(NO3)3·6H2O powder was added to the above reaction system, with other conditions unchanged. To explore the effects of doping molar percentage, the amount of x% for Tb3+ in Ca2+ was simply tuned within 0.0%-1.5%.
To analyze the crystal structure of the samples, the X-ray powder diffraction (XRD, MiniFlex600, Rigaku, Japan) was used. As shown (Fig. 1(a1)), all the diffraction peaks of hydrothermal product were well matched with those of the standard Ca6Si6O17(OH)2 (JCPDS No. 23-0125), and the corresponding hydrothermal reaction can be expressed as Eq. (1).
|
(1) |

|
(2) |

|
Download:
|
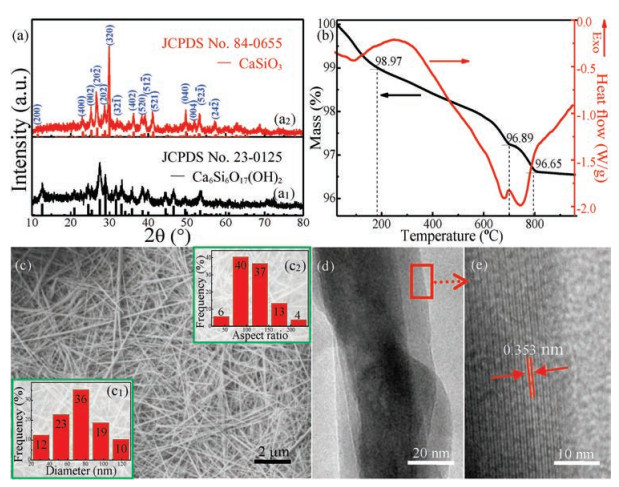
| Fig. 1. XRD patterns (a), SEM (c), TEM (d), HRTEM (e) images and TG-DSC curves (b) of the hydrothermally synthesized Ca6Si6O17(OH)2 (a1, b) and CaSiO3 nanowires (a2, c, c1, c2, d, e) obtained by subsequent thermal conversion. | |
Besides, the thermal decomposition property was detected by simultaneously recording the thermogravimetric-differential scanning calorimetric (TG-DSC) curves via a thermo-gravimetric analyzer (TGA, Netzsch STA 409C, Germany). Fig. 1(b) shows that, the sample mass decreases at a fast rate below 198 ℃, at a relatively slower rate between 198 ℃ and 600 ℃, and at a significantly faster rate between 600 ℃ and 800 ℃, and largely levels off thereafter. Decrease in the mass below 198 ℃ and 198-800 ℃ were owing to the elimination of the physically adsorbed and structural water, respectively. The latter mass loss of 2.32% is by and large in accordance with the theoretical value 2.38% for the conversion from Ca6Si6O17(OH)2 to CaSiO3 (Eq. (2)).
Simultaneously, the broad endothermic peak below 198 ℃ (DSC curve) was due to the removal of the physically adsorbed water, whereas the relatively sharp peaks at 375-800 ℃ were attributed to the removal of hydroxyl groups from Ca6Si6O17(OH)2.
As confirmed (Fig. 1(a2)), the calcined product can be readily indexed to the pure phase of CaSiO3 (JCPDS No. 86-0455). Morphologies were inspected using a field emission scanning electron microscopy (FE-SEM, JSM 6700F, JEOL, Japan) and a high resolution transmission electron microscopy (TEM, JEM-2010, JEOL, Japan). As shown (Fig. 1(c)), the uniform nanowires had diameters of 40-130 nm (78% of which within 50-110 nm, average: 75 nm, Fig. 1(c1)) and aspect ratios of 40-230 (90% of which within 60-190, average: 115, Fig. 1(c2)). The HRTEM image (Fig. 1(e)) recorded from the red dashed region (Fig. 1(d)) presented the explicit lattice fringes with an interplanar spacing of 0.353 nm, quite consistent with the standard 0.352 nm of the (002) planes. This indicates the nanowires of high crystallinity with a preferential growth parallel to the (002) planes, in accordance with the previous results [10, 16].
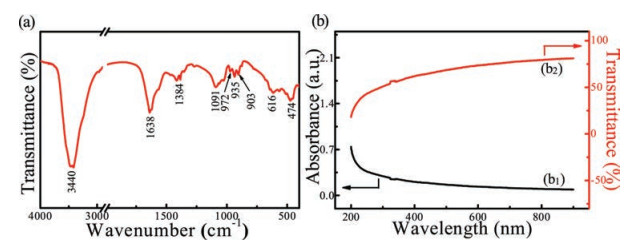
Chemical bonds were identified by a Fourier transform infrared spectrometer (FT-IR, Nexus 470, Nicolet, USA). As the FT-IR spectrum shown (Fig. 2(a)), the vibrational bands concentrated on 1600-450 cm-1. The shark bands at 3440 cm-1 and 1638 cm-1 are individually ascribed to the stretching and blending vibration of hydroxyl groups in adsorbed water on the surfaces [2], and the weak one centered at 1384 cm-1 belongs to the CO32- groups due to the long time exposure of the samples to CO2 containing air during the characterization [18, 19]. The peaks at 1091, 972, 935, 903 cm-1 are attributed to the asymmetric stretching vibration of the Si—O—Si bonds [18, 19], and the band at 972 cm-1 is also due to the stretching modes of Si—O—Ca bonds [20]. The peak at 616 cm-1 is assigned to both Si—O—Si bond bending and symmetric Si—O stretching vibrations, whereas the peak at 474 cm-1 is originated from O—Si—O bending and Ca—O stretching modes [21].

|
Download:
|
| Fig. 2. FT-IR (a) and UV–vis (b, b1, b2) spectra of the CaSiO3 nanowires. | |
Optical properties were examined using a UV-vis spectrophotometer (UV-756 CRT, Shanghai Yoke Instrument and Meter Co., Ltd., China). As presented (Fig. 2(b)), the CaSiO3 nanowires exhibit weak absorption within the wavelength of 200-900 nm (Fig. 2(b1)) and also good transparent characteristic from the ultraviolet to the visible regions (Fig. 2(b2)).
The nanowires were evaluated as potential host material for green luminescent candidate via Tb3+ doping. With the doping molar percentage changing from 0.5% to 1.5%, all the products were indexed to CaSiO3 (JCPDS No. 86-0455), whereas the crystallinity somehow decreased (Fig. 3(a)). Furthermore, the corresponding photoluminescence excitation (PLE) and photoluminescence (PL) spectra were recorded using a fluorescence spectrometer (HITACHI F-4600, Japan). Fig. 3(b) demonstrates various PL spectra for CaSiO3:x%Tb3+ nanophosphors (x = 0.5, 0.8, 1.0, 1.2, 1.5) at the excitation of 236 nm. Comparatively, the CaSiO3:1.2%Tb3+ nanophosphors exhibit the strongest emission (480-650 nm), further manifested by the dependence of green emission intensity of Tb3+ (5D4 → 7F5) at 547 nm on doping percentage (Fig. 3(b1)). The intensity first goes up and then descends dramatically after a maximum with doping percentage of 1.2%, for the concentration quenching effect [22, 23].

|
Download:
|
| Fig. 3. XRD patterns (a), photoluminescence emission (PL) spectra of the CaSiO3:x%Tb3+ nanophosphors with various doping molar percentage (b), photoluminescence excitation (PLE) and PL spectra (c) as well as SEM image (d) of the CaSiO3:1.2%Tb3+ nanophosphors. The insets (b1) and (c1) show the emission intensity as a function of doping percentage and the green luminescence from the CaSiO3:1.2%Tb3+ nanophosphors recorded using a camera, respectively. | |
Fig. 3(c) represents the PLE and PL spectra of the CaSiO3:1.2% Tb3+ nanophosphors. Under the emission of the Tb3+5D4-7F5 transition at 547 nm, the PLE spectrum exhibits a wide band centered at 236 nm, ascribed to its 4f-5d allowed transition of Tb3+ (Fig. 3(c), left) [23]. The PL spectrum excited at 236 nm exhibits several broad emission bands peaked at 492, 547, 588 and 626 nm, owing to the typical 5D4 → 7FJ (J = 6, 5, 4 and 3) transitions of Tb3+ (Fig. 3(c), right) [5, 22, 23, 24]. The strongest emission peak located at 547 nm is assigned to the 5D4-7F5 transition of Tb3+. Noticeably, the CaSiO3:1.2%Tb3+ nanophosphors emit bright green light under ultraviolet ray irradiation (Fig. 3(c1)) and exhibit well-preserved 1D morphology (Fig. 3(d)), revealing the as-obtained CaSiO3 nanowires as a promising structure and function integrated photoluminescent host candidate.
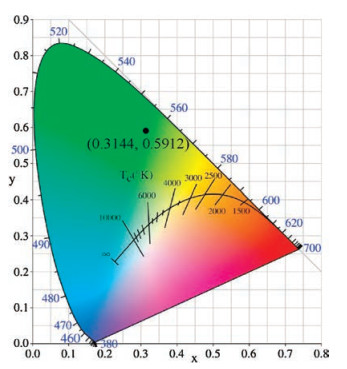
The Commission Internationale de L'Eclairage (CIE) chromaticity coordinates of the CaSiO3:1.2%Tb3+ nanowires obtained from the PL spectrum values (Fig. 3(c), right) are presented in Fig. 4. The CIE values are calculated as x = 0.3144 and y = 0.5912, which is located in the green region, highly consistent with the green light under ultraviolet ray irradiation (Fig. 3(c1)).

|
Download:
|
| Fig. 4. CIE chromaticity coordinates for the CaSiO3:1.2%Tb nanowires excited at 236 nm. | |
In conclusion, compared with traditional organic species assisted MSS or HTC route to 1D CaSiO3 nanostructures, uniform high aspect ratio CaSiO3 nanowires (diameter: 40-130 nm, aspect ratio: 40-230) have been synthesized via a facile green HTC process (200 ℃, 12.0 h; 800 ℃, 2.0 h) using abundant CaCl2·2H2O and Na2SiO3·9H2O as the raw materials, without any organic additive. The nanowires demonstrated a transparent characteristic from the ultraviolet to visible region. The CaSiO3:1.2%Tb3+ nanophosphors with well preserved 1D morphology exhibited strong green luminescence with CIE coordinates of (x = 0.3144, y = 0.5912), definitely revealing the eco-friendly high aspect ratio CaSiO3 nanowires as a promising structure and function integrated host candidate for luminescent materials via Tb3+ doping in related fields such as light display systems and optoelectronic devices.
AcknowledgmentsThis work was supported by the National Natural Science Foundation of China (No. 21276141), and the State Key Laboratory of Chemical Engineering, China (No. SKL-ChE-17A03).
| [1] |
W.C. Zhu, Y. Yang, S. Hu, et al., Inorg. Chem. 51 (2012) 6020-6031. DOI:10.1021/ic2024378 |
| [2] |
P.P. Sun, L. Xu, J. Li, et al., Chem. Eng. J. 334 (2018) 377-388. DOI:10.1016/j.cej.2017.09.120 |
| [3] |
L. Kong, H.J. Peng, J.Q. Huang, et al., Energy Storage Mater. 8 (2017) 153-160. DOI:10.1016/j.ensm.2017.05.009 |
| [4] |
J. Wu, Y.J. Zhu, S.W. Cao, F. Chen, Adv. Mater. 22 (2010) 749-753. DOI:10.1002/adma.v22:6 |
| [5] |
X.J. Kang, S.S. Huang, P.P. Yang, et al., Dalton Trans. 40 (2011) 1873-1879. DOI:10.1039/C0DT01390K |
| [6] |
M.Y. Chen, Z.G. Xia, Q.L. Liu, Inorg. Chem. 55 (2016) 11316-11322. DOI:10.1021/acs.inorgchem.6b01871 |
| [7] |
M.Y. Chen, Z.G. Xia, M.S. Molokeev, Q.L. Liu, Chem. Commun. 52 (2016) 11292-11295. DOI:10.1039/C6CC06375F |
| [8] |
K.L. Lin, C.C. Lin, Y. Zeng, RSC Adv. 6 (2016) 13867-13872. DOI:10.1039/C5RA26916D |
| [9] |
A. Chatterjee, P.S. Khobragade, S. Mishra, J. Appl. Polym. Sci. 132 (2015) 42811. |
| [10] |
W.Z. Wang, S.Y. Zhang, L.J. Wang, H.L. Shi, Mater. Sci. Eng. C 33 (2013) 2288-2293. DOI:10.1016/j.msec.2013.01.060 |
| [11] |
K.L. Lin, J. Chang, J.X. Lu, Mater. Lett. 60 (2006) 3007-3010. DOI:10.1016/j.matlet.2006.02.034 |
| [12] |
X.K. Li, J. Chang, Chem. Lett. 33 (2004) 1458-1459. DOI:10.1246/cl.2004.1458 |
| [13] |
H.Q. Ling, Q. Liu, C.K. Chang, D.L. Mao, Chem. Lett. 36 (2007) 1090-1091. DOI:10.1246/cl.2007.1090 |
| [14] |
J. Wu, Y.J. Zhu, G.F. Cheng, Y.H. Huang, Mater. Res. Bull. 45 (2010) 509-512. DOI:10.1016/j.materresbull.2009.10.006 |
| [15] |
L. Pei, L. Yang, Y. Yang, et al., Mater. Charact. 61 (2010) 1281-1285. DOI:10.1016/j.matchar.2010.07.002 |
| [16] |
K.L. Lin, J. Chang, G.F. Chen, M.L. Ruan, C.Q. Ning, J. Cryst. Growth 300 (2007) 267-271. DOI:10.1016/j.jcrysgro.2006.11.215 |
| [17] |
W.C. Zhu, L. Xiang, Q. Zhang, et al., J. Cryst. Growth 310 (2008) 4262-4267. DOI:10.1016/j.jcrysgro.2008.06.072 |
| [18] |
K.L. Lin, M.L. Zhang, W.Y. Zhai, H.Y. Qu, J. Chang, J. Am. Ceram. Soc. 94 (2011) 99-105. DOI:10.1111/j.1551-2916.2010.04046.x |
| [19] |
M. Mehrali, S.F. Shirazi, S. Baradaran, et al., Ultrason. Sonochem. 21 (2014) 735-742. DOI:10.1016/j.ultsonch.2013.08.012 |
| [20] |
S.M. Li, N. Jia, J.F. Zhu, M.G. Ma, R.C. Sun, Carbohydr. Polym. 80 (2010) 270-275. DOI:10.1016/j.carbpol.2009.11.024 |
| [21] |
A.S. Luyt, M.D. Drami canin, Ž. Anti c, V. Djokovi c, Polym. Test. 28 (2009) 348-356. DOI:10.1016/j.polymertesting.2009.01.010 |
| [22] |
X.P. Chen, L.L. Zhang, Z.Q. Zhang, L. Zhu, W.C. Zhu, CrystEngcomm 17 (2015) 7856-7865. DOI:10.1039/C5CE01273B |
| [23] |
K. Li, M.M. Shang, D.L. Geng, et al., Inorg. Chem. 53 (2014) 6743-6751. DOI:10.1021/ic500545y |
| [24] |
A.A. Ansari, Chin. Chem. Lett. 28 (2017) 651-657. DOI:10.1016/j.cclet.2016.10.010 |