 2019, Vol. 30


b Key Laboratory of Functional Materials and Devices for Special Environments, Xinjiang Technical Institute of Physics & Chemistry, Chinese Academy of Sciences, Urumqi 830011, China;
c Guangdong Guanghua Sci-Tech Co., Ltd., Shantou 515061, China;
d College of Chemistry, State Key Laboratory Inorganic Synthesis & Preparative Chemistry, Jilin University, Changchun 130012, China
Chemical oxygen demand (COD) is one of the most important parameters and has been widely employed for water quality assessment. The standard method for COD determination, the K2Cr2O7 method, requires reflux over a long period of time under high temperature to achieve adequate oxidation and also results in the consumption of expensive (Ag2SO4), corrosive (H2SO4), and toxic(Hg2+ and Cr2O72-) chemicals [1].Inan attempt to shorten the time required for analysis, modified K2Cr2O7 methods have been developed based on microwave-assisted oxidation [2] or ultrasound-assisted oxidation [3]. However, the secondary pollution is unavoidable when the standard method is employed.
Recently, great efforts have been devoted to the development of rapid, accurate, and environmentally friendly methods for the determination of accurate COD values [4-12], such as electrochemical methods using nano-PbO2 modified electrode [4], boron-doped diamond sensor [5], or composite planar electrode [6], and photocatalytic and photoelectrocatalytic methods based on TiO2 nanomaterial sensors [7-12]. However, these methods cannot be satisfied. For example, the nano-PbO2 modified electrodes pose the risk of the potential release ofhazardous Pb during the preparation [4]. Extensive research has shown that TiO2 is an excellent material for photodegradation of organic pollutants in water. The TiO2 nanomaterial is non-toxic, inexpensive, photosensitive, photo-stable, and environmentally friendly.
The main disadvantage of TiO2-based photocatalytic methods in practical applications is the easy recombination of the photo-generated electron/hole pairs in discrete TiO2 nanoparticles and coated nanofilms, which results in lower photocatalytic activity. For the determination of COD value, this implies a narrow dynamic working range and relatively poor reproducibility [12]. Compared with traditional analytical methods, the photoelectrocatalytic degradation approach is more effective because of the suppression of photohole and photoelectron recombination. However, the preparation processes of TiO2 nanoparticle by sol-gel method are time consuming under high pressure and temperature [7-10]. And the structural disorders may hinder efficient electron transport [13]. Recently great interesting has paid to the investigation of TiO2 nanotube array (TiO2NA) electrode [11, 12, 14]. The ordered architecture of TiO2NA can provide a unidirectional electronic channel and reduce the grain boundaries. The TiO2NA shows a stronger attachment to the parent titanium substrate and a better photo-electrocatalytic activity owing to the improved electron transport and reduced charge recombination. Nevertheless, the TiO2NA sensors show unsatisfactory photocatalytic activity, shorter lifetime, and inferior stability in practical application for COD assay.
Consequently, it is necessary to develop new methods to compensate the shortcomings of present TiO2 sensors. Metal- and nonmetal-doping of TiO2 have been proved to be effective ways to enhance photocatalytic activity [15]. For example, it was reported that Au/TiO2 nanocomposites or TiO2-supported Au nanoparticles (AuNPs) enhanced photocatalytic activity byembedded AuNPs into TiO2 gel-sol or nanofilms [16]. For example, AuNPs embedded within the framework of TiO2 may enhance light absorption and improve quantum efficiency during the photocatalytic processes [16]. Therefore, we try to modify the TiO2NA by AuNPs (AuNP- TiO2NA) to improve the sensitivity, stability, and lifetime of TiO2NA sensor. The as-prepared sensor was characterized by scanning electron microscope (SEM), X-ray photoelectron spectroscopy (XPS), X-ray diffraction (XRD), and electrochemical impedance spectroscopy (EIS). The performance of pure TiO2NA and AuNP- TiO2NA sensor for COD determination was also compared.
In this paper, we conducted the experiment to prepare the TiO2NA and AuNP-TiO2NA sensor by the following methods. The 0.25-mm-thickTi foil (1 cm × 5 cm) is anodized at 20 V in 0.5wt% HF solution, according to the method proposed by Liu et al. The voltage is applied by a DC power supply (Model SK1730SL, Sanke, China). Prior to anodization, the Ti foil is chemically etched by immersing in a mixture of HF and HNO3 for 30 s (the mixture ratio of HF:HNO3:H2O is 1:4:5 in volume) followed by sonicating in acetone, ethanol, and water for 5 min, respectively. The crystallization of TiO2 is realized by annealing the as-prepared foil at 500 ℃ under ambient air for 3 h. AuNP-TiO2NA sensor is prepared by electrodeposition of AuNPs at the TiO2NA in 0.05 mol/L H2SO4 + 5.0 mmol/L HAuCl4 solution at 0 V under sonicating.
The SEM (JEOL Ltd., Japan) is used to characterize the TiO2NA and AuNP-TiO2NA film surface. Fig. 1 shows the SEM images of the highly ordered TiO2NA film with and without AuNPs. It is observed that high-density, well-ordered, and uniform TiO2NA is synthesized by the electrochemical anodic oxidation of pure titanium foil. The tops of the tubes are open, the diameters of these nanotubes range from 60 nm to 80 nm with wall thickness of about 16 nm and length of 350-380 nm. After electrodeposition under sonication, the AuNPs with average diameter (3 ± 2)nm are uniformly distributed in TiO2 nanotubes or walls, as shown in Fig. 1c. Moreover, the surface of the the TiO2NA and AuNP-TiO2NA film was translated into 3D frameworks as shown in Figs. 1d-f, which promote the discussion furthermore.

|
Download:
|
| Fig. 1. SEM images of TiO2NA film: (a) top and (d) three-dimensional simulation, (b) cross-section view and (e) three-dimensional simulation of TiO2NA; (c) top view and (f) three-dimensional simulation of AuNP-TiO2NA film (diameter (3 ± 2)nm) showing dispersion of the particles. | |
We further analyzed AuNP-TiO2NA film surface composition using XPS. It is well known that XPS is a valuable technique for detecting the surface composition of samples. XPS measurement is performed on an ESCALAB-MKII spectrometer (VG Co., UK) with an Al Kα X-ray radiation as the X-ray source for excitation and a chamberpressure of3.5 × 10-7Pa. Fig.S1 (Supporting information) presents the XPS spectra of AuNP-TiO2NA Ti 2p, O 1s, Au 4f. In Fig. S1a, the two peaks at 458.7 eV and 464.1 eV are assigned to the Ti 2p3/2 and Ti 2p1/2 states in TiO2, respectively. The doublet peaks are due to the spin-orbit splitting ofTi 2p and separated by 5.4 eV. Both of the peaks are in good agreement with those of pure anatase TiO2. The peak at binding energy of 529.95 eV corresponds to bulk oxygen bonded to titanium. In Fig. S1c, the two peaks at 84.0 eV and 87.7 eV can be assigned to Au 4f7/2 and Au 4f5/2. The XPS result indicates that the Au species are present in the metallic state.
Moreover, we studied the crystalline nature of the AuNP- TiO2NA surface using XRD (Philips X-ray diffractometer, model PW1700 BASED, Cu Ka radiation λ = 1.5406 Å), as shown in Fig. S1d. The diffraction peaks at about 2θ = 25.4°, 48.1° can be indexed to the (101) and (200) crystal faces of anatase TiO2. The other diffraction peaks at about 2θ = 38.5° and 40.3° can be indexed to the titanium substrate. The peak at 2θ = 44.5° is assigned to the (200) plane of electrodeposited AuNPs at TiO2NA surface [16]. The diameter of AuNPs can be calculated according to the Scherrer equation: d (Å) = κλ/βcosθ, where κ is a coefficient (0.9), λ = the wavelength of X-ray used (1.54 nm), β = the full-width half-maximum of respective diffraction peak (rad), θ = the angle at the position of peak maximum (rad). The diameter of AuNPs is about 3 nm according to the Scherrer's equation, which is consistent with the result obtained by the SEM image.
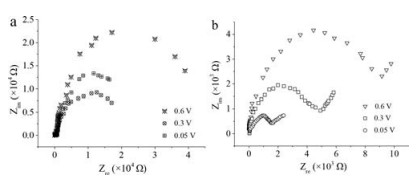
After understanding its basic appearance and composition, we conducted photoelectrochemical test. An appropriate positive bias potential to the working electrode plays an important role in photoelectrocatalytic reactivity. Fig. 2 compares EIS of the TiO2NA sensor with and without AuNPs. EIS measurements are carried out with an Autolab/PG30 electrochemical analyzer system (ECO Chemie B.V., Netherlands) in a grounded Faradaycage. The Nyquist plots show the TiO2NA and AuNP-TiO2NA sensor in the presence of 0.10 mol/L ferri/ferrocyanide redox couple in a 0.10 mol/L KCl solution under different bias potentials with UV illumination. The plots reveal that Rct are increased as the applied potential increased. For example, Rct of the TiO2NA sensor at the anodic potential of 0.05 V, 0.3 V, and 0.6 V are ca. 22.41, 28.43, and 40.9 kΩ, respectively. The diagrams of AuNP-TiO2NA sensor are similar, including a semicircle part and a straight line part. The semicircle at high frequencies is characteristic of the charge transfer process and the linear part at low frequencies corresponded to the diffusion-controlled step [17]. The Rct of the AuNP-TiO2NA sensor are also increased from ca. 1.59 kΩ (at 0.05 V) to 4.66 kΩ (at 0.3 V), and to 9.0 kΩ (at 0.6 V). The AuNP-TiO2NA sensor exhibited much lower resistance than that of TiO2NA sensor under the same conditions, which can be attributed to the deposited AuNPs could improve quantum efficiency and the charge transfer processes of TiOgNA sensor. Meanwhile, AuNPs embedded within the framework may also serve as an electric conductor, which facilitates photoelectron transfer to pore surface and further reduce the probability of charge recombination. Consequently, the recombination center of photogenerated carriers was diminished and the separation effect of them was improved. As is shown in Fig. 2, the bias potential of 0.05 V is enough to separate photoelectrons and photoholes. Such a low potential could diminish side reaction during the photoelectrocatalysis such as photolysis of H2O. Therefore, 0.05 V is selected for COD determination.

|
Download:
|
| Fig. 2. Nyquist diagrams plots (Zim vs. Zre) for TiO2NA (a) and AuNP-TiO2NA (b) sensor in the presence of 0.10 mol/L ferri/ferrocyanide redox couple in a 0.10 mol/L KCl solution with UV illumination under different bias potentials. | |
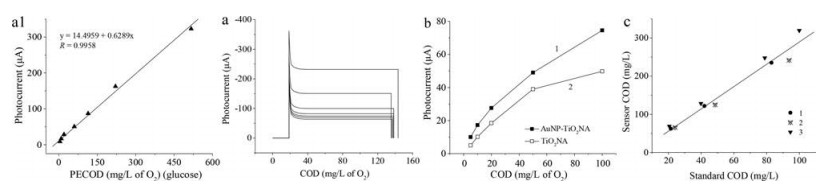
Finally, a series of standard glucose solutions of different COD values were checked with the AuNP-TiO2NA sensor (Fig. 3a). The photocurrent was linear in relation to the COD value in the range from 5 mg/L to 100 mg/L. The calibration curve was y=7.728 + 0.8010x, R = 0.9945, where x and y were the values of COD (mg/L), as shown in Fig. 3a1. The detection limit was 5 mg/L based on three times the standard deviation of the baseline. The AuNP-TiO2NA sensor exhibits lower background photocurrent, higher photoelectrocatalytic activity, and wider linear range than those of TiO2NA sensor under same conditions. The photocurrent of AuNP-TiO2NA (Fig. 3b, curve 1) is higher than those of pure TiO2NA electrode (Fig. 3b, curve 2) toward the oxidation of standard glucose solutions. To compare the stability of the TiO2NA and AuNP-TiO2NA sensor, ten successive photocurrent data with and without organics were achieved. The relative standard deviations (RSDs) were 3.90% and 0.50% for TiO2NA and AuNP- TiO2NA sensor without any organics in the solution, and the RSDs were 4.00% and 0.61% for TiO2NA and AuNP-TiO2NA sensor in the presence of 5 mg/L O2 of glucose, respectively. The AuNP-TiO2NA sensor exhibited better stability under the same conditions. The long-term stability of the AuNP-TiO2NA sensor was tested over a 30-day period. During this period, the slope change of calibration curve was 5.60%. The RSD obtained for successive measurements of 20 mg/L O2 glucose solution was 7.81%. Excellent stability may be attributed to strong attachment between deposited AuNPs and TiO2NA of as-prepared sensor.

|
Download:
|
| Fig. 3. The calibration curve of photocurrent obtained from glucose standard solutions of different COD values at AuNP-TiO2NA (a1). Photocurrent obtained from glucose standard solutions of different COD values at AuNP-TiO2NA (a) and comparison of TiO2NA and AuNP-TiO2NA(b) sensors, respectively. (c) The result correlation between the as- proposed sensor method and the standard dichromate method for different real samples. 1-3 are the samples collected from Southlake of Changchun, wastewater treatment plants, and food factory and diluted to different concentrations, respectively. | |
In the meanwhile, we also tested the actual wastewater samples. Wastewater samples are collected from Southlake of Changchun, wastewater treatment plants, and food factory according to the guidelines of the standard method [18]. Standard addition method is used to determine the COD value of the samples. The results are also compared with the standard K2Cr2O7 method. The result correlation between the two methods is shown in Fig. 3c. A highly significant correlation (y = 2.916x - 2.666, R = 0.9890, P < 0.0001, n=10) between the two methods was obtained, where x and y are the results obtained by using K2Cr2O7 method and the proposed method, respectively. The RSD obtained from the two methods for CODs are less than 5%, the results indicate that the two methods are compatible well. The proposed method is valid for the determination of COD in real samples, though the COD values of real samples determined by AuNP- TiO2NA sensor are about three times (2.916) higher than of the standard K2Cr2O7 method.
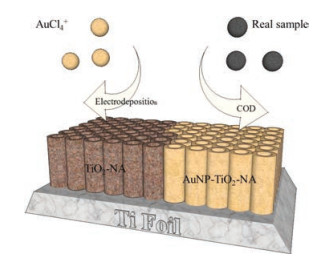
In summary, Au nanoparticles modified TiO2 nanotube array electrode was facilely prepared via simple electrodeposition process, offering more probability to regulate the morphology and constituent, as shown in Fig. 4. After applying as chemical oxygen demand (COD) sensor, the unique electrode shows effective impact in waste water. The method proposed is so simple, fast, cost effective, and environmental friendly that will provide train of thought for further research.

|
Download:
|
| Fig. 4. The sketch of whole process from facile preparation to effective application. | |
Acknowledgments
This work was supported by the National Key Research and Development Program of China (No. 2016YFC1102802) and Guangdong Innovative and Entrepreneurial Research Team Program (No. 2013C092).
Appendix A. Supplementary dataSupplementary data associated with this article can be found, in the online version, at https://doi.org/10.1016/j.cclet.2018.01.049.
| [1] |
Y. Choi, M.S. Koo, A.D. Bokare, et al., Environ. Sci. Technol. 51 (2017) 3973-3981. DOI:10.1021/acs.est.6b06303 |
| [2] |
M.H. Yeh, P.H. Chen, Y.C. Yang, et al., ACS Appl. Mater. Interfaces 9 (2017) 10788-10797. DOI:10.1021/acsami.6b13070 |
| [3] |
Y. Sun, Nanoscale 2 (2010) 1626-1642. DOI:10.1039/c0nr00258e |
| [4] |
J. Lee, P. Lee, H. Lee, et al., Nanoscale 4 (2012) 6408-6414. DOI:10.1039/c2nr31254a |
| [5] |
J. Zhao, H. Sun, S. Dai, et al., Nano Lett. 11 (2011) 4647-4651. DOI:10.1021/nl202160c |
| [6] |
H.Q. Chen, R.F. Zhao, B. Wang, et al., Nanoimpact 8 (2017) 80-88. DOI:10.1016/j.impact.2017.07.005 |
| [7] |
F. Forato, S. Talebzadeh, B. Bujoli, et al., ChemistrySelect 2 (2017) 769-773. DOI:10.1002/slct.201601788 |
| [8] |
D.M. Tobaldi, M.J. Hortiguela, G. Otero, et al., Langmuir 33 (2017) 4890-4902. DOI:10.1021/acs.langmuir.6b04474 |
| [9] |
B. Krishnan, S. Mahalingam, Adv. Power Technol. 28 (2017) 2265-2280. DOI:10.1016/j.apt.2017.06.007 |
| [10] |
K.S. Dibya, M.X. Marilyn, P.V. Vandana, et al., New. J. Chem. 41 (2017) 6445-6454. DOI:10.1039/C7NJ00495H |
| [11] |
M.X. Xu, Y.H. Wang, J.F. Geng, et al., Chem. Eng. J. 307 (2017) 181-188. DOI:10.1016/j.cej.2016.08.080 |
| [12] |
P. Khwanmuang, P. Rotjanapan, A. Phuphuakrat, et al., React. Funct. Polym. 117 (2017) 120-130. DOI:10.1016/j.reactfunctpolym.2017.06.012 |
| [13] |
E.S. Abamor, A.M. Allahverdiyev, M. Bagirva, et al., Acta Trop. 169 (2017) 30-42. DOI:10.1016/j.actatropica.2017.01.005 |
| [14] |
K. Saito, K. Setoura, S. Lto, et al., ACS Appl. Mater. Interfaces 9 (2017) 11064-11072. DOI:10.1021/acsami.7b01457 |
| [15] |
X.L. Wang, B. Zhao, P. Li, et al., J. Phys. Chem. C 121 (2017) 5145-5153. DOI:10.1021/acs.jpcc.7b00153 |
| [16] |
Y. Choi, H. Kim, G.H. Moon, et al., ACS Catal. 6 (2016) 821-828. DOI:10.1021/acscatal.5b02376 |
| [17] |
J.Y. Chu, P. Miao, X.J. Han, et al., ChemCatChem 8 (2016) 1819-1824. DOI:10.1002/cctc.v8.10 |
| [18] |
M. Atarod, M. Nasrollahzadeh, S.M. Sajadi, J. Colloid Interf. Sci. 462 (2016) 272-279. DOI:10.1016/j.jcis.2015.09.073 |