 2019, Vol. 30


b Beijing Key Laboratory of Microanalytical Methods and Instrumentation, Department of Chemistry, Tsinghua University, Beijing 100084, China
Matrix-assisted laser desorption/ionization mass spectrometry (MALDI-MS), first introduced in the late 1980s as a soft ionization technique [1, 2], provides a simple, high throughput analytical method for high molecular weight species and has been used extensively in various biochemical study [3, 4]. The obvious advantage of MALDI-MS is its tolerant to buffer, salt, and other additives in the sample, and greatly reduces analysis time. Organic matrix is commonly used to promote analyte ionization, but more recent efforts have been devoted to finding alternative matrices to overcome some of the limitations associated with organic matrices, such as low m/z interference and point-to-point signal heterogeneity. Nanomaterials including carbon nanotube [5], graphene [6], gold [7], silver, silicon [8], iron oxide, titanium dioxide [9] and zinc oxide nanoparticles have been widely investigated as an alternative matrix for MALDI-MS as a way of minimizing low m/z interference. And nanomaterial have also been used as pre-enrichment materials for concentrating analytes to enhance MALDI-MS signals [10].
Many studies have explored how to dry nanoparticles uniformly on the surface as a means of improving signal homogeneity in traditional dried droplet approach to MALDI samples preparation. It is known that nanomaterials will accumulate a ring spot when depositing onto a surface via a phenomenon known as the "coffee ring" effect [11]. The formation of it depends on many variables, including nanoparticle size, chemical surface [12] and temperature [13]. This coffee-ring effect occurs as suspended particles and solute are carried to the outer edge of the spot due to capillary flow in the drying sample. These flows, known as Marangoni flows, are typically the cause of the heterogeneity observed in traditional MALDI spots, and several creative approaches [14] have been explored to surmount this obstacle.
Membrane separation method is characterized by a fast solidliquid separation [15] method with its filter principle [16] being widely studied. The uniform distribution of contaminants on the membrane surface factors into the filtration performance.
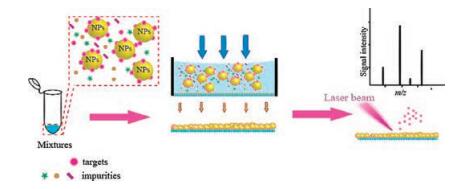
Here, we describe a method of depositing nanoparticles through membrane separation method using disposable porous membrane as mass plate to improve sample spot uniformity (Fig. 1). Carbon nanotubes (CNTs) [17] are highly surface area material with negative zeta potential and easy to capture oppositely charge analytes through electrostatic interaction. Therefore, it may also serve as a marvelous pre-enrichment material [18] for capturing protein molecules. We found that the nanoparticles can be uniformly and rapidly deposited on the surface of porous mass plate through the membrane separation process. Due to the enrichment of the nanoparticles and the uniformity of the sample spots, the strength and uniformity of the analytical signal are improved.

|
Download:
|
| Fig. 1. Schematic illustration of MALDI MS detection based on the combination of membrane separation technology and nanomaterial applications to rapid detection of biomolecules. | |
In all experiment: Polycarbonate filter membrane with a nominal pore size of 0.8 mm was bought from Merck Millipore (Germany). CNTs were purchased from Aladdin (Shanghai, China). Sodium hydroxide, citric acid (CA), ammonium citrate and sodium chloride were obtained from Beijing Chemical Reagent Co. (Beijing, China). Peptides of KCRKA and KCKRTR were obtained from Bank peptide (Hefei, China). Cytochrome C was purchased from Harveybio Co. (Beijing, China). Insuli was purchased from Solarbio Co. (Beijing, China). The MALDI matrix α-cyano-4-hydroxycinnamic acid (CHCA), 3, 5-dimethoxy-4-hydroxycinn amic acid (SA) and 2, 5-dihydroxybenzoic acid were purchased from SigmaAldrich (U.S.A.). Trifluoroacetic acid was purchased from SigmaAldrich (U.S.A.). Purified water was produced by Wahaha Group (Hangzhou, China). All chemicals were purchased at the highest purity grade available and were used without further purification. CNTs suspension according to previously reported protocol [17] with a slight modification. In brief, pristine CNTs (3 mg) were dispersed in 1 mL CA aqueous solution (100 mmol/L) by ultrasonication for 5 min to disperse the CNTs well. Each CHCA (10 mg/mL), SA (10 mg/mL) and DHB (10 mg/mL) matrix was dissolved in a mixture of ACN and 0.1% aqueous TFA (1/2, v/v). All the authentic standard compounds were weighed accurately and then dissolves in deionized water and diluted with proper solvents by different ratios for proper concentrations.
Microscopic image of the sample spot was recorded using a Spinning Disk (PerkinElmer, U.S.A.). Porous membrane was modified through ion sputtering instrument (Hitachi, Japan). MALDI-TOF-MS analysis was performed on CLIN-TOF-Ⅱ instrument (Beijing Bioyong, China). Each mass spectrometer uses a 337 nm nitrogen laser for desorption. The acceleration voltage was 20 kV, and the vacuum pressure in the ion source was (3-5) × 10-6 Torr. Data were acquired in a positive linear mode and evaluated by using the mass spectrometry software (Shimadzu Biotech., Japan).
In the search for the disposable and porous as required for separation and MALDI-TOF-MS analysis, the modified commercial polycarbonate filter membrane turned out to be our choice. The form of polycarbonate filter membrane was given by etching on the surface of a polycarbonate film which features smooth and neat surface with precisely uniform pore. Through ion sputtering, a 5 nm-thick gold film was deposited on as required for separation and MALDI-TOF-MS analysis, the modified commercial polycarbonate filter membrane turned out to be our choice. The form of polycarbonate filter membrane was given by etching on the surface of a polycarbonate film which features smooth and neat surface with precisely uniform pore. Through ion sputtering, a 5 nm-thick gold film was deposited on the filter to add better electrical conductivity to the surface. We applied gold-plated filter membrane as a disposable MALDI plate and sample preparation was done quickly by solid-liquid separation.
As current MALDI-TOF-MS detection mainly relies on reusing metal mass plate, its manual cleaning act as not only timeconsuming work, but also a high residual risk. We apply goldplated filter membrane as a disposable MALDI plate where a good number of 800 nm circular pores evenly distributed on its surface. For this reason, particles over 800 nm will be trapped on its surface during the separation. Then is further detected by MALDI-TOF-MS analysis. Comparatively, the porous plate is a cheap, clean and stable disposable mass plate that makes rapid sample preparation and accurate mass spectrometry detection available, which could provide a strong support for rapid analysis.
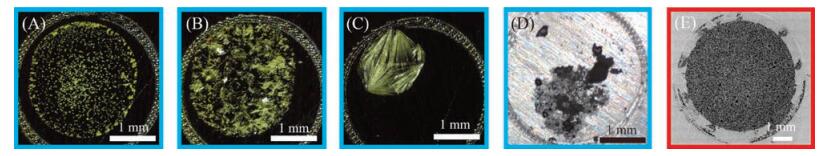
As the results shown in Fig. 2, during the course of conventional drying, the contact line is pinned and cannot receded, and solvent lost by evaporation at the droplet's edge must be replaced by solvent drawn from the center of the droplet. So the drop diameter remains constant and the contact angle decreases during evaporation. The flow that brings fluid from the center to the edge of the droplet also carries solute, which is the final formation of cyclic deposit. In contrast, by a way of direct solid-liquid separation, the mixture is allowed to pass through the porous target plate vertically under the pressure difference.

|
Download:
|
| Fig. 2. Sample spots obtained by traditional drying method of different matrix: CHCA (A), SA (B), 2, 5-DHB, CNTs (D), and by membrane separation method (E). | |
Nanomaterials with adsorption of target sample are trapped by a porous plate, solvent is rapidly separated from the sample under pressure and drive through the target. This process takes only a few seconds. Figs. 2A-D show that the conventionally dried sample spots consisting of rather large isolated crystallization that are sometimes partially freely distributed. By contrast, when we dried the sample through the membrane separation using a porous membrane, we would get a uniform sample spot (Fig. 2E).
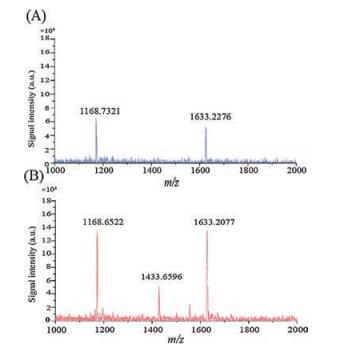
For testifying the increase of signal intensity, we compared the sample MALDI spectra of dried spots obtained at arbitrary location from membrane separation samples (blue curves) and natural dried samples (red curves). The observed increase in signal intensity was confirmed upon recording actual MALDI spectra. Fig. 3 illustrates the signal intensity of peptides before and after using CNTs as adsorbent to enrich peptides. As it clearly seen, after enrichment the signal from the mastoparan, insulin and cytochrome C signals were significantly enhanced. We employed low concentration of cytochrome C tryptic digest products to demonstrate the feasibility of this application. Fig. 4 presents that our method enhances the signal of cytochrome C tryptic digest products. Fig. 4A presents the MALDI mass spectrum of cytochrome C digest product prior to enrichment. Only peaks at m/z 1168.7321 and 1633.2276 are observed, while Fig. 4B presents that more digest products peaks can be obtained and the intensity of the signal increased.

|
Download:
|
| Fig. 3. MALDI mass spectra for various samples before (red) and after enrichment (blue). (A) mastoparan, (B) insulin, and (C) cytochrome C. | |

|
Download:
|
| Fig. 4. MALDI mass spectra of cytochrome C tryptic digest product. CHCA (A) and CNTs (B) were used as matrix, respectively. The mass peak observed of 1168.73, 1433.65 and 1633.22 were peptides of TGPNLHGLFGR, HKTGPNLHGLFGR and IFVQKCAQCHTVEK. | |
To characterize the efficiency and uniformity of MALDI-MS preparation techniques, we recorded the signal variation of insulin for eight precise sites on dried sample spots. Consistent with the non-uniform distribution of the samples seen in the optical images, the signal distribution of the sample spots of the conventionally dried samples is very uneven and requires the search for "sweet spots". And as expected, Fig. 5 confirms that membrane separation improves the signal strength and uniformity drastically without a time-consuming search for a sweet spot. Wherever the laser is directed onto the uniform sample spot, intense MALDI spectra can be obtained. We collected MALDI images of peptide of KCRKA dried by membrane separation and conventional method. As it is seen from Fig. 5 that membrane separation dried samples are much more homogeneous than in the case of conventional dried samples. Comparison to the conventional dried samples shows that the mass peak obtained is the same as the one dried by conventional method in chemically identical aspect. As expected, based on the purely physical character of the method, membrane separation method therefore does not generate additional interfering peaks, unlike other enhancement methods that require additives.

|
Download:
|
| Fig. 5. Typical profile of the signal variation of peptide of KCRKA (100 pmol/L) for 7 individual spot through (A) conventional drop drying process and (B) membrane separation method. | |
In conclusion, we describe a novel sample preparation method based on the combination of membrane separation technology and nanomaterial applications to optimize MALDI detection of biomolecules. For peptides and protein biomolecules, the enhanced signals and improved signal homogeneity have been demonstrated. The method is convenient, fast, effective, and has great potential for practical application in the future.
AcknowledgmentThis work was supported by the National Natural Science Foundation of China (Nos. 21435002, 21621003).
| [1] |
M. Karas, F. Hillenkamp, Anal. Chem. 60 (1988) 2299-2301. DOI:10.1021/ac00171a028 |
| [2] |
K. Tanaka, H. Waki, Y. Ido, et al., Rapid Commun. Mass Spectrom. 2 (1988) 151-153. DOI:10.1002/(ISSN)1097-0231 |
| [3] |
T. Wu, X.H. Yang, C.J. Zhang, Z.P. Wang, Y.P. Du, Chin. Chem. Lett. 27 (2016) 901-904. DOI:10.1016/j.cclet.2016.02.020 |
| [4] |
Z. He, Q. Chen, F. Chen, et al., Chem. Sci. 7 (2016) 5448-5452. DOI:10.1039/C6SC00215C |
| [5] |
C. Köhler, A. Peterson, L.G. Eriksson, E. Okuno, R. Schwarcz, J. Am. Soc. Mass Spectrom. 16 (2005) 263-270. DOI:10.1016/j.jasms.2004.11.005 |
| [6] |
B. Gulbakan, E. Yasun, M.I. Shukoor, et al., J. Am. Chem. Soc. 132 (2010) 17408-17410. DOI:10.1021/ja109042w |
| [7] |
Y.F. Huang, H.T. Chang, Anal. Chem. 78 (2006) 1485-1493. DOI:10.1021/ac0517646 |
| [8] |
X. Li, M. Wilm, T. Franz, Proteomics 5 (2005) 1460-1471. DOI:10.1002/(ISSN)1615-9861 |
| [9] |
M.C. Wang, Y.H. Lee, P.C. Liao, Anal. Bioanal. Chem. 407 (2015) 1343-1356. DOI:10.1007/s00216-014-8352-0 |
| [10] |
C.T. Chen, W.Y. Chen, P.J. Tsai, et al., J. Proteome. Res. 6 (2007) 316-325. DOI:10.1021/pr0604460 |
| [11] |
R.D. Deegan, O. Bakajin, T.F. Dupont, et al., Nature 389 (2012) 827-829. |
| [12] |
P. Takhistoy, H.C. Chang, Ind. Eng. Chem. Res. 41 (2002) 6256-6269. DOI:10.1021/ie010788+ |
| [13] |
D. Soltman, V. Subramanian, Langmuir 24 (2008) 2224-2231. DOI:10.1021/la7026847 |
| [14] |
P. J. Yunker, T. Still, M.A. Lohr, A.G. Yodh, Nature 476 (2011) 308-311. DOI:10.1038/nature10344 |
| [15] |
X. Kong, S. Sahadevan, Anal. Chim. Acta 659 (2010) 201-207. DOI:10.1016/j.aca.2009.11.037 |
| [16] |
A. Grenier, M. Meireles, P. Aimar, P. Carvin, Chem. Eng. Res. Des. 86 (2008) 1281-1293. DOI:10.1016/j.cherd.2008.06.005 |
| [17] |
L. Jiang, G. Lian, Carbon 41 (2003) 2923-2929. DOI:10.1016/S0008-6223(03)00339-7 |
| [18] |
W.Y. Chen, L.S. Wang, H.T. Chiu, Y.C. Chen, C.Y. Lee, J. Am. Soc. Mass Spectrom. 15 (2004) 1629-1635. DOI:10.1016/j.jasms.2004.08.001 |