 2019, Vol. 30


b School of Pharmaceutical Sciences, Jilin University, Changchun 130021, China;
c The Central Laboratory, Changchun Normal University, Changchun 130032, China
Ambient fine particulate matter (PM2.5) refers to the inhalable particle aerodynamic diameter less than or equal to 2.5 μm, also is known as fine particles or particles which can be inhaled into the lungs [1, 2]. PM2.5 derives from both natural and anthropogenic sources, resulting in a complex chemical composition. At present, the main ingredients of PM2.5 include sulfates, nitrates, ammonium salts, carbonaceous particles (including elemental carbon and organic carbon, in which, elemental carbon is mainly produced in high temperature combustion processes, organic carbon is mainly derived from the relatively low temperature combustion process), metal particles, minerals and so on [3, 4]. The research showed that PM2.5 had obvious toxic effect, which could cause extensive damage of many aspects of the body such as respiratory system, immune system, endocrine system, cardiovascular system, etc. However, the exact pathogenic mechanism of PM2.5 is not known as yet.
The physiological or pathological perturbation in a living system will cause the perturbations of concentration or flux of endogenous metabolites. Metabonomics has been proved to be an important and valuable tool in analyzing biosamples. Due to the complexity of molecular species and its concentration in the range of metabolic group contains, any single technique is not sufficient to conduct a comprehensive study of a particular object. With the development of the new analysis techniques, a series of technologies such as gas chromatography-time of flight mass spectrometry (GC-TOF-MS) and ultra performance liquid chromatography coupled with quadrupole time-of-flight mass spectrometry (UPLC-Q-TOF-MS), and other analytical chemistry techniques for comprehensive metabolomics analysis were used these days. Among these techniques, UPLC-Q-TOF-MS was widely used in the analysis of metabolomics due to the availability of accurate mass numbers of compounds, accurate isotopic abundance and abundant mass spectral information [5-7].
In this study, a urinary metabonomics method based on UPLCQ-TOF-MS combined with CG principal component analysis (PCA) was developed to find the effect of PM2.5 on rat urinary metabolism profile. By detecting the changes in urinary metabonomics of rats which were exposured ambient PM2.5 for shortterm, the impacts on possible metabolic pathways and early biological markers were studied to explore for the toxic mechanism which ambient PM2.5 damage to the body. The research results have provided the useful information for the effective prevention and controlling environmental pollution which is caused by fine particles damage to the human body.
Thirty male SD rats with weights ranged from 200 g to 240 g, obtained from Experimental Animal Center of Jilin University (China), were randomly divided into the control group (CG) and PM2.5 model group (MG). The solution of saline and fine particular matter were injected into the trachea of rats respectively, twice a week, after the injection, the rats were upright and rotated immediately so as to make the particulate matter as evenly to be distributed as possible. They were injected two times a week for four weeks. The animal model established method of PM2.5 exposure is based on relevant literature [1].
Sample collection and preparation process protocol were described as fellow: Samples of 24-h urine were collected on the 14th day after injection and stored at -80 ℃. Prior to UPLC-MS analysis, urine samples were thawed at 4 ℃. After centrifuging at 10, 000 rpm for 10 min, the supernatant was diluted at a ratio of 1:2 with water, and then filtered through a 0.22 μm filter membrane.
The UPLC-MS conditions were performed using a Waters Acquity UPLC system coupled with a Q-TOF SYNAPT G2 High Definition Mass Spectrometer (HDMS) (Waters, UK). Separation was performed on a Waters ACQUITY UPLC BEH C18 Column (1.7μm, 2.1 mm× 50 mm) kept at 40 ℃ and at a flow rate of 0.5mL/min. 0.1% aqueous formic acid (v/v) (A) and acetonitrile (B) were used as mobile phase. The gradient elution of B was performed as follows: 5%-20%Bat0-3 min, 20%-40% B at 3-4 min, 40%-100% B at 4-6 min, 100% B at 6-7 min, 100%-5% B at 7-7.1 min and then kept at 5% B for 4 min. The sample inject volume was 5μL. The ESI source in both positive and negative ion mode was used in MS analysis. The source temperature was 120 ℃, and desolvation gas temperature was 350 ℃. Nitrogen was used as cone and desolvation gas. The flow rates of cone and desolvation gas were set at 50L/hand 600 L/h, respectively.Capillary, cone and extraction cone voltages were set at 3.0 kV, 30V, and 5.0 V in positive ion mode, respectively, while at 2.0 kV, 30 V, and 5.0 V in negative ion mode, respectively. MS data were collected in full-scan mode in the mass range of 100-1000 Da. MSE was applied for the MSZ analyses with the low collision energy of 5 eV and the high collision energy of 25 eV-35eV.
The UPLC-MS raw data were processed by MassLynx V4.1 (Waters Corporation, Milford, USA) for peaks detection and alignment. EZinfo 2.0 software was applied for principal component analysis (PCA) and orthogonal projection to latent structures squares-discriminant analysis (OPLS-DA). The statistical difference for the ion intensities of selected metabolites and urinary biochemical parameters between model and saline control groups was determined using paired-sample t-tests (P < 0.05 or P < 0.001). Biochemical databases were used to identify potential markers, such as HMDB (http://www.hmdb.ca/), METLIN (http://metlin.scripps.edu/), Mass Spectrometry (http://masspec.scripps.edu/index.php), Massbank (http://www.massbank.jp/) and KEGG (http://www.kegg.com/).
In this study, we have used the quality control sample (QC) for monitoring the repeatability and stability of the analysis system, which was prepared by equally mixing the tested urine samples. Before the analysis of the sample, we first run QC sample 5 times to balance the system. The system performance was evaluated based on the relative standard deviation (RSD) of the peak area and retention time of the selected substance. The evaluation criteria was that peak area RSD < 10% and retention time RSD < 1%. In the assessment of analytical method stability, the data acquired from the QC sample showed good system stability. The RSD values of retention times and peak areas of the six ions in the QC samples were 0.72%-0.80% and 8.34%-8.95% in positive mode, 0.30%-0.36% and 2.88%-9.76% in negative mode, respectively.
UPLC-Q-TOF-MS is widely used in metabonomic studies [6, 12, 13]. The typical urinary base peak intensity (BPI) chromatograms of the rat urine obtained in ESI positive mode (A) and ESI negative mode (B) based on UPLC-ESI-QTOF/MS are shown in Fig. S1 (Supporting information).
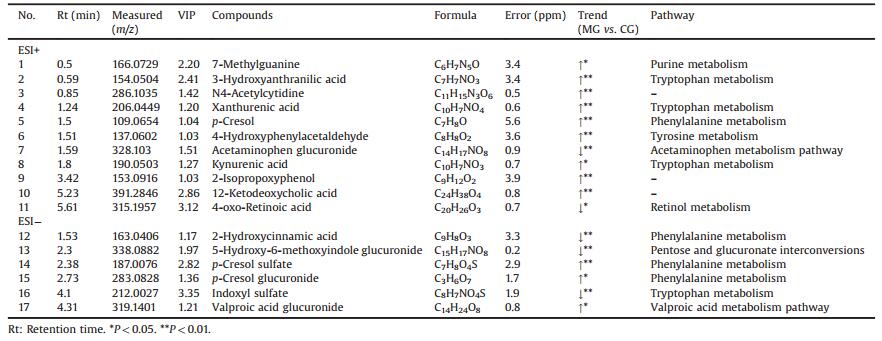
In this paper, both positive and negative ion modes were applied to obtain adequate information of metabolites. Because there were hundreds of metabolites detected in urine, the multivariate analysis methods, such as PCA and OPLS-DA, were used to distinguish the groups. The PCA/OPLS-DA was taken as a pattern recognition method using the scatter diagram in this paper. Pareto scaling was used to reduce disturbances from noise and artifacts in the two models. The MG could be clearly separated from CG in PCA score plots in both positive and negative ion modes (Fig. 1), which indicated that the endogenous metabolite difference in urine was remarkable. An OPLS-DA model was established to maximize class discrimination. In the OPLS-DA model, variable importance in the projection (VIP) value was applied to find the potential biomarkers which made the greatest contribution to group separation. The ions with VIP value above 1.0 were considered as potential biomarkers. By comparing with MG, 17 endogenous metabolites in urine were considered to be potential biomarkers. The identification of these metabolites was carried out as follows.

|
Download:
|
| Fig. 1. PCA score plots of urine metabolic profiling of CG (▲), MG (■) in positive mode (A) and negative modes (B). | |
The possible molecular formulas of the potential biomarkers were calculated by high-accuracy quasi-molecular ion within mass error of 10 ppm and fractional isotope abundance detected by QTOF-MS. The structure information was obtained by searching freely accessible databases mentioned before. MS/MS fragmentation patterns also provided necessary information for the structures of biomarkers. Take the biomarker at m/z 187.0076 in negative ion mode as an example (Fig. S2 in Supporting information). Suppose the m/z is [M-H]-, and the possible formula is C7H8O4S. Its major fragment ions in this work were m/z 107.0542 and m/z 80.9532, which represent the fragment of [M-H-SO3]- and [M-H-SO3-C2H2]-. Finally, it was identified as p-cresol sulfate by comparing its quasi-molecular ion and fragment ions in the accessible databases. The information of potential biomarkers is summarized in Table 1.
|
|
Table 1 Identification of significant endogenous metabolites in the rats urine. |
PM2.5 is associated with the development of many diseases. But the pathogenic mechanisms remain unknown. In this study, 17 significantly changed metabolites were defined between CG and MG. The primary metabolism pathways involved tryptophan metabolism, pentose and glucuronate intercoversions, tyrosine metabolism, phenylalanine metabolism, acetaminophen metabolism pathway, pentose phosphate pathway, retinol metabolism and valproic acid metabolism pathway. The network of the main potential biomarkers is shown in Fig. 2.

|
Download:
|
| Fig. 2. Correlation networks of main potential biomarkers in response to PM2.5 exposure in rats. The red marked metabolites denotes the identified metabolites. | |
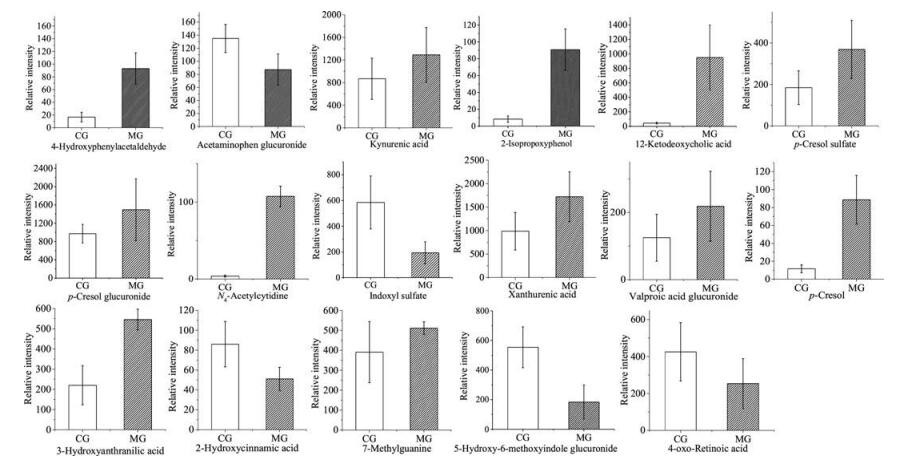
For the metabolic pathway analysis, we have used the Met PA (http://metpa.metabolomics.ca), which is a web-based metabonomic tool used to perform pathway analysis and visualization of quantitative metabonomic data. The relative intensities of potential biomarkers in the two groups are shown in Fig. 3.

|
Download:
|
| Fig. 3. Relative intensities of potential biomarkers in the two groups (*P < 0.05, **P < 0.01). | |
5-Hydroxy-6-methoxyindole glucuronide is a metabolite of 5- hydroxy-6-methoxyindole, it is metabolized by the liver glucuronosyltransferase in the liver. Glucuronidation is commonly used for the detoxification and excretion of toxic substances. It combines with chemicals to form glucuronide, which makes it more water-soluble and is finally excreted by the kidneys. In this work, the level of 5-hydroxy-6-methoxyindole glucuronide decreased in the group MG, which indicated that the detoxification of glucuronidation may be reduced.
Both xanthurenic acid and kynurenic acid are important metabolites of the tryptophan metabolism. Up-regulation of xanthurenic acid and kynurenic acid may be induced by activation of tryptophan 2, 3-dioxygenase (TPHD) and in metabolic pathway generating kynurenine after the exposure to PM2.5, which will cause the abnormality of tryptophan metabolism directly [8]. Research has shown that the content of xanthurenic acid and kynurenic acid in rats with renal insufficiency will increase, and kynurenine pathway is involved in a variety of central nervous system diseases, some products and enzymes play a different pathological role in the process, abnormalities of kynurenine pathway may involve the occurrence of diseases such as depression, epilepsy, schizophrenia and other disease [9-11]. 3-Hydroxyanthranilic acid is an oxidation product of tryptophan metabolism, that is neurotoxic and can induce the formation of free radicals such as hydroxyl radicals and hydrogen peroxide, and improve the level of oxidative stress as well as cause neuronal death through the apoptotic mechanism [11, 12]. In this study, they were all up-regulated and caused the abnormality of tryptophan metabolism directly in the group MG compared with the group CG.
As for the purine metabolism, 7-methylguanine is the product of DNA methylation and depurination, which is considered an important biomarker of lung cancer, and it had been reported that its content was higher in the urine of the smoker than that in the urine of the non-smoker [14]. In the group MG, the content of 7- methylguanine increased which showed that the effect of PM2.5 on rats was similar to that of nicotine on human, while the normal physical condition of the model group had been affected.
As for the phenylalanine metabolism, p-cresol, even at very low concentration, has adverse effects on the central nervous system, cardiovascular system, lungs, kidney, resulting in central nervous system depression [15]. p-Cresol sulfate is a typical refractory protein binding toxin, when the toxin binds to the protein, it can lead to the changes of protein's own molecular structure, charge and even function, and even cause the damage of other tissue and organs [16].
p-Cresol sulfate and p-cresol glucuronide are uremic toxins, they are p-cresol derivatives. p-Cresol is usually produced by tyrosine or phenylalanine in the intestinal anaerobic flora. In this research, compared with the CG group, the level of p-cresol, pcresol sulfate and p-cresol glucuronide in the group MG increased obviously, up-regulation of them could indicated that PM2.5 might caused the damage of rats' central system and organs.
Besides, there have other metabolism pathways. Acetaminophen glucuronide is a natural human metabolite of acetaminophen generated in the liver by UDP glucuonyltransferase. Glucuronidation is used to assist the excretions of toxic substances, drugs or other substances that cannot be used as an energy source. Glucuronic acid is attached via a glycosidic bond to the substance, and the resulting glucuronide, which has a higher water solubility than the original substance, is eventually excreted by the kidneys. In the group MG, the level of acetaminophen glucuronide was decreased, which indicated that PM2.5 on the kidney detoxification had a certain inhibitory effect.
4-Hydroxyphenylacetaldehyde is a by-product of tyrosine metabolism. In this study, the levels of 4-hydroxyphenylacetaldehyde was significant up-regulated in the MG compared with the CG, which indicated that PM2.5 caused the disturbance of rats' tyrosine metabolism [17].
Global metabolic profiling on PM2.5 rats using UPLC-QTOF-MS is useful to investigate significant impact of PM2.5 on metabolism and physiology [18, 19]. In this paper, a UPLC-Q-TOF-MS-based urinary metabonomics method has been established and used for the first time to screen out potential biomarkers of rats which exposure to PM2.5, a total of 17 potential biomarkers were identified as being primarily involved in pentose and glucuronate interconversions, tryptophan metabolism, purine metabolism, phenylalanine metabolism, tyrosine metabolism and acetaminophen metabolism pathway. Among them, the content of 12 kinds of metabolites decreased and 5 kinds of metabolites increased. These changes suggest that PM2.5 had a different degree of damage to the physiological functions, tissues and organs of rats, which provided a reference for clarifying the complex mechanism of PM2.5 induced body injury. In this study, the explored effect of PM2.5 on metabolic pathways in rats provided some theoretical support for the further research of PM2.5 toxic effects and pathogenic mechanisms.
AcknowledgmentThis research was supported by the National Natural Science Foundation of China (No. 31400453).
Appendix A. Supplementary dataSupplementary data associated with this article can be found, in the online version, at 10.1016/j.cclet.2017.11.019.
| [1] |
C.A. Pope, R.T. Burnett, M.J. Thun, et al., J. Am. Med. Assoc. 287 (2002) 1132-1141. DOI:10.1001/jama.287.9.1132 |
| [2] |
D. Hartono, B. Lioe, Y. Zhang, B. Li, et al., Sci. Rep. 7 (2017) 644. DOI:10.1038/s41598-017-00449-5 |
| [3] |
Y.L. Shi, L.H. Deng, J. Med. Bio. 28 (2013) 127-134. |
| [4] |
Y.Q. Lu, Y.T. Yuan, J. Anhui. Agric. 41 (2013) 13988-13989. |
| [5] |
S. Barnesa, H.P. Bentonj, K. Casazzac, et al., J. Mass Spectrom. 51 (2016) 461-475. DOI:10.1002/jms.3782 |
| [6] |
N. Psychogios, D.D. Hau, J. Peng, et al., PLoS. One 6 (2011) e16957. DOI:10.1371/journal.pone.0016957 |
| [7] |
O. Beckonert, H.C. Keun, T.M.D. Ebbels, et al., Nat. Protoc. 2 (2007) 2692. DOI:10.1038/nprot.2007.376 |
| [8] |
Z.H. Su, S.Q. Li, G.A. Zou, C.Y. Yu, et al., J. Pharm. Bio. Anal. 55 (2011) 533-539. DOI:10.1016/j.jpba.2011.02.013 |
| [9] |
D. Pawlak, A. Tankiewicz, T. Matys, etal., J.Physiol.Pharmacol. 54 (2003) 175-189. |
| [10] |
D. Pawlak, A. Tankiewicz, W. Buczko, J. Physiol. Pharmacol. 52 (2001) 755-766. |
| [11] |
D.H. Wang, S.M. Wang, L. Wei, et al., Adv. Physiol. Sci. 47 (2016) 43-46. |
| [12] |
L.E. Goldstein, M.C. Leopold, X. Huang, et al., Biochemistry 39 (2000) 7266-7275. DOI:10.1021/bi992997s |
| [13] |
S. Okuda, N. Nishiyama, H. Saito, et al., J. Neurochem. 70 (1998) 299-307. |
| [14] |
E.P. Wang, Y. Sun, H. Yue, et al., Chin. J. Anal. Chem. 44 (2016) 1410-1418. |
| [15] |
N.G. Buckman, J.O. Hill, R.J. Magee, et al., J. Chromatogr. A 284 (1984) 441-446. DOI:10.1016/S0021-9673(01)87845-6 |
| [16] |
G. Glorieux, R. Vanholder, Contrib. Nephrol. 168 (2011) 117-128. |
| [17] |
T. Miyagaki, I. Aoyama, M. Ise, et al., Nephrol. Dial. Transpl. 15 (2000) 1773-1781. DOI:10.1093/ndt/15.11.1773 |
| [18] |
E.J. Want, I.D. Wilson, H. Gika, et al., Nat. Protoc. 5 (2010) 1005-1018. DOI:10.1038/nprot.2010.50 |
| [19] |
N.S. Jain, U.H.N. Dürr, A. Ramamoorthy, Chin. Chem. Lett. 26 (2015) 407-415. DOI:10.1016/j.cclet.2015.03.001 |