 2018, Vol. 29


b National Demonstration Center for Experimental Biomedical Engineering Education, Southeast University, Nanjing 210096, China;
c Getein Biotechnology Co., Ltd., Nanjing 210000, China
Immunochromatographic technique is to use microporous membrane as solid carrier and liquid as mobile phase, and the labeled tracer markers flow laterally along the microporous membrane under siphon or capillary action. The analyte conducts a specific immune reaction on the test (T) line by chromatography, and the result can be obtained with naked eyes or the corresponding instrument. In recent years, with the increasing demand of primary medical care, household diagnosis and bedside detection, the lateral flow assay (LFA) strip has become increasing popular for its easy operation and rapid detection [1-8].
At present, the most commonly used LFA can be divided into colloidal gold FLA [9-13] and fluorescent FLA [14-18]. Fluorescent immunochromatographic detection system includes two parts: immune reaction system and signal amplification system. Fluorescent immunochromatography has high sensitivity and specificity compared with gold immunochromatography. In addition, polychromatic fluorescence technology, especially single light source and multi-excitation immunochromatography technology, can realize the joint detection of multiple analytes. With the development of information technology, it has become a powerful competitor of the high detailed diagnostic testing platform, especially in family and small clinic market [19, 20].
However, the surface coloration of solid phase carrier in LFA is significantly inferior to that of immunological homogeneous reaction [21-24]. The results of LFA strip are influenced by many factors. Firstly, the different pore size of microporous membrane results in great difference in color intensity of the liquid to be tested. Secondly, the chromatography speed of the tracer markers on the conjugation pad is significantly affected by the drying degree of the microporous membrane, the temperature and humidity of the external environment. Thirdly, there is a certain difference in processing of the conjugation pad and the immobilization of test line on the strip. The existing method of setting up the control (C) line can only judge whether the test paper is invalid. The principle is that the detection area is covered with a quality control line which can be identified and combined with the antigen or antibody that can be coupled with the marker. When the control line has no reaction, the test paper is considered to be invalid. Therefore, the test results of the control line cannot exclude the influence of chromatographic speed on the accuracy of test results. Due to the above reasons, the traditional LFA is not suitable for the detection when the requirement for repeatability is strict. For example, glycosylated hemoglobin (HbA1c) can accurately reflect the control level of blood glucose on patients, and it is also an index to monitor the development of diabetes mellitus. The normal level in human body is 4%~6%. The coefficient of variation (CV) has to be less than 3% for accurate detection [25]. In order to realize the quick and accurate detection of substances like HbA1c, the design of LFA with good repeatability is in great demand.
In this paper, a new quality control method for LFA strip was designed for the detection of HbA1c. The BSA-fluorescein isothiocyanate (FITC) decorated carboxyl microspheres were used as internal quality control labels, and anti-HbA1c detection antibody-fluorescein cy5 decorated carboxyl microspheres were used as labels. The two labels were immobilized on the conjugation pad, and 1:1 equal molar mixture of anti-HbA1c detection antibody and quality-control molecule (BSA) were fixed on T line. In the course of immune reaction, the HbA1c, the corresponding anti- HbA1c detection antibody, and the antiHbA1c capture antibody form a sandwich complex, and the quality control molecule BSA specifically binds to anti-BSA antibody. The fluorescent intensities of FITC and cy5 on T line were measured by Getein1100 polychromatic fluorescence immunoquantitative analysis instrument (Getein Biotechnology Co., Ltd.). The ratio of the cy5 to FITC was calculated to get the concentration of the HbA1c under the calibration curve. This method can improve the accuracy and precision of measurement, and can accurately reflect the differences of membrane aperture, coating uniformity and chromatographic speed of the test strip. To the best of our knowledge, this is the first report of using one quality control label in LFA to enhance the precision and repeatability of the LFA strip.
Sodium bicarbonate (NaHCO3), streptavidin, and bovine serum albumin (BSA) were purchased from Sigma-Aldrich. Sucrose, tween-20, ethyl dimethylaminopropyl carbodiimide (EDC) and sulfo-N-hydroxysuccinimide (NHS) were received from Alfa Aesar. The cy5 and FITC decorated carboxyl fluorescent microspheres, nitrocellulose (NC) membrane, sample pad, backing pad, absorption pad, and conjugate pad were provided by GeteinBiotech (China). PBS buffer was prepared in-house. Clinical whole blood samples were obtained from Nanjing First Hospital. The ethical review was done by Institutional Review Board of the hospital. All water was distilled and subsequently purified to Millipore Milli-Q quality.
EDC and NHS coupling reactions were conducted to conjugate carboxylic acid functional groups on the surface of fluorescent microspheres [26, 27]. Freshly prepared EDC (40 mg/mL, 5 μL) and NHS (110 mg/mL, 5 μL) were added to 5 mg of 50 nm cy5 decorated carboxyl fluorescent microspheres (solid content of 5 mg/mL) and reacted for 30 min under stirring. The microspheres were washed by centrifugation with 500 μL of 50 mmol/L PBS solution after activation. After that, 100 μg/100 μL of anti-HbA1c antibody was added to the microspheres and reacted for 2 h and then kept overnight at 4 ℃. The final cy5 decorated microtags were washed with 50 mM PBS solution (pH 7.5) for three times and preserved in PBS for further use.
The activation of FITC decorated carboxyl fluorescent microspheres was the same with cy5 [28-30]. After that, anti-BSA antibody was added to the microspheres and reacted for 2 h and then kept overnight at 4 ℃. The final FITC decorated control microtags were washed with 50 mmol/L PBS solution (pH 7.5) for three times and preserved in PBS for further use.
The LFA strip is composed of five components: a sample pad, a conjugate pad, a NC membrane, an absorbent pad, and a backing pad [31]. To fabricate the strip, the NC membrane was first attached to the middle part of backing pad; the absorbent pad was affixed to the ending part of backing pad; and the sample pad and the conjugate pad were affixed to the beginning part of backing pad. The ends of each component were overlapped, ensuring a continuous flow by capillary action of the developing solution from the sample pad to the absorbent pad.
Negative and positive whole blood samples were randomly selected. 100 μL of sample solution was pipetted onto the sample pad. Once the solution was placed, the liquid solution was moved forward by capillary action. When the sample solution passed through the conjugation pad, the HbA1c hybridized with corresponding detection antibody and attached to the surface of cy5 decorated microtags to form antibody hybridization immunocomplexes, which continued to flow along the strip. The FITC decorated microtags with BSA also flowed along the strip with the immunocomplexes. When these immunocomplexes and tags reached the test line, the immunocomplexes were captured by HbA1c capture antibody which was pre-immobilized on the test line, and sandwich HbA1c antibodies hybridization immunocomplex was formed on the test line. Besides, FITC decorated microtags with BSA were captured by goat anti-BSA polyclonal detection antibody, and sandwich BSA antibodies hybridization immunocomplex was also formed on the test line. After 5 min, the fluorescence value of the T line was determined by Getein1100 polychromatic immunoquantitative analysis instrument (Getein Biotechnology Co., Ltd.).
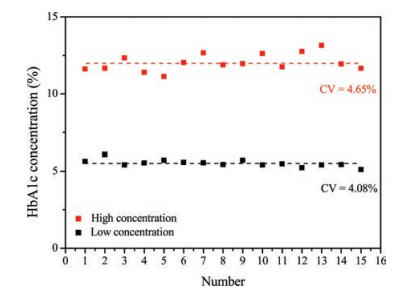
In order to make sure the repeatability of the traditional LFA without quality control labels for HbA1c detection, the fluorescence intensities of whole blood samples with high and low concentration of HbA1c were detected using Getein1100 polychromatic immunoquantitative analysis instrument (Fig. 1). Fifteen strips were used respectively to detect the samples and the CVs are shown in the figure. It can be seen that the CVs of high and low concentration of HbA1c got from the traditional LFA were 4.65% and 4.08%, respectively, which cannot meet the requirement of accurate detection of HbA1c in human body. So, the repeatability of traditional LFA has to be enhanced and the CVs of LFA less than 3% are necessary for accurate diagnosis of HbA1c.

|
Download:
|
| Fig. 1. The fluorescent intensity and CVs of high and low concentration of HbA1c. | |
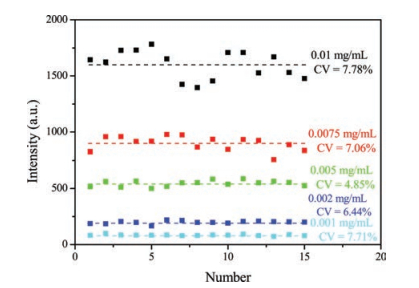
FITC decorated microtags were chosen as control labels in our new LFA. In order to find the optimal BSA concentration conjugated on the FITC decorated carboxyl fluorescent microspheres tags, the fluorescent intensity of the C line with BSA concentration of 0.001, 0.002, 0.005, 0.0075, and 0.001 mg/mL was detected (Fig. 2). Fifteen strips were used respectively to detect the samples, and the CVs are shown in the figure. It can be seen that the CVs were 7.71%, 6.44%, 4.85%, 7.06%, and 7.78%, respectively. As we all know, the lower the CVs are, the better the BSA concentration for FITC decorated microtags is. So the BSA concentrations of 0.002 and 0.005mg/mL with the relatively lower CVs were chosen for further experiments.

|
Download:
|
| Fig. 2. The fluorescent intensity and CVs with BSA concentration of 0.001, 0.002, 0.005, 0.0075, and 0.001 mg/mL. | |
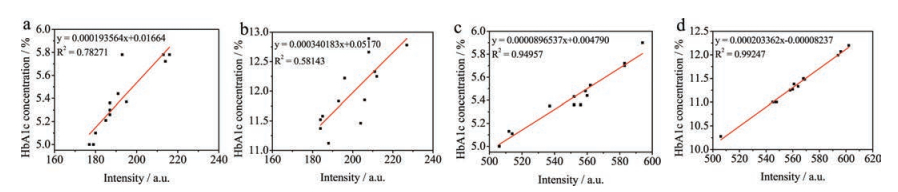
The correlation of the fluorescent intensity between FITC decorated microtags and cy5 decorated microtags is quite important for the quality control of LFA. The higher the correlation is, the more suitable the BSA-FITC microtags used for quality control is. In order to find the best BSA concentration conjugated on the FITC decorated carboxyl fluorescent microspheres, samples with high and low concentrations of HbA1c were detected by microtags with BSA concentration of 0.002 and 0.005 mg/mL respectively. Fifteen strips were used respectively to detect the samples and the CVs are shown in the figure. The linear correlation equations between and BSA-FITC microtags are shown in Fig. 3. For low and high concentration of HbA1c and 0.002 mg/mL BSA-FITC microtags, R2 values were 0.78271 and 0.58143, respectively, which indicated a bad linearity between them. For low and high concentration of HbA1c and 0.005 mg/mL BSA-FITC microtags, R2 values were 0.94957 and 0.99247, respectively, which indicated a good linearity between them. So 0.005 mg/mL BSA-FITC microtags are superior to 0.002 mg/mL BSA-FITC microtags as quality control labels in LFA.

|
Download:
|
| Fig. 3. (a) Signal correlation between low concentration of HbA1c and 0.002 mg/mL BSA-FITC microtags; (b) Signal correlation between high concentration of HbA1c and 0.002 mg/mL BSA-FITC microtags; (c) Signal correlation between low concentration of HbA1c and 0.005 mg/mL BSA-FITC microtags; (d) Signal correlation between high concentration of HbA1c and 0.005 mg/mL BSA-FITC microtags. | |
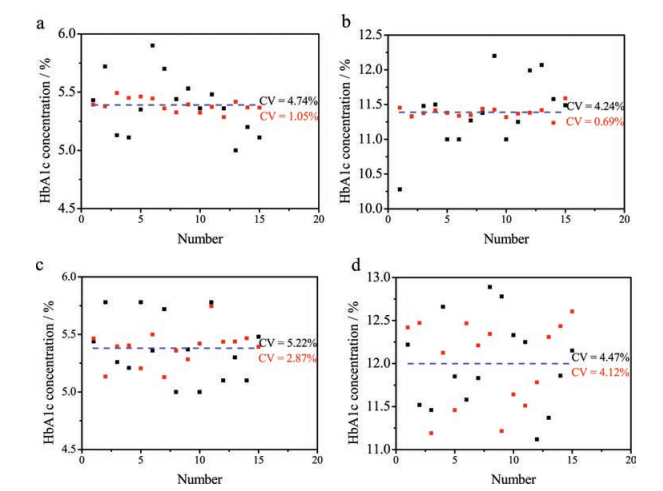
In order to evaluate the performance of the LFA with FITC decorated microtags as internal quality control labels, the whole blood samples with high and low concentration of HbA1c were detected using the quality control LFA (Fig. 4). Fifteen strips were used respectively to detect the samples, and the CVs are shown in the figure. It can be seen from Fig. 4a that the CV was 4.74% using the traditional LFA when the low concentration HbA1c was detected. After the 0.005 mg/mL BSA-FITC decorated microtags were used in the LFA for quality control, the CV decreased greatly to 1.05%, which met the need of accurate diagnosis of HbA1c in human body. Similarly, the CV was 4.24% using the traditional LFA when the high concentration HbA1c was detected. After the 0.005 mg/mL BSA-FITC decorated microtags were used in the LFA for quality control, the CV decreased greatly to 0.69% (Fig. 4b). All these results prove that 0.005 mg/mL BSA-FITC decorated microtags used in LFA for quality control labels are quite useful to enhance the precision and repeatability of the LFA.

|
Download:
|
| Fig. 4. (a) The intensity of low concentration HbA1c detected with 0.005 mg/mL BSA-FITC decorated microtags with traditional LFA and new quality control methods; (b) The intensity of high concentration HbA1c detected with 0.005 mg/mL BSA-FITC decorated microtags with traditional LFA and new quality control methods; (c) The intensity of low concentration HbA1c detected with 0.002 mg/mL BSA-FITC decorated microtags with traditional LFA and new quality control methods; (d) The intensity of high concentration HbA1c detected with 0.002 mg/mL BSA-FITC decorated microtags with traditional LFA and new quality control methods. | |
On the other hand, the CV was 5.22% using the traditional LFA when another low concentration HbA1c was detected. After the 0.002 mg/mL BSA-FITC decorated microtags were used in the LFA for quality control, the CV decreased to 2.87% (Fig. 4c), which also met the need of quality control. The CV was 4.47% using the traditional LFA when another high concentration HbA1c was detected. However, after the 0.002 mg/mL BSA-FITC decorated microtags were used in the LFA for quality control, the CV only had a little decrease to 4.12% (Fig. 4d), which was not helpful to enhance the repeatability of the LFA. In summary, 0.005 mg/mL BSA-FITC microtags are chosen as quality control labels in LFA, and this quality control method can greatly enhance the precision and repeatability of the LFA based detection.
In conclusion, we developed a quality control method for LFA to enhance the precision and repeatability. Cy5 decorated microspheres were used as labels for HbA1c detection and BSA-FITC decorated microspheres were used as internal quality control labels. One test line was employed in the strip for the detection of HbA1c. The CV for detection of low concentration HbA1c was 1.05%, and the CV for detection of high concentration HbA1c was 0.69%. Both of the CVs were less than 3%, which met the need for accurate diagnosis of HbA1c in human body. This method provided an important guidance to LFA and will have a great prospect in clinical alert and health monitoring.
AcknowledgmentsThis work was supported by the State key Basic Research Program of the PRC (No. 2014CB744501), the National Key Research and Development Program of China (No. 2017YFA0205301), the National Natural Science Foundation of China (Nos. 61527806, 61471168 and 61871180) and open Funding of State Key Laboratory of Oral Diseases (No. SKLOD2018OF02).
| [1] |
R.H. Tang, H. Yang, J.R. Choi, et al., Crit. Rev. Biotechnol. 37 (2016) 411-428. |
| [2] |
C. Parolo, A. Merkoci, Chem. Soc. Rev. 42 (2013) 450-457. DOI:10.1039/C2CS35255A |
| [3] |
W.C. Huang, K.H. Wu, H.C. Hung, et al., J. Nanosci. Nanotechnol. 18 (2018) 7190. DOI:10.1166/jnn.2018.16020 |
| [4] |
L.L. Cao, C. Fang, R.S. Zeng, et al., Sensor. Actuat. B -Chem. 252 (2017) 44-54. DOI:10.1016/j.snb.2017.05.148 |
| [5] |
A. Murali, N. Haridharan, P.S. Babu, S. Jayaveni, S.N. Jaisankar, J. Nanosci. Nanotechnol. 18 (2018) 959-966. DOI:10.1166/jnn.2018.13959 |
| [6] |
L.L. Cao, C. Fang, R.S. Zeng, et al., Biosens. Bioelectron. 92 (2017) 87-94. DOI:10.1016/j.bios.2017.02.002 |
| [7] |
Y. Jin, Q. Xue, D. He, X. Liu, S. Lu, J. Nanosci. Nanotechnol. 17 (2017) 6216-6223. DOI:10.1166/jnn.2017.14434 |
| [8] |
H.S. Han, M.S. Ahmed, H. Jeong, S. Jeon, J. Electrochem. Soc. 162 (2015) B75-B80. DOI:10.1149/2.0651504jes |
| [9] |
W. Wang, L. Liu, L. Xu, et al., Part. Part. Syst. Charact. 33 (2016) 388-395. DOI:10.1002/ppsc.201500219 |
| [10] |
Y. Huang, J. Tan, L.J. Cui, et al., Biosens. Bioelectron. 102 (2018) 560-567. DOI:10.1016/j.bios.2017.11.037 |
| [11] |
R. Li, X. Zhang, C. Yang, et al., J. Nanosci. Nanotechnol. 18 (2018) 3800-3805. DOI:10.1166/jnn.2018.15257 |
| [12] |
F. Chen, X. Zhang, X. Hu, P. Liu, H. Zhang, Nanosci. Nanotechnol. Lett. 10 (2018) 259-266. DOI:10.1166/nnl.2018.2621 |
| [13] |
J. Yang, F. Nian, Z. Guo, T. Bai, G. Peng, Nanosci. Nanotechnol. Lett. 9 (2017) 1491-1496. DOI:10.1166/nnl.2017.2503 |
| [14] |
Y. Xu, Y. Liu, Y. Wu, et al., Anal. Chem. 86 (2014) 5611-5614. DOI:10.1021/ac5010458 |
| [15] |
S. Takalkar, K. Baryeh, G. Liu, Biosens. Bioelectron. 98 (2017) 147-154. DOI:10.1016/j.bios.2017.06.045 |
| [16] |
L.L. Cao, Y. Jiang, Z. Chen, J. Nanosci. Nanotechnol. 18 (2018) 3067-3076. DOI:10.1166/jnn.2018.14674 |
| [17] |
F. Zhao, L. Cao, Y. Liang, et al., J. Biomed. Nanotechnol. 13 (2017) 1300-1308. DOI:10.1166/jbn.2017.2415 |
| [18] |
Y. Xing, X.Z. Feng, L.P. Zhang, et al., Int. J. Nanomed. Nanosurg. 12 (2017) 3171-3179. DOI:10.2147/IJN |
| [19] |
Y. Wu, W. Peng, Q. Zhao, et al., Chin. Chem. Lett. 28 (2017) 1881-1884. DOI:10.1016/j.cclet.2017.07.026 |
| [20] |
M. Zarei, Biosens. Bioelectron. 98 (2017) 494-506. DOI:10.1016/j.bios.2017.07.024 |
| [21] |
X. Gong, J. Cai, B. Zhang, et al., J. Mater. Chem. B -Mater. Biol. Med. 5 (2017) 5079-5091. DOI:10.1039/C7TB01049D |
| [22] |
M. Liu, K. Wu, L. Zhao, Y. Zhang, J. Biomed. Nanotechnol. 13 (2017) 381-392. DOI:10.1166/jbn.2017.2354 |
| [23] |
J. Fan, X. Yu, L. He, et al., Nanosci. Nanotechnol. Lett. 9 (2017) 1478-1486. DOI:10.1166/nnl.2017.2501 |
| [24] |
H. Li, X.M. Xie, Chin. Chem. Lett. 29 (2018) 161-165. DOI:10.1016/j.cclet.2017.06.001 |
| [25] |
Standards of the Pharmaceutical Industry of the People's Republic of China, China Standards Press, 2018(YY/T 1605-2018).
|
| [26] |
D. Zhang, L. Huang, B. Liu, et al., Biosens. Bioelectron. 106 (2018) 204-211. DOI:10.1016/j.bios.2018.01.062 |
| [27] |
D. Zhang, L. Huang, B. Liu, et al., Sensor. Actuat. B -Chem. 277 (2018) 502-509. DOI:10.1016/j.snb.2018.09.044 |
| [28] |
Y. Du, L. Wang, W. Wang, et al., J. Biomed. Nanotechnol. 14 (2018) 161-167. |
| [29] |
L. Li, G. Rao, X. Lv, et al., J. Biomed. Opt. 23 (2018) 1-4. |
| [30] |
S. Ma, L. Li, M. She, et al., Chin. Chem. Lett. 28 (2017) 2014-2018. DOI:10.1016/j.cclet.2017.09.027 |
| [31] |
S. Song, N. Liu, Z. Zhao, et al., Anal. Chem. 86 (2014) 4995-5001. DOI:10.1021/ac500540z |