 2018, Vol. 29


b Key Laboratory of Materials Processing and Mold(Zhengzhou University), Ministry of Education, Zhengzhou University, Zhengzhou 450002, China;
c ARC Centre of Excellence for Electromaterials Science, Intelligent Polymer Research Institute, AIIM Facility, University of Wollongong, North Wollongong, NSW 2500, Australia;
d Key Laboratory of Advanced Energy Materials Chemistry(Ministry of Education), Nankai University, Tianjin 300071, China
The rapid development of hybrid electric vehicles and largescaled grid systems force us to explore improved energy storage devices with high energy density and stable cycling performance [1-5]. Among them, lithium-ion batteries (LIBs) are widely used in portable devices owing to their high specific energy density and high power output [6-10]. Currently graphite is the commonly used anode in LIBs, but it suffers from poor rate capability and low lithiation potential (~0.1 V); the low lithiation potential may arouse the safety concern regarding the formation of lithium dendrites when operated at high current density [11-15]. For searching safety anode materials, lithium titanium oxide (Li4Ti5O12) is a promising candidate, which affords a flat discharge plateau of ~1.55 V and excellent cycling performance, however, the low electronic conductivity of Li4Ti5O12 limits its practical application [16-18]. So, there is a motivation to finding anode materials with high conductivity and safe operating voltage windows like Li4Ti5O12 [12, 16, 19, 20].
Recently, intercalation-type materials have been considered as a promising electrode materials for LIBs due to their high energy and superior cycle stability [21-25]. Among them, the niobium pentoxide (Nb2O5) has attracted great attention due to its relatively inexpensive and environmentally benign. Although, Nb2O5 owns a relative low theoretical capacity of 200 mAh/g, its excellent rate capability could result in a high power density. Moreover, Nb2O5 with a voltage plateau of ~1.7 V is safe to avoid the formation of lithium dendrites. In addition, the Nb5+ with an ionic radius of 64 pm enables a large (001) interplanar lattice spacing of 3.9 Å, which could offer fast lithium ion diffusion, resulting in good rate capability [11, 26-28]. Recently, Dunn's group discovered an extrusive pseudocapacitive Li+ intercalation mechanism occurred in orthorhombic Nb2O5 as an anode material for LIBs, which played a critical role in the rapid diffusion and storage of lithium ions [24, 29, 30]. Density functional theory (DFT) analysis was conducted to explain the pseudocapacitative behavior of Nb2O5 by Ganesh et al., indicating that the high rate intercalation pseudocapacitative behavior was ascribed to the local charge-transfer at all adsorption sites (leading to high energy), open channels to reduce the diffusion barrier for lithium-ions (leading to high rates and power density), and the lack of first-order phase transformation upon lithiation/delithiation (leading to high reversible capacity and good cycling stability) [31]. Therefore, Nb2O5 holds great application potential for high-performance LIBs.
The Nb2O5 exists mainly in five different crystal structures: amorphous Nb2O5 (a-Nb2O5), pseudohexagonal Nb2O5 (TT-Nb2O5), orthorhombic Nb2O5 (T-Nb2O5), tetragonal Nb2O5 (B-Nb2O5) and monoclinc Nb2O5 (M-Nb2O5) [32, 33]. The phase stability is affected by environmental temperature and pressure, and the existence of polymorphs depends on the modes of heating treatment, precursors, and preparation methods [34]. Nb2O5 with different crystal structures showed different intercalation/deintercalation characteristics [34, 35]. For example, Le Viet et al. found that the MNb2O5 delivered highest capacity (~242 (±3) mAh/g) compared with that of T-Nb2O5 and TT-Nb2O5, and the capacity of T-Nb2O5 was superior than that of TT-Nb2O5 [36]. While, Cao and his workers indicated that the TT-Nb2O5 delivered an obviously higher specific discharge capacity of 191 mAh/g than that of a-Nb2O5 (149 mAh/g) and T-Nb2O5 (152 mAh/g) [17]. Griffith et al. also showed different results based on different Nb2O5 phase structures: the TT-Nb2O5 (< 150 mAh/g at 1 A/g) and T-Nb2O5 (150 mAh/g at 1 A/g) showed better high-rate performance, while the MNb2O5 delivered a higher specificcapacity (235 mAh/g at 20 mA/g) but with inferior rate (< 50 mAh/g at 1 A/g) capability [34]. These results all showed that the electrochemical performances of Nb2O5 are highly related on the phase structures. However, there is little research on controlling the morphology, size and phase of Nb2O5 through a simple method and exploring their effects on lithium storage characteristics.
In this work, we have successfully synthesized TT-Nb2O5 and TNb2O5 by solvothermal method, followed by a thermal conversion process. The crystal structures of the synthesized Nb2O5 were related to the annealing temperatures. The TT-Nb2O5 material can be obtained at a relatively low temperature (500 ℃ or 600 ℃), and the T-Nb2O5 nanoparticles were obtained at high temperature (700 ℃). The synthesized T-Nb2O5-700 nanoparticles demonstrated the best electrochemical performance. For example, it showed the higher capacity of 175 mAh/g than that of TT-Nb2O5-500 nanosheets (127 mAh/g) and TT-Nb2O5-600 nanoparticles (39 mAh/g) after 100 cycles at a current density of 50 mA/g and delivered good rate performance with 219 mAh/g at 50 mA/g and a capacity of 140 mAh/g at 1.0 A/g. The excellent rate capability and cycling stability of T-Nb2O5-700 could be attributed to its dominant contribution of pseudocapacitive effect in the high charge/discharge current densities.
Pseudohexagonal and orthorhombic Nb2O5 samples were synthesized via a simple hydrothermal method followed by a thermal treatment, which is similar to previous report [37].1 mmol niobium chloride was dissolved in 20 mL ethanediamine and 15 mL distilled water with continuous stirring at room temperature for 50 min. This precursor solution was slowly poured into the Telfonlined autoclave, which kept at 180 ℃ for 24 h in oven. After cooling to room temperature naturally, the Nb2O5-precursor was centrifuged and rinsed with DI water and ethanol thoroughly for 3 times and dried at 65 ℃ for 12 h. To prepare different phase structures of Nb2O5, the dried Nb2O5-precursor was annealed at 500 ℃, 600 ℃, and 700 ℃ for 2 h in a tube furnace in air, respectively.
The crystal structures were confirmed by X-ray power diffraction (XRD) (Rigaku D/MAX-2500) at 50 kV and 250 mA with Cu Kα radiation. The bonding natures and chemical states were analyzed by X-ray photoelectron spectroscopy (XPS) (Thermo ESCALAB 250 spectrometer). Morphologies of the prepared Nb2O5 samples were characterized by scanning electron microscopy (SEM) (HitachiS-4800) with an accelerating voltage of 15 kV and transmission electron micoscopy (TEM) (JEOL JEM-3010) at 200 kV. Surface area and pore diameter distribution were performed by Brunauer-Emmett-Teller (BET) measurements using an AutosorbiQ (Quantachrome Instruments).
The Nb2O5 electrodes were prepared as follows: active material (70 wt%), acetylene carbon black (20 wt%) and carboxyl methyl cellulose (CMC) (10 wt%) were mixed together in water and ethanol to form a slurry, then the slurry was uniformly coated onto a piece of Cu foil and subsequently dried at 60 ℃ for 24 h under vacuum. The mass loading of active material Nb2O5 was controlled at about 1.0-1.5 mg/cm2.
The cells were tested in a 2025 type coin-cells. The obtained Nb2O5 was employed as cathode, the lithium metal was used as anode with a porous polypropylene separator. For electrolyte, 1 mol/L LiPF6 in amixture of ethylene carbonate (EC) and dimethyl carbonate (DMC) (V/V = 1:1) was used. All cells were assembled in a glove box with the H2O and O2 level below 0.1 ppm. The electrochemical performance measurements were carried out at different current densities by using Neware Battery Testing system. Cyclic voltammetry (CV) and the impedance tests were carried out by using a CHI 660e electrochemical workstation. The cells were operated in the voltage window of 1-2.6 V.
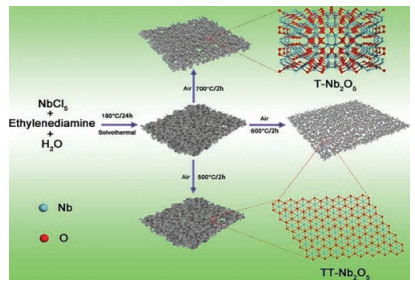
The synthesis process of Nb2O5 mainly involved two steps, as shown in Fig. 1. First, the Nb2O5-precursor was prepared via a solvothermal method, then pseudohexagonal Nb2O5 and orthorhombic Nb2O5 were obtained by annealing the Nb2O5-precursor at 500 ℃, 600 ℃, 700 ℃ for 2 h in air, respectively, which were labeled as TT-Nb2O5-500, TT-Nb2O5-600 and T-Nb2O5-700. The TTNb2O5-500 sample displayed a nanosheets structure, while the TTNb2O5-600 and the T-Nb2O5-700 samples were shown the nanoparticles morphology. The corresponding crystal structures are also shown in Fig. 1. Structurally, the unit cell of TT-Nb2O5 contains an essential defect of an oxygen atom and each Nb atom is at the center of four, five or six oxygen atoms on the ab-plane and an Nb-O-Nb-O chain structure is along the c-axis. T-Nb2O5 is comprised of orthorhombic unit cell; six or seven oxygen atoms surround a Nb atom forming distorted octahedra or pentagonal bipyramids [38]. TT-Nb2O5 is described as a disordered modification of T-Nb2O5 [34]. Some of the oxygen atoms of T-Nb2O5 are replaced by impurities such as Cl- (from residual precursors) or vacancy in the TT-Nb2O5 [39]. This unique crystal structure endows T-Nb2O5 high lithium storage during the charge/discharge processes [30, 39].

|
Download:
|
| Fig. 1. Schematic illustration of the solvothermal process to produce different Nb2O5 samples and the morphological evolution. | |
Fig. 2 shows the XRD patterns of the synthesized Nb2O5 samples. All the peaks of the TT-Nb2O5-500 and TT-Nb2O5-600 samples are well accorded with the diffraction peaks of pesudohexagonal Nb2O5, (JCPDS-07-0061, a = 3.607 Å, b = 3.607 Å, c = 3.925 Å; space group: P6/mmm), indicating their pesudohexagonal phase structure [40]. While, the T-Nb2O5-700 samples belongs to an orthorhombic phase (JCPDS-30-0873, a = 6.175 Å, b = 29.175 Å, c = 3.930 Å; space group: Pbam (55)) [17, 41-43]. Compared with the XRD patterns of the Nb2O5-precursor (Fig. S1 in Supporting information), the annealed samples all exhibit better crystallinity. Moreover, the intensity of these diffraction peaks obviously increases with the increase of annealing temperature, which implies an enhanced crystallinity.

|
Download:
|
| Fig. 2. XRD patterns of the synthesized Nb2O5 samples: (a) TT-Nb2O5-500, (b) TTNb2O5-600, and (c) T-Nb2O5-700. | |
The morphology and structure of all prepared Nb2O5 samples were investigated by scanning electron microscopy (SEM) and transmission electron microscopy (TEM). As shown in SEM and TEM images (Figs. 3a and b), the TT-Nb2O5-500 sample is composed of nanosheets with an average thickness of ~ 17 nm, which is well preserved the original morphology of the Nb2O5-precursor, as shown in Fig. S2 (Supporting information). The TTNb2O5-600 sample (Figs. 3d and e) and T-Nb2O5-700 sample (Figs. 3g and h) both show particle-like structure. Moreover, it is also noticed that with the increase of annealing temperature, the particle sizes of prepared TT-Nb2O5-600 and T-Nb2O5-700 became bigger. The structural details of all Nb2O5 samples were confirmed by high-resolution TEM. The crystalline lattice distance of 0.310 nm in TT-Nb2O5 (Figs. 3c and f) are corresponding to the (001) planes, which is consistent with the XRD results. The T-Nb2O5-700 shows a parallel lattice fringes with a d spacing of 0.390 nm (Fig. 3i), indicating an orthorhombic phase.

|
Download:
|
| Fig. 3. SEM and TEM images of the synthesized Nb2O5 samples: (a-c) TT-Nb2O5-500, (d-f) TT-Nb2O5-600, and (g-i) T-Nb2O5-700. | |
To further characterize differences among these three samples, nitrogen adsorption/desorption analysis was employed, as shown in Fig. 4. The specific surface area of the prepared TT-Nb2O5-500, TT-Nb2O5-600 and T-Nb2O5-700 samples are 92.4, 29.4 and 37.7 m2/g, respectively. Moreover, the pore-size distribution curves obtained through the BJH method indicates that the smaller pore sizes distribution of the T-Nb2O5-700 (9.08 nm) than that of TTNb2O5-500 (16.98 nm) and TT-Nb2O5-600 (17.14 nm). The T-Nb2O5-700 nanoparticles show higher surface area and smaller pore size distribution than that of TT-Nb2O5-600 nanoparticles, which could be associated with the thermal treatment process in the different temperatures.

|
Download:
|
| Fig. 4. N2 adsorption/desorption curves and pore size distribution plots of the samples: (a, b) TT-Nb2O5-500, (c, d) TT-Nb2O5-600, (e, f) T-Nb2O5-700. | |
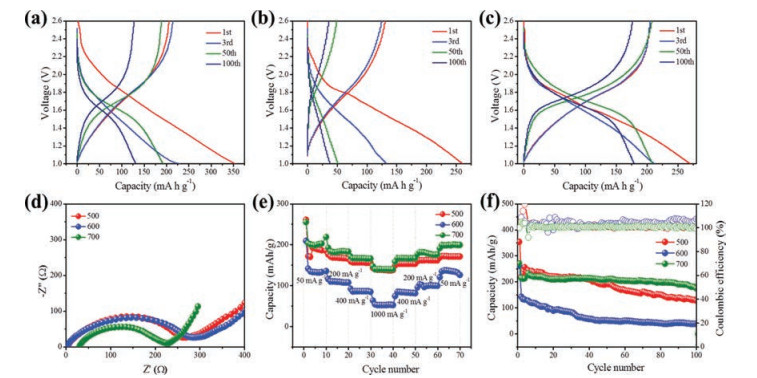
The charge/discharge profiles of TT-Nb2O5-500, TT-Nb2O5-600 and T-Nb2O5-700 (Figs. 5a-c) were measured between 1.00 V and 2.60 V at a current density of 50 mA/g. In the first cycle, these three electrodes displayed the similar discharge/charge behaviors with the initial discharge capacities of 353 mAh/g, 260 mAh/g and 270 mAh/g for TT-Nb2O5-500, TT-Nb2O5-600 and T-Nb2O5-700, respectively. From the second cycle, the obtained three samples all show high reversible specific capacities: 249 (TT-Nb2O5-500), 146 (TT-Nb2O5-500) and 216 (T-Nb2O5-700) mAh/g, respectively. The charge/discharge curves are almost overlapped during the subsequent cycles, implying an excellent cycling stability [19]. The capacity drop in the second cycle can be ascribed to the following reasons: the Faradaic contributions of side reaction with the electrolyte and/or the reversible formation of polymer/gel-like film through a pseudo-capacitance-type behavior [44, 45]; the irreversible reactions including the formation of SEI film and further lithium consumption via interfacial reactions due to the charge separation at the metal/Li2O phase boundary [46-49]. No obvious platform can be observed from the charge-discharge curves, which may be explained by that the electrochemical reactions of Nb2O5 with lithium through multiple steps for its decomposition and formation [20]. The electrochemical impedance spectroscopy (EIS) analysis of the Nb2O5 electrodes were carried out, and the Nyquist plots are shown in Fig. 5d. It clearly demonstrated that the semicircular diameter of T-Nb2O5-700 in the high frequency region is smaller than that of TT-Nb2O5-500 and TT-Nb2O5-600 samples, indicating the high temperature annealing could improve the conductivity of materials and thus favor the transport of lithium ions.

|
Download:
|
| Fig. 5. (a-c) Charge/discharge profiles of TT-Nb2O5-500, TT-Nb2O5-600 and T-Nb2O5-700, respectively. (d) Nyquist plots of all Nb2O5 samples before cycling. (e) Rate capacities of all Nb2O5 samples. (f) Cycling performance and coulombic efficiency of all Nb2O5 samples at 1.0-2.6 V vs. Li+ at a current rate of 50 mA/g. | |
Fig. 5e exhibits a decreasing trend in specific capacities for all Nb2O5 electrodes with the increasing of current density. When the current density gradually increase from 50 mA/g to 1000 mA/g, the specific capacities of the TT-Nb2O5-500, TT-Nb2O5-600 and TNb2O5-700 electrodes drops from 185, 135 and 219 mAh/g to 138, 53 and 140 mAh/g, respectively. When the current density was reversed back to 50 mA/g, the capacities of the TT-Nb2O5-500, TTNb2O5-600 and T-Nb2O5-700 electrodes can be restored to 171, 126 and 199 mAh/g, respectively. The T-Nb2O5-700 sample shows the best rate capability among them, which can be ascribed to its unique crystal and mesoporus structure, which could reduce the energy barrier with high charge transfer rate and allow fast lithium ion transportation [50].
Cycling performance was conducted to characterize the stability of the lithium storage behavior of the obtained Nb2O5 samples. Fig. 5f shows the cycling performances and coulombic efficiency curves of the TT-Nb2O5-500, TT-Nb2O5-600 and TNb2O5-700 electrodes within a voltage window of 1.0-2.6 V at a current density of 50 mA/g. The initial discharge capacity of TT- Nb2O5-500 electrode is 353 mAh/g, which is higher than the initial discharge capacity of TT-Nb2O5-600 (261 mAh/g) and T-Nb2O5-700 (270 mAh/g) electrodes. The retained capacity of TT-Nb2O5-500, TT-Nb2O5-600 and T-Nb2O5-700 electrodes are 127, 39 and 175 mAh/g after 100 cycles, respectively. Kodama et al. proved the continuous variation of valence state from Nb5+ to Nb4+ during the discharge process, as xLi + xe- + Nb2O5 → LixNb2O5 (x = 0-2) [16]. Thus, the crystal structure changes of Nb2O5 could deteriorate the contact between active material and conducting additives, leading to the capacity fading [51].
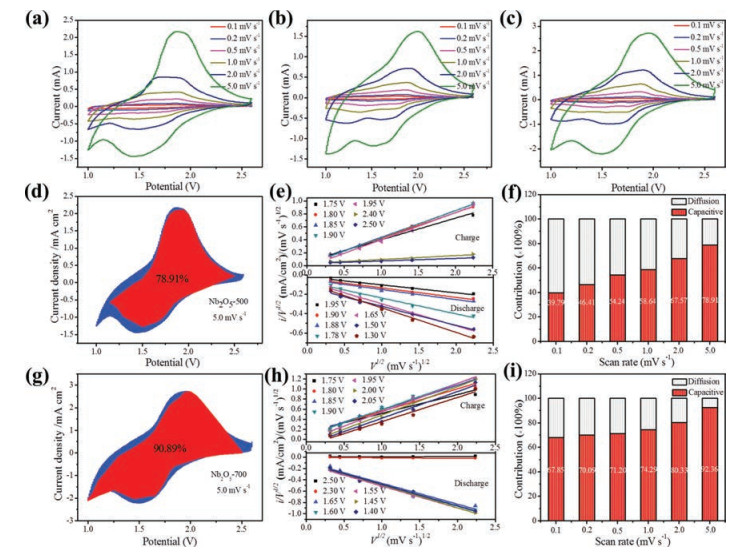
To further evaluate the electrochemical kinetics of Nb2O5 electrodes, CV measurements were conducted at a series of scan rates from 0.1 mV/s to 5 mV/s, as shown in Figs. 6a-c. TT-Nb2O5-500 and T-Nb2O5-700 show similar CV profiles with broad peaks during both anodic and cathodic processes. Interestingly, when the scan rate increased from 0.1 mV/s to 5 mV/s, peak separations could be almost ignored, which indicates the low polarization at high charge/discharge rates. Therefore, TT-Nb2O5-500 and TNb2O5-700 present significantly enhanced lithium ion kinetics.

|
Download:
|
| Fig. 6. Kinetic analysis of the prepared Nb2O5 materials: (a-c) CV curves of the TT-Nb2O5-500, TT-Nb2O5-600 and T-Nb2O5-700 electrodes at different sweep rates; (d, g) Capacitive contribution (red region) to the charge storage at 5 mV/s of the TT-Nb2O5-500 and T-Nb2O5-700 electrodes; (e, h) i(V)/v1/2 versus v1/2 at various potentials during the charge/discharge process from 0.1 mV/s to 5 mV/s of the TT-Nb2O5-500 and T-Nb2O5-700 electrodes; (f, i) The contribution ratio of pseudocapacitive and diffusioncontrolled capacity at different scan rates of the TT-Nb2O5-500 and T-Nb2O5-700 electrodes. (For interpretation of the references to colour in this figure legend, the reader is referred to the web version of this article.) | |
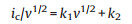
It was reported that the T-Nb2O5 displayed significant pseudocapacitive behavior [52-54]. The CV curves with bump shape are consistent with the typical pseudocapacitive Li+ intercalation mechanism [55]. To further understand the pseudocapacitive effect of the TT-Nb2O5-500 and T-Nb2O5-700 electrodes, electrochemical kinetics based on the CV profiles were studied. The capacitive and diffusion-controlled features can be analyzed through the relationship between current (i) and sweep rates (v), as shown by Eq. (1) [30, 56]:

|
(1) |

|
(2) |
|
(3) |
where a and b are the discretionary constants. When the value of b is close to 0.5, the diffusion-controlled process dominates the whole capacity; while if the value of b is close to 1, the capacitive-controlled process arising from the surface faradaic redox reaction dominates the whole capacities [50]. If diffusion-controlled process and capacitive process both work simultaneously in the charge/discharge process, the combined current (ic) can be expressed as Eqs. (2) and (3) [57].
According to the above two equations, k1v and k2v1/2 presents the capacitive process and the diffusion-controlled process, respectively. The ratio contribution of the capacitive process and diffusion-controlled process can be determined by the ratio of k1 and k2. The relationship between the ic/v1/2 and v1/2 could be plotted during the lithiation and delithiation process from the Eq. (3) (Figs. 6e and h), where the slope can be calculated by linear fitting. Fig. 6d shows the CV profile of the TT-Nb2O5-500 electrode at a scan rate of 5 mV/s with capacitive contribution (red region), and the capacitive contribution is 78.91%, which is much lower than that (90.89%) of the T-Nb2O5-700 electrode (Fig. 6g). This result reveals that more the lithium storage sites in the T-Nb2O5- 700 are easily contact with electrolyte to improve the capacitive capacity contribution due to its unique phase and relatively high surface area. The capacitive contributions of the TT-Nb2O5-500 and T-Nb2O5-700 electrodes were also calculated at different scan rates (Figs. 6f and i), which show an obvious trend. With the increasing of the scan rate, the contribution of capacitive process increase. At a scan rate of 5.0 mV/s, charge storage from capacitive process accounts for 92.4% in the T-Nb2O5-700 electrode, which is higher than that in the TT-Nb2O5-500 electrode (78.9%), indicating that the capacitive process plays a dominant role in lithium storage in the all Nb2O5 electrodes at high scan rates [50, 57]. It was interesting to discover in our work that even at a low scan rate of 0.1 mV/s, the capacitive process still accounts for about 67.8% in the whole charge storage, which is comparatively high because of the high capacitive behavior of T-Nb2O5 nanoparticles. Based on the above electrochemical analysis, T-Nb2O5-700 nanoparticles with numerous mesopores should contribute additional capacitive capacity in contrast with TT-Nb2O5-500 nanosheets, which provides more reaction sites for Li storage and faciles Li transportation through the whole electrode duo to its unique crystal structure among different phases [50]. For TT-Nb2O5-600 samples, kinetic analysis was also conducted, given in Fig. S3 (Supporting information).
In summary, we demonstrated the realization of the morphology, size and phase controlled Nb2O5 by simply adjusting the annealing process. Electrochemical results indicate that the cycling and rate performance of these materials are dependent on their structures. The T-Nb2O5-700 shows the highest capacity of 175 mAh/g after 100 cycles at a current density of 50 mA/g. This outstanding performance mainly contributed to the pseudocapacitive effect during cycling due to the unique crystal phase. Moreover, the TT-Nb2O5-500 nanosheets exhibits better cycling and rate capacity than TT-Nb2O5-600 nanoparticles owing to its high surface area related to the morphology and size.
AcknowledgmentsThis work was supported by the National Natural Science Foundation of China (No. 51302079), and the Natural Science Foundation of Hunan Province (No. 2017JJ1008).
Appendix A. Supplementary dataSupplementary material related to this article can be found, in the online version, at doi:https://doi.org/10.1016/j.cclet.2018.11.018.
| [1] |
E. Lim, C. Jo, H. Kim, et al., ACS Nano 9 (2015) 7497-7505. DOI:10.1021/acsnano.5b02601 |
| [2] |
Q.H. Wang, J.T. Xu, W.C. Zhang, et al., J. Mater. Chem. A 6 (2018) 8815-8838. DOI:10.1039/C8TA01627E |
| [3] |
J.J. Liang, Z.X. Wei, C.Y. Wang, et al., Electrochim. Acta 285 (2018) 301-308. DOI:10.1016/j.electacta.2018.07.230 |
| [4] |
M.G. Wu, Y.Q. Wang, Z.X. Wei, et al., J. Mater. Chem. A 6 (2018) 10918-10925. DOI:10.1039/C8TA02416B |
| [5] |
S.H. Shen, S.J. Deng, Y. Zhong, et al., Chin. Chem. Lett. 28 (2017) 2219-2222. DOI:10.1016/j.cclet.2017.11.031 |
| [6] |
L. Shen, S. Chen, J. Maier, Y. Yu, Adv. Mater. 29 (2017) 1605650-1605657. DOI:10.1002/adma.201605650 |
| [7] |
J.D. Liu, J.J. Liang, C.Y. Wang, et al., J. Energy Chem. (2018), doi: http://dx.doi.org/10.1016/j.jechem.2018.09.006.
|
| [8] |
M.J. Du, D. He, Y.B. Lou, J.X. Chen, J. Energy Chem. 26 (2017) 673-680. DOI:10.1016/j.jechem.2017.02.001 |
| [9] |
X. Zhong, H. Huang, X. Liu, Y. Yu, Nano Res. 11 (2018) 3702-3709. DOI:10.1007/s12274-017-1938-z |
| [10] |
X. Zhang, X. Cheng, Q. Zhang, J. Energy Chem. 25 (2016) 967-984. DOI:10.1016/j.jechem.2016.11.003 |
| [11] |
Q. Deng, M. Li, J. Wang, et al., Nanotechnology 29 (2018) 185401. DOI:10.1088/1361-6528/aab083 |
| [12] |
J.D. Huang, Z.X. Wei, J.Q. Liao, et al., J. Energy Chem. (2018), doi: http://dx.doi.org/10.1016/j.jechem.2018.09.001.
|
| [13] |
Z.X. Wei, L. Wang, M. Zhuo, et al., J. Mater. Chem. A 6 (2018) 12185-12214. DOI:10.1039/C8TA02695E |
| [14] |
O. Gerber, S. Bégin-Colin, B.P. Pichon, et al., J. Energy Chem. 25 (2016) 272-277. DOI:10.1016/j.jechem.2016.01.021 |
| [15] |
Y. Li, L. Kong, M. Liu, W. Zhang, L. Kang, J. Energy Chem. 26 (2017) 494-500. DOI:10.1016/j.jechem.2016.11.017 |
| [16] |
G. Li, X. Wang, Z. Chen, X. Ma, Y. Lu, Electrochim. Acta 102 (2013) 351-357. DOI:10.1016/j.electacta.2013.03.169 |
| [17] |
S. Li, Q. Xu, E. Uchaker, X. Cao, G. Cao, CrystEngComm 18 (2016) 2532-2540. DOI:10.1039/C5CE02069G |
| [18] |
G. Li, X. Wang, X. Ma, J. Energy Chem. 22 (2013) 357-362. DOI:10.1016/S2095-4956(13)60045-5 |
| [19] |
H. Lu, K. Xiang, N. Bai, et al., Mater. Lett. 167 (2016) 106-108. DOI:10.1016/j.matlet.2016.01.004 |
| [20] |
S.Q. Guo, X. Zhang, Z. Zhou, G.D. Gao, L. Liu, J. Mater. Chem. A 2 (2014) 9236-9243. DOI:10.1039/C4TA01567C |
| [21] |
B.G. Lee, S.H. Lee, J. Power Sources 343 (2017) 545-549. DOI:10.1016/j.jpowsour.2017.01.094 |
| [22] |
W. Guo, Y. Li, Y. Tang, et al., Electrochim. Acta 229 (2017) 197-207. DOI:10.1016/j.electacta.2017.01.135 |
| [23] |
X. Wang, G. Shen, Mater. Horiz. 15 (2015) 104-115. |
| [24] |
X. Wang, G. Li, Z. Chen, et al., Adv. Energy Mater. 1 (2011) 1089-1093. DOI:10.1002/aenm.201100332 |
| [25] |
L. Kong, X. Cao, J. Wang, et al., J. Power Sources 309 (2016) 42-49. DOI:10.1016/j.jpowsour.2016.01.087 |
| [26] |
D. Cao, Z. Yao, J. Liu, J. Zhang, C. Li, Energy Storage Mater. 11 (2018) 152-160. DOI:10.1016/j.ensm.2017.10.005 |
| [27] |
H. Usui, S. Yoshioka, K. Wasada, M. Shimizu, H. Sakaguchi, ACS Appl. Mater. Interfaces 7 (2015) 6567-6573. DOI:10.1021/am508670z |
| [28] |
C. Huang, J. Fu, H. Song, et al., RSC Adv. 6 (2016) 90489-90493. DOI:10.1039/C6RA19425G |
| [29] |
K. Brezesinski, J. Wang, J. Haetge, et al., J. Am. Chem. Soc. 132 (2010) 6982-6990. DOI:10.1021/ja9106385 |
| [30] |
V. Augustyn, J. Come, M.A. Lowe, et al., Nat. Mater. 12 (2013) 518-522. DOI:10.1038/nmat3601 |
| [31] |
A.A. Lubimtsev, P.R.C. Kent, B.G. Sumpter, P. Ganesh, J. Mater. Chem. A 1 (2013) 14951-14956. DOI:10.1039/c3ta13316h |
| [32] |
A.L. Viet, M.V. Reddy, R. Jose, B.V.R. Chowdari, S. Ramakrishna, Electrochim. Acta 56 (2011) 1518-1528. DOI:10.1016/j.electacta.2010.10.047 |
| [33] |
R. Kodama, Y. Terada, I. Nakai, S. Komaba, N. Kumagai, J. Electrochem. Soc. 153 (2006) A583-A588. DOI:10.1149/1.2163788 |
| [34] |
K.J. Griffith, A.C. Forse, J.M. Griffin, C.P. Grey, J. Am. Chem. Soc. 138 (2016) 8888-8899. DOI:10.1021/jacs.6b04345 |
| [35] |
M. Sasidharan, N. Gunawardhana, M. Yoshio, K. Nakashima, Mater. Res. Bull. 47 (2012) 2161-2164. DOI:10.1016/j.materresbull.2012.06.004 |
| [36] |
A.L. Viet, M.V. Reddy, R. Jose, B.V.R. Chowdari, S. Ramakrishna, J. Phys. Chem. C 114 (2010) 664-671. DOI:10.1021/jp9088589 |
| [37] |
J.M. Ma, L. Wang, B. Ruan, J. Xu, H. Liu, RSC Adv. 5 (2015) 36104-36107. DOI:10.1039/C5RA05935F |
| [38] |
Y. Zhao, X. Zhou, L. Ye, S.C.E. Tsang, Nano Rev. 3 (2012) 17631. DOI:10.3402/nano.v3i0.17631 |
| [39] |
J.W. Kim, V. Augustyn, B. Dunn, Adv. Energy Mater. 2 (2012) 141-148. DOI:10.1002/aenm.201100494 |
| [40] |
X. Liu, G. Liu, H. Chen, J. Ma, R. Zhang, J. Phys. Chem. Solids 111 (2017) 8-11. DOI:10.1016/j.jpcs.2017.07.007 |
| [41] |
C. Zhang, S.J. Kim, M. Ghidiu, M.Q. Zhao, et al., Adv. Funct. Mater. 26 (2016) 4143-4151. DOI:10.1002/adfm.v26.23 |
| [42] |
J. Zhang, H. Chen, X. Sun, et al., J. Electrochem. Soc. 164 (2017) A820-A825. DOI:10.1149/2.1351704jes |
| [43] |
G. Zhao, L. Zhang, C. Li, et al., Chem. Eng. J. 328 (2017) 844-852. DOI:10.1016/j.cej.2017.07.111 |
| [44] |
Y. Zhong, L. Su, M. Yang, J. Wei, Z. Zhou, ACS Appl. Mater. Interfaces 5 (2013) 11212-11217. DOI:10.1021/am403453r |
| [45] |
S. Laruelle, S. Grugeon, P. Poizot, et al., J. Electrochem. Soc. 149 (2002) A627-A634. DOI:10.1149/1.1467947 |
| [46] |
J. Yang, L. Jiao, Q. Zhao, et al., J. Mater. Chem. 22 (2012) 3699-3701. DOI:10.1039/c2jm15837j |
| [47] |
M. Zhen, L. Su, Z. Yuan, L. Liu, Z. Zhou, RSC Adv. 3 (2013) 13696-13701. DOI:10.1039/c3ra41341a |
| [48] |
S. Yuan, Z. Zhou, G. Li, CrystEngComm 13 (2011) 4709-4713. DOI:10.1039/c0ce00902d |
| [49] |
L. Su, Y. Jing, Z. Zhou, Nanoscale 3 (2011) 3967-3983. DOI:10.1039/c1nr10550g |
| [50] |
J.Y. Cheong, J.W. Jung, D.Y. Youn, et al., J. Power Sources 360 (2017) 434-442. DOI:10.1016/j.jpowsour.2017.06.030 |
| [51] |
M. Liu, C. Yan, Y. Zhang, Sci. Rep. 5 (2015) 8326-8331. DOI:10.1038/srep08326 |
| [52] |
J. Wang, J. Polleux, J. Lim, B. Dunn, J. Phys. Chem. C 111 (2007) 14925-14931. DOI:10.1021/jp074464w |
| [53] |
V. Augustyn, E. White, J. Ko, et al., Mater. Horiz. 1 (2014) 219-223. DOI:10.1039/C3MH00070B |
| [54] |
T. Brezesinski, J. Wang, S.H. Tolbert, B. Dunn, Nat. Mater. 9 (2010) 146-151. DOI:10.1038/nmat2612 |
| [55] |
M.R. Lukatskaya, B. Dunn, Y. Gogotsi, Nat. Commun. 7 (2016) 12647-12659. DOI:10.1038/ncomms12647 |
| [56] |
S.H. Kang, C.M. Park, J. Lee, J.H. Kim, J. Electroanal. Chem. 746 (2015) 45-50. DOI:10.1016/j.jelechem.2015.03.033 |
| [57] |
S. Lou, X. Cheng, L. Wang, et al., J. Power Sources 361 (2017) 80-86. DOI:10.1016/j.jpowsour.2017.06.023 |