 2018, Vol. 29


b State Key Laboratory of Advanced Technology for Materials Synthesis and Processing, School of Materials Science and Engineering, Wuhan University of Technology, Wuhan 430070, China;
c Institute of Physics, Chinese Academy of Sciences, Beijing 100190, China
Since the early 1990s when lithium-ion batteries (LIBs) were first commercialized, they have emerged as an important energy storage device for portable electronics [1-3]. LiCoO2 (LCO), due to its good energy capacity and stable cycling performance, is still an important cathode material in commercial LIBs [4]. With the fast development of electric vehicles (EV) and hybrid electric vehicles (HEV), consumer demand is driving research for batteries with higher storage capacity, better cycling stability, and greater power output. However, current LCO-based LIBs are operated at 3.9 V with only ~140 mAh/g in capacity, which is insufficient for EV to drive 300 miles that is common for gasoline-based vehicles. As the theoretical operating voltage for LCO is 4.5 V, one strategy is to increase the voltage of LCO with enhanced capacity (up to 272 mAh/g in theory at 4.5 V), thus improving the battery output energy density [5-7].
The current 140 mAh/g capacity of LCO corresponds to the deintercalation of 0.5 lithium ions from the Li1-xCoO2 structure (0 ≤ x ≤ 0.5) on cycling up to a charge cut-off voltage of 4.2 V. When charging the batteries beyond 4.2 V to remove more lithium ions from LCO, the anisotropic shrinkage of the rhombohedral α-NaFeO2 type lattice in the c direction will collapse its structure due to the repulsive interactions between CoO2 sheets [8-10]. Furthermore, it is proposed that, with the structural degradation of the LCO host material, a drastic increase in cobalt dissolution in the electrolyte also leads to the severe capacity fading. Although the capacity and average voltage are increased by directly charging/discharging at higher cut-off voltage, the cycling life of LCO rapidly decays [11-13]. Therefore, it is essential to improve the energy density while maintaining the good cycling performance in the large voltage working window.
Metal oxide coatings on the surface of LCO (e.g., by atomic-layer deposition, or ALD) has been demonstrated to suppress material degradation, cobalt diffusion, and dissolution during the charge/ discharge process, leading to larger capacity, much more stable cycling performance, and higher output voltage [14-17]. However, due to the expensive instrument, slow deposition rate and chemical limitation [18], the cost of ALD for surface coating is not economical and cannot be effectively applied for large-scale manufacturing. In this communication, we report a facile sol-gel method for Al2O3 coating on the surface of LCO to improve the capacity and cycling-life performance. The capacity and cycling behaviour of an Al2O3-coated LCO material was evaluated in coin cells versus lithium metal with various C rates (0.2-2 C rate) between 4.5 V and 3 V for different weight percentage coatings. More importantly, we combine the electron microscopy and X-ray absorption spectroscopy (XAS) to investigate the failure mechanism for the surface coating.
LiCoO2 (battery grade) was purchased from Sigma-Aldrich. The LiCoO2 electrode powders have an average particle size of ~10 μm. To obtain the Al2O3 coated LiCoO2, aluminum isopropoxide was dissolved in DI water at 90 ℃ for 1 h, after 5 drops 70% HNO3 solution adding, followed by stirring 24 h at 90 ℃. The obtained uniform sol was added to the LiCoO2 powder solution. The gel was formed after stirring 2 h at room temperature. The gel was heattreated at 600 ℃ for 5 h. The obtained samples are marked as LCO-0.5% (LiCoO2-0.5 wt% Al2O3), LCO-1%, and LCO-2%, respectively, which depends on the surface coating amount. The schematic illustration was shown in Scheme 1.

|
Download:
|
| Scheme 1. The schematic illustration of coated LCO samples synthesized by sol-gel method. | |
The electrochemical measurements were performed on a Land CT2001 A (Land. Wuhan Blue Electric Technology Co., Ltd., China) cell testing system at room temperature, where the voltage range was from 3 V to 4.5 V vs. Li+/Li. The electrodes are composed of an active material LiCoO2 or Al2O3-coated LiCoO2, carbon additive, and polyvinylidene fluoride (PVdF) with a weight ratio of 80:10:10. The slurry was cast on Alumina foil and dried at 100 ℃ in vacuum for 10 h. Coin cells CR2032 were assembled with lithium foil as the counter/reference electrode, a glass-fiber separator, and 1 mol/L LiPF6 in EC:DEC (1:1) as an electrolyte in an argon-filled glove-box. The active mass loading was ~2 mg/cm2.
Powder X-ray diffraction (XRD) was performed on a Bruker-AXS D8 Diffractometer with Cu Kα (λ = 1.5406 Å) radiation. Scanning electron microscope (SEM, Hitachi SU 70 microscope) at a working voltage of 5 kV was used to exam the morphology of the particles.
X-ray absorption near edge structure (XANES) and extended Xray absorption fine structure (EXAFS) experiments were carried out at beamline 5BM-D of DND-CAT of Advanced Photon Source (APS), Argonne National Laboratory (ANL). The following electrode materials were used: pristine LiCoO2 (LCO), LCO-0.2% (0.2 wt% Al2O3 coated LCO), LCO-0.5%, LCO-1%, and LCO-2% cathodes after 100 and 500 cycles. Samples were placed in a chamber with helium flow as the protection. A Vortex ME4 detector was used to collect the Co K transmission signal while a Si(111) monochromator scanned the incident X-ray photon energy through the Co K absorption edge. The X-ray beam was calibrated using a Co metal foil and CoO was used as the reference. Data reduction, data analysis, and EXAFS fitting were performed with the Athena, Artemis, and IFEFFIT software packages. Standard procedures were used to extract the EXAFS data from the measured absorption spectra. The pre-edge background was linearly fitted and subtracted. The post-edge background was determined using a cubic-spline-fit procedure and then subtracted. Normalization was performed by dividing the data by the height of the absorption edge at 50 eV.
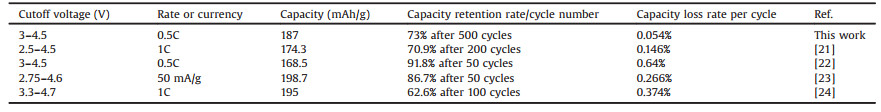
Fig. 1a shows the X-ray diffraction (XRD) patterns of bare LCO and the samples with different Al2O3 coatings. All the samples show the sharp peak in the 18.8 degree, corresponding to the (003) plane of LCO. Two additional strong peaks are located at 37.5 and 45.2 degrees, corresponding to the (101) and (104) planes of LCO, respectively. No obvious change can be observed, which indicates that the rhombohedral-NaFeO2 of LCO still remained after Al2O3 coating. However, no peak can be indexed for Al2O3, due to the low amount of Al2O3 that cannot be detected by lab-based XRD and its amorphous structure. Fig. S1 (Supporting information) and Fig. 1b show the scanning electron microscopy (SEM) images of the bare LCO, LCO-0.5%, LCO-1%, and LCO-2%. All the images show that the average particle size is ~10 μm. The size does not change after Al2O3 coating. However, the surface of coated samples is no longer as smooth as naked LCO, indicating Al2O3 was successfully coated on the surface of LCO. The energy-dispersive X-ray (EDX) detects (Fig. 1c) the Al signal at 1.5 keV in the coated samples, confirming the existence of Al2O3 on the surface of LCO. The thickness of the coating for LCO-0.5% sample is revealed in Fig. 1d by transmission electron microscopy (TEM) to vary from 20 nm to 50 nm. Isolated Al2O3 islands sitting on the surface were also observed.

|
Download:
|
| Fig. 1. (a) XRD patterns and (b) SEM images of LCO, LCO-0.5%, LCO-1%, and LCO-2%; (c) The EDX mapping result of elements; (d) The TEM images of LCO-0.5% sample. | |
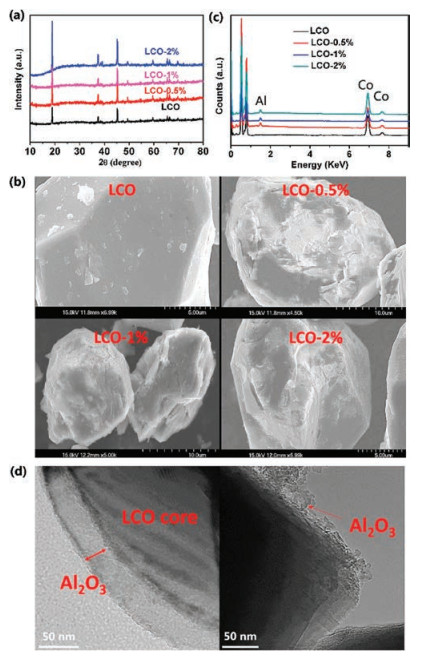
For the battery test, bare LCO delivers a capacity of 142 mAh/g at the range of 3-4.2 V at 0.5C rate (Fig. S2 in Supporting information, 1C refers to 142 mAh/g), which is the same as that reported previously [19, 20]. The capacity corresponds to 0.5 Li+ ion that is extracted from 1 LCO unit cell structure. First three charge/ discharge curves of LCO at 3-4.2 V overlap, indicating the excellent cycling performance at 4.2 cut-off voltage. Fig. S2 shows the cycling performance of LCO with different cut-off voltage ranges, 3-4.2 V and 3-4.5 V. It further confirmed that the bare LCO can deliver a stale cycling performance at the range of 3-4.2 V. When cycling at higher cut-off voltage of 4.5 V, although the capacity is increased to ~177 mAh/g, it quickly fades out. The first three charge/discharges curves do not overlap, and by the third cycle the capacity is already reduced to 165 mAh/g, as shown in Fig. 2a. After 100 cycles, the capacity decreases to 0 (Fig. 2b). Comparatively, LCO-0.5%, LCO-1% and LCO-2% not only show significant enhancement in capacity in the same charge/discharge range (3-4.5 V) at 0.5C rate but also exhibit much improved cycling performance. In particularly, LCO- 0.5% has the best performance, as the capacity is maintained at 157 mAh/g after 100 cycles. The value is still much higher than the capacity of LCO charged/discharged at the range of 3-4.2 V. Interestingly, after 100 cycles, LCO-1% and LCO-2% have 150 mA h/g and 137 mAh/g, respectively, and the capacity of LCO-2% fades slightly faster. Our tests suggest that for LCO-0.5% its capacity can reach 187 mAh/g with the average discharge voltage of ~3.95 V, delivering a high energy density of ~ 738 Wh/kg. In contrast, the bare LCO has only 142 mAh/g capacity in the range of 3-4.2 V with the average discharge voltage of 3.85 V, giving an energy density of only 547 Wh/kg. The proper Al2O3 coating increases the energy density of LCO by 35%, which makes it more useful in practical applications. Furthermore, the rate performance of LCO-0.5% was further investigated. As shown in Fig. 2c, at a low rate of 0.2C, the capacity can exceed 200 mAh/g. At the rates of 0.5C, 1C and 2C, the capacities are about 180, 170 and 160 mAh/g respectively. In addition, the capacity can recover to 170 mAh/g when back to 1C rate, indicating that the structure can tolerate changes during the Li+ ions fast insertion/extraction. We find that the subsequent cycling has no apparent fading, confirming its excellent cycling performance after Al2O3 coating. Although LCO-1% delivers a high capacity at low rate, its high-rate capacity is very low. The capacity is only 145 mAh/g and 85 mAh/g at 1C and 2C rates, respectively, as illustrated in the Fig. S3 in Supporting information. It can be due to the thick Al2O3 coating layer that leads to poor electronic conductivity. Fig. 2d shows the long cycling performance of the LCO-0.5% after 500 cycles with the remaining capacity at 141 mAh/g. The capacity retention is 73% of the initial capacity. It is also noted that for LCO-1%, although it can show good performance up to 100 cycles, it fails after 500 cycles (Fig. S4 in Supporting information) and the capacity decays to ~ 45 mAh/g over 500 cycles. Our results are comparable with that recently published literatures within three years. Our result shows a high capacity of 187 mAh/g. Its capacity loss rate is only 0.054% per cycle, which are much lower than others as the recent literatures. More details are shown in Table 1 [21-24].

|
Download:
|
| Fig. 2. (a) First-three cycles charge/discharge curves of bare LCO at 0.5C rate; (b) The cycling performance of LCO, LCO-0.5%, LCO-1%, and LCO-2% in the range of 3 V to 4.5 V at 0.5C rate; (c) The capacities of LCO-0.5% at different rates; (d) Long cycling performance of LCO-0.5% at 0.5C rate. | |
|
|
Table 1 Electrochemical performances of Al2O3 coated LCO electrodes in different literatures. |
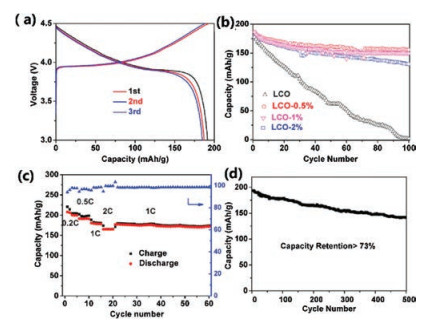
To understand the mechanism of the fading for bare LCO and coated samples, Co K-edge XAS measurements were carried out, as XANES can probe the oxidation state changes of Co in LCO after cycling and EXAFS can check local structure changes of LCO. In our previous studies, we have successfully applied XAS to investigate the catalyst restructurating [25, 26], lithium-battery reversible changes [27, 28], and cation site distributions for spinel pseudocapacitors as well as electrocatalysts [29, 30]. As shown in Fig. 3, we compared the XANES spectra of LCO, LCO-0.5%, LCO-1% and LCO-2% after 100 cycles and 500 cycles. It is observed in Fig. 3a that the Co edge of bare LCO after 100 cycles shifts to lower energy close to Co metal reference, suggesting that the bare LCO turns to metal cobalt. In contrast, the XANES edges of LCO-0.5% after 100 and 500 cycles in Fig. 3b alignwell with that of the pristine LCO. The good stability in Co oxidation state is consistentwith the excellent electrochemical performance of LCO- 0.5%, indicating the good protection of 0.5 wt% Al2O3 coating. Interestingly, higher Al2O3 surface coating cannot prevent the degradation of LCO, as both LCO-1% and LCO-2%, after 100 cycles show different degrees of Co edge shifts of XANES towards lower energy to overlap with Co metal. Although Co in LCO-1% after 100 cycles are partially reduced as shown in Fig. 3c, after 500 cycles LCO-1% completely becomes Co metal. These oxidation state changes provide clues of LCO failure in cycling: the reduction of Co3+ to Co0 metal leads to the degradation of LCO. These changes are further supported by EXAFS results in Fig. 4a. After 100 cycles, bare LCO and LCO-2% completely transfer to the cobalt metal, as the dominant peak located at 2.2 Å corresponds to the Co-Co metallic bond, as compared to the Co metal reference. LCO-0.5% still shows two sharp peaks located at1.5 Å and 2.6 Å (referred to Co-O and Co…Co of Co-O-Co scattering paths, respectively), while such two peaks in LCO-1% become broad, suggesting the partial change of LCO structure with 1 wt% Al2O3 coating and consistent with the XANES results. LCO-1% is better than bare LCO, but worse than LCO-0.5%. When the cell cycles 500 times, LCO-1% eventually becomes cobalt metal. The similarity in all EXAFS spectra of LCO-0.5% is indicative of its robust structurein battery performance.Differentfrom conventionalview, we conclude that the fading mechanism at higher cut-off voltage is the result of structure change from LiCoO2 to cobalt metal.

|
Download:
|
| Fig. 3. XANES spectra of (a) LCO, (b) LCO-0.5%, (c) LCO-1% and (d) LCO-2%. | |

|
Download:
|
| Fig. 4. Fourier transformed EXAFS spectra at the Co K-edge of LCO, LCO-0.5%, LCO-1%, and/or LCO-2% after (a) 100 cycles and (b) 500 cycles at the discharge state; (c) The surface and (d) inner TEM images of LCO-0.5% after 100 cycles. | |
Furthermore, post-cycling TEM was also employed to reveal the good cycling performance of LCO-0.5%. Figs. 4c and d show the surface and inner bulk structure after 100 cycles, respectively. The coating layer is about 20-50 nm on the surface, consistent with the initial surface layer thickness, suggesting no reaction between Al2O3 and LiCoO2 during the battery cycling. The excellent layer structure of LCO after cycling can still be seen after 100 cycles and the LCO (003) plan in Fig. 4d corresponds to the (003) peak in XRD pattern. These results further confirmed that the sample after suitable coating can maintain the structure of LCO and lead to great electrochemical performance.
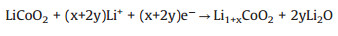
Based on our results, we propose the following reactions for the formation of Co metal:
|
(1) |

|
(2) |
The proper amount of Al2O3 coating can prevent the above reaction and maintain the intercalation and deintercalation of Li+ in and out of LCO lattice. Our experiments show that 0.5 wt% is the best surface coverage. The thin Al2O3 layer not only can protect the LCO cathode, but also retain good mechanical properties to elastically expand and shrink together with LCO lattices during the intercalation and deintercalation processes, thus elongating the cycle life. Less Al2O3 (e.g., 0.2 wt%, Fig. S5 in supporting information) coating cannot cover the whole LCO surface to effectively protect the cathode materials, while an overly thick coating (i.e., 1 wt% and 2 wt%) results in hard surface layer that reduces the electronic/ionic conductivity too much and loses the mechanical flexibility in battery charging-discharging as the bulk modulus of Al2O3 is approximately twice of the LCO [31]. The thick Al2O3 layer eventually cracks during the long cycling. The exposed LCO materials then deform following above reactions and degradation happens in cycling. On the other hand, the relatively slow Li mobility in Li-Al2O3 polymorphies (sluggish comparing with that of LCO) also suggests a thin coat in order to enable the Li intercalation [32-34].
In conclusion, we successfully synthesize Al2O3 for the surface coating on LCO by a facile and scalable sol-gel method. The coating thickness can be tuned by the content or concentration of aluminum isopropoxide sol-gel. The electrochemical performance of all the coating samples is significantly improved, especially for the LCO-0.5% sample (corresponding to 20~50 nm Al2O3 coating). Its capacity can remain at 157 mAh/g over 100 cycles and 141 mAh/g after 500 cycles at 0.5C rate. LCO-0.5% samples can deliver a high energy density of 738 Wh/kg between 3-4.5 V, increasing by 35% compared to bare LCO cycled at the range of 3-4.2 V. XANES and EXAFS measurements suggest that the fading mechanism of LCO samples cycled at the range of 3-4.5 V is the result of structure change and cobalt metal formation. The LCO-0.5% sample is an excellent cathode for high-energy-density and long-life LIBs. This sol-gel method can be used for other materials for surface coating. Our performance and mechanistic study provides guidance for the improvement of commercial lithium-ion battery that can operate at 4.5 V with higher energy density and longer cycling life.
AcknowledgmentsThis research is supported by Callahan Faculty Scholar Endowment Fund from Oregon State University, USA. XAS measurements were done at 5-BM-D of DND-CAT at Advanced Photon Source (APS) of Argonne National Laboratory (ANL). DNDCAT is supported through E. I. duPont de Nemours & Co., Northwestern University, and the Dow Chemical Company. The use of APS of ANL is supported by US Department of Energy (DOE) under Contract No. DE-AC02-06CH11357. Authors thank Dr. Qing Ma at DND-CAT for technical support.
Appendix A. Supplementary dataSupplementary material related to this article can be found, in the online version, at doi:https://doi.org/10.1016/j.cclet.2018.11.002.
| [1] |
T. Nagura, K. Tazawa, Batteries Sol. Cells 9 (1990) 20. |
| [2] |
K. Ozawa, Solid State Ionics 69 (1994) 212-221. DOI:10.1016/0167-2738(94)90411-1 |
| [3] |
K. Zaghib, M. Armand, M. Gauthier, J. Electrochem. Soc. 145 (1998) 3135-3140. DOI:10.1149/1.1838776 |
| [4] |
Q. Cao, H. Zhang, G. Wang, et al., Electrochem. Commun. 9 (2007) 1228-1232. DOI:10.1016/j.elecom.2007.01.017 |
| [5] |
L. Liu, Z. Wang, H. Li, L. Chen, X. Huang, Solid State Ionics 152 (2002) 341-346. |
| [6] |
Z. Chen, J. Dahn, Electrochim. Acta 49 (2004) 1079-1090. DOI:10.1016/j.electacta.2003.10.019 |
| [7] |
L. Dahéron, R. Dedryvere, H. Martinez, et al., Chem. Mater. 21 (2009) 5607-5616. DOI:10.1021/cm901972e |
| [8] |
H. Wang, Y.I. Jang, B. Huang, D.R. Sadoway, Y.M. Chiang, J. Electrochem. Soc. 146 (1999) 473-480. DOI:10.1149/1.1391631 |
| [9] |
S. Verdier, L. El Ouatani, R. Dedryvere, et al., J. Electrochem. Soc. 154 (2007) A1088-A1099. DOI:10.1149/1.2789299 |
| [10] |
A. Zhou, J. Xu, X. Dai, et al., J. Power Sources 322 (2016) 10-16. DOI:10.1016/j.jpowsour.2016.04.092 |
| [11] |
Y.K. Sun, S.W. Cho, S.T. Myung, K. Amine, J. Prakash, Electrochim. Acta 53 (2007) 1013-1019. DOI:10.1016/j.electacta.2007.08.032 |
| [12] |
B. Hwang, C. Chen, M. Cheng, R. Santhanam, K. Ragavendran, J. Power Sources 195 (2010) 4255-4265. DOI:10.1016/j.jpowsour.2010.01.040 |
| [13] |
Y. Kim, G.M. Veith, J. Nanda, R.R. Unocic, M. Chi, N.J. Dudney, Electrochim. Acta 56 (2011) 6573-6580. DOI:10.1016/j.electacta.2011.03.070 |
| [14] |
Y.S. Jung, P. Lu, A.S. Cavanagh, et al., Adv. Energy Mater. 3 (2013) 213-219. DOI:10.1002/aenm.v3.2 |
| [15] |
I.D. Scott, Y.S. Jung, A.S. Cavanagh, et al., Nano Lett. 11 (2010) 414-418. |
| [16] |
H.M. Cheng, F.M. Wang, J.P. Chu, et al., J. Phys. Chem. C 116 (2012) 7629-7637. |
| [17] |
J.S. Park, A.U. Mane, J.W. Elam, J.R. Croy, ACS Omega 2 (2017) 3724-3729. DOI:10.1021/acsomega.7b00605 |
| [18] |
S. Boukhalfa, K. Evanoff, G. Yushin, Energ. Environ. Sci. 5 (2012) 6872-6879. DOI:10.1039/c2ee21110f |
| [19] |
W.T. Jeong, K.S. Lee, J. Power Sources 104 (2002) 195-200. DOI:10.1016/S0378-7753(01)00916-8 |
| [20] |
T. Ohzuku, H. Tomura, K. Sawai, J. Electrochem. Soc. 144 (1997) 3496-3500. DOI:10.1149/1.1838039 |
| [21] |
W. Lu, J. Zhang, J. Xu, X. Wu, L. Chen, ACS Appl. Mater. Interfaces 9 (2017) 19313-19318. DOI:10.1021/acsami.7b03024 |
| [22] |
D. Zuo, G. Tian, D. Chen, K. Shu, Int. J. Electrochem. Sci. 12 (2017) 5044-5057. |
| [23] |
J. Xie, J. Zhao, Y. Liu, et al., Nano Research 10 (2017) 3754-3764. DOI:10.1007/s12274-017-1588-1 |
| [24] |
M. Xie, T. Hu, L. Yang, Y. Zhou, RSC Adv. 6 (2016) 63250-63255. DOI:10.1039/C6RA10531A |
| [25] |
Z. Feng, M. McBriarty, A. Mane, et al., RSC Adv. 4 (2014) 64608-64616. DOI:10.1039/C4RA14140G |
| [26] |
Z. Weng, Y. Wu, M. Wang, et al., Nat. Commun. 9 (2018) 415. DOI:10.1038/s41467-018-02819-7 |
| [27] |
B. Pan, J. Huang, M. He, et al., ChemSusChem 9 (2016) 595-599. DOI:10.1002/cssc.201501557 |
| [28] |
M. He, C.C. Su, Z. Feng, et al., Adv. Energy Mater. 7 (2017) 1700179. |
| [29] |
C. Wei, Z. Feng, M. Baisariyev, et al., Chem. Mater. 28 (2016) 4129-4133. DOI:10.1021/acs.chemmater.6b00713 |
| [30] |
C. Wei, Z. Feng, G.G. Scherer, et al., Adv. Mater. 29 (2017) 1606800. DOI:10.1002/adma.201606800 |
| [31] |
K. Persson, Materials Project (2014), doi: http://dx.doi.org/10.17188/1187823.
|
| [32] |
S. Xu, R.M. Jacobs, H.M. Nguyen, et al., J. Mater. Chem. A 3 (2015) 17248-17272. DOI:10.1039/C5TA01664A |
| [33] |
S.Y. Kim, Y. Qi, J. Electrochem. Soc. 161 (2014) F3137-F3143. DOI:10.1149/2.0301414jes |
| [34] |
S. Hao, C. Wolverton, J. Phy. Chem. C 117 (2013) 8009-8013. DOI:10.1021/jp311982d |