 2018, Vol. 29


b National Laboratory of Physical Sciences at Microscale and School of Life Science, University of Science and Technology of China, Hefei 230027, China;
c High Magnetic Field Laboratory, Chinese Academy of Sciences, Hefei 230031, China
Fluorescence spectroscopy has been widely used to study the motility, local micro-viscosity and structure of proteins [1, 2]. The development of the picosecond pulsed laser enabled the measurement of the time-resolved fluorescence lifetime and anisotropy. Fluorescence lifetime is the average time that a fluorophore stayed in the excited state following a pulse excitation [3]. It is the intrinsic property of fluorescence group and independent of the sample concentrations [4]. Compared to fluorescence intensity measurement, fluorescence lifetime can not only avoid bleaching and scattering interference [5, 6], but also detect the population of discrete conformational states. Time-resolved fluorescence anisotropy is another fluorescence parameter which can reflect the rotational diffusion rate of macromolecules [7]. Anisotropy measurements can provide information on size and shape of proteins or rigidity of various molecular environments [8]. So the measurements of fluorescence lifetime and anisotropy are ideal tools for tracking the conformation changes and dynamics of fluorophore-marked proteins.
YgaP is the only membrane-integrated rhodanese in E. coli, consisting of a cytosolic rhodanese domain and a transmembrane domain (TMD) with two α-helices (TMH1 and TMH2) forming the interface of the homodimer [9, 10] (Fig. 1a). Rhodanese is also called sulfurtransferase, which has been reported to be involved in sulfur transfer of different physiological processes in prokaryotic and eukaryotic cells, especially for the cyanide detoxification process [9, 11]. Cyanide is a highly toxic chemical compound used by many primitive organisms for various reasons, such as defense. However, cyanide could inhibit the activity of many enzymes and interrupt the oxidation process of the transmission electron [12]. To detoxify cyanide, the cytosolic rhodanese domain catalyzed the sulfate transferation from thiosulfate anion (S2O32-) to cyanate (CN-), forming non-toxic thiocyanate (SCN-). This process relied on the Cys residue in the six-amino acid active site loop at the C-terminal of the rhodanese domain [13]. As the only membrane-integrated rhodanese in E. coli, YgaP may also participate in the binding and outward transportation of SCN- across the TMD. Actually, Eichmann group has reported the solution NMR structure of rhodanese domain and the TMD of YgaP in detergent micelles, and found that significant chemical shift perturbations were observed on the YgaP transmembrane helices upon the addition of SCN-, but not in the YgaP rhodanese domain [14].

|
Download:
|
| Fig. 1. (a) The full-length dimeric YgaP contains a TMD and a cytosolic catalytic rhodanese domain. Each monomer is colored green or purple, separately. (b) The designated sites labeled with fluorescent unnatural amino acid (HC). (c) Coommassie-stained SDS-PAGE gel (left) and the fluorescence image (right) of the purified YgaP protein in DPC | |
Here, we used site-specific incorporation of fluorescent unnatural amino acid, (7-hydroxycoumarin-4-yl)-ethylglycine (HC), and the fluorescence lifetime and anisotropy to explore the mobility details and conformational changes of YgaP TMD upon SCN- binding. Due to its good photochemical properties and much smaller size (263 Da) than fluorescent protein, incorporation of 7-HC into protein has attracted much attention in protein fluorescence studies [15, 16]. To obtain conformational changes of the TMD, we chose sites located across the TMH2 and one site on TMH1, as shown in Fig. 1b. To carry out the experiment under two different conditions, the purified condition and in situ condition, YgaP protein was first purified from E. coli in 0.2% (w/v) N-phenylanthranilic acid (DPC) buffer. Then the purified samples were tested by coommassie-stained SDS-PAGE gel and the UVfluorescence image to ensure the presence of proteins (Fig. 1c). As for in situ condition, poly-styrene-maleic-acid (SMA), an organic macromolecular compound was used to wrap around phospholipid and extract the intact membrane components to form SMA polymers sample in a disc shape [17, 18]. The sample was finally packed in 2% SMA.
We used the time correlated single-photon counting fluorimeter (TCSPC) (DeltaFlex, Horiba Scientific) to measure the fluorescent lifetime and anisotropy of different samples labeled with the fluorescent HC. This fluorimeter is equipped with a 374 nm diodepulsed laser and a picosecond photon detector, and a time-toamplitude converter can convert a total of 4096 channels with the range of 27 ps per channel for data acquisition. The instrument response time was measured at the excitation wavelength of 374 nm using 0.01% dilution of Ludox AS40 colloidal silica (SigmaAldrich) diluted in deionized water. In order to eliminate polarization effects, fluorescence intensity decay was measured with a vertically oriented polarizer on the excitation and a magic angle (54.71° to the vertical) polarizer on the emission. All decays were collected with a 10, 000 counts at peak.
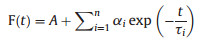
The fluorescence intensity decay curve was fitted with a sum of multiple exponential components, and different components of the fluorescence lifetime were derived:
|
(1) |
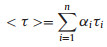
The overall average lifetime was calculated as the sum of normalized pre-exponential multiplied by the lifetimes:
|
(2) |
n is the number of all different lifetimes, τi is the lifetime of them, αi is a pre-exponential factor or weighting factor representing the amplitude of the component at t = 0. The best acceptable fitting result is to use the minimum n value to meet with a data-fitting chi-squared value (χ2) below 1.2.
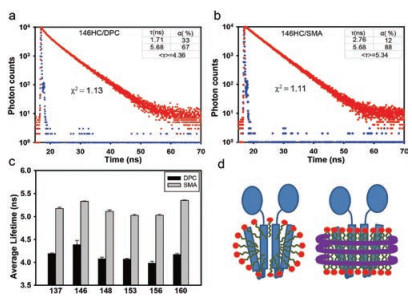
The fitting result of fluorescence intensity decay showed two components in either DPC or SMA. For example, the fluorescence lifetime values of YgaP-V146HC in DPC were approximately 1.71 ns and 5.68 ns. The corresponding weighting factors for the two lifetimes were 33 and 67, respectively (Fig. 2a). The fluorescence lifetime values of YgaP-V146HC in SMA were approximately 2.76 ns and 5.68 ns. The corresponding weighting factors for the two lifetimes were 12 and 88, respectively (Fig. 2b). To estimate the influence of SMA, the lifetime of 2% SMA was measured. The fluorescence lifetime of 2% SMA was in 10-11 magnitude at 450 nm, far less than the fluorescence lifetime of the sample, so the impact of SMA can be ignored in the experiment (Fig. S1 in Supporting information).

|
Download:
|
| Fig. 2. Fluorescence lifetime analysis of YgaP in two conditions. The fluorescence intensity decays of YgaP-146HC in DPC (a) and SMA (b) respectively. τ is the lifetime of each component, and α is the corresponding weighting factor for each of them. (c) Average fluorescence lifetime of different sites of YgaP in DPC or SMA. (d) Schematic diagram of YgaP wrapped in DPC micelle (left), or packed in SMA shown as purple strings (right) | |
Due to the high sensitivity of fluorescence lifetime to the local environment around the fluorophore, the two components of fluorescence lifetime we obtained here suggested at least two conformations of the labeled sites in certain protein. The high τ value indicates slow decay or a stable fluorophore environment, while the low τ value indicates a fast decay or high probability of quenching. In SMA, the population of high τ value is much higher than that in DPC, suggesting the preference of the site 146 in a more stable environment in SMA. And the difference of overall average lifetime values between SMA and DPC conditions is mainly due to increasing of α2 (the population of high τ value) and complementary decreasing of α1 (the population of low τ value).
The average fluorescence lifetime of HC in other sites was similar to YgaP-V146HC, with higher fluorescence lifetime in SMA than that in DPC (Fig. 2c). Each site contained two components of fluorescence lifetime, and all the corresponding weighting factors for high τ value conformation were much higher in SMA than that in DPC (Table S1 in Supporting information). These results strongly suggested the existence of two conformations in YgaP proteins, which is consistent with reported EPR spectroscopy-based distance restraint result, where two main distances were obtained at position 158 in liposomes in the apo-state [14]. Furthermore, YgaP protein remained in the intact membrane phospholipid environments in SMA, with relative small perturbation. So the uniform membrane environments constrained the conformational freedom of the protein into a more stable state. However, DPC rewrapped YgaP protein in micelles, with small constraint of the heterogeneous environment on the protein, resulting in relative large flexibility in protein conformations (Fig. 2d).
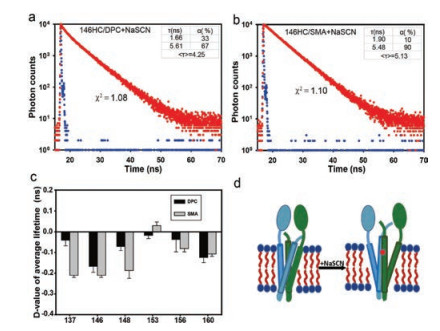
Then we measured the fluorescence lifetime values with the presence of SCN-. There were also two components of the fluorescence lifetime upon SCN- binding. In DPC, the two fluorescence lifetime values of YgaP-V146HC + NaSCN were approximately 1.66 ns and 5.61 ns. The corresponding weighting factors for two lifetimes were 33 and 67, respectively (Fig. 3a). Compared to YgaP-V146HC/DPC, the overall average lifetime values changed, mainly due to the small decreasement on the values of both τ1 and τ2. In SMA, the two fluorescence lifetime values of YgaP-V146HC + NaSCN were approximately 1.90 ns and 5.48 ns. The corresponding weighting factors for two lifetimes were 10 and 90, respectively (Fig. 3b). Compared to YgaP-V146HC/ SMA, the overall average lifetime values also changed, mainly because of the small decreasement on the values of both τ1 and τ2. Besides, α1 for the lower fluorescence lifetime value decreased from 12% to 10%, α2 for the higher fluorescence lifetime value increased from 88% to 90%. Either in DPC or SMA, the two components of the fluorescence lifetime decreased slightly. It suggested that SCN- binding to either conformations of YgaP induced a possible movement of TMH2, which in turn disturbed the microenvironment of residues located on the edge of TMH2.

|
Download:
|
| Fig. 3. Fluorescence lifetime analysis of YgaP in the presence of NaSCN. The fluorescence intensity decays of YgaP-146HC with NaSCN in DPC (a) or SMA (b), respectively. τ is the lifetime of each component, and α is the corresponding weighting factor for each of them. (c) NaSCN induced average fluorescence lifetime change of different sites in YgaP in DPC or SMA respectively. The D-value is calculated as the average lifetime of YgaP-NaSCN minus the average lifetime of YgaP alone. (d) Hypothetical model of YgaP in lipid membrane upon SCN- binding. Ellipsoids represented as the rhodanese domain, and cylinders represented as the TMD | |
More HC fluorescence lifetime were examined from other sites of YgaP in the presence of SCN- (Table S1). In SMA, SCN- application induced dramatically changes of average fluorescence lifetime in residues located on the terminal of transmembrane helices, including S137, V146, and A148 (Fig. 3c). However, in DPC, the average lifetime changes of these residues were not as large as that in SMA upon SCN- application. A possible explanation would be that the constraint of micelles is weaker than that of membrane phospholipid for the residues on the edge of transmembrane helices.
For residues located on the middle of transmembrane helices, such as A153, S156, and G160, SCN- application-induced changes of average fluorescence lifetime showed small difference between SMA treatment and DPC treatment. The average fluorescence lifetime changes of sites A153 and S156 were very small upon SCN- binding, probably due to small microenvironment changes. Obvious fluorescence lifetime changes happened in residues S137, V146, A148, and G160. Previous experiments of CW-EPR showed apparent spectrum broadening of variants 137, 146, 148, 160 when SCN- was added to the sample [19]. The result is consistent with the changes of average fluorescence lifetime in our experiment. Based on the NMR structure of YgaP, the binding site of SCN- was close to G160, leading to fluorescence lifetime changes of this residue (Fig. 3d). On the other hand, residues on the edge of transmembrane helices also showed fluorescence lifetime changes upon SCN- application, suggesting a microenvironment change in this region.
Time-resolved fluorescence anisotropy is another fluorescence parameter which can reflect the rotational diffusion rate of protein molecules. Anisotropy measurements can also provide information on size and shape of proteins or rigidity of various molecular environments. The polarizer was set at vertical direction, and the detection wavelength was 450 nm, the maximum emission of the sample. Then vertically (IVV(t)) and orthogonally (IVH(t)) polarized emission decays were collected with a 10, 000 counts at peak. The polarization bias (G factor) of the fluorescence detection system was deserved by measuring the emission decays of 0.01% dilution of Ludox AS40 colloidal silica (Sigma-Aldrich) through two additional decays, IHV(t) and IHH(t) with orthogonally polarized light, and the detection wavelength was setted at 374 nm.
The time-resolved anisotropy, r(t), was calculated as below:
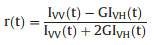
|
(3) |
|
(4) |
Then further fitting of fluorescence anisotropy curve was made to obtain the value of rotation correlation time:

|
(5) |
r∞ is the limiting anisotropy at infinite time, r0 is the initial anisotropy at t = 0, τr is the rotational correlation time.
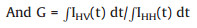
The time-resolved fluorescence anisotropy could provide motion information for the fluorophore [20]. We calculated the values of rotation correlation time through the fluorescence anisotropy curve. Interestingly, it is observed that the motion of most residues in SMA is much slower (higher τ1 value) than that in DPC, except for the 146 site (Fig. 4). Since the SMA-YgaPphospholipid complex molecule is much larger than YgaP-DPC micelles, it is reasonably to suppose that the relative motion of SMA-YgaP-phospholipid complex is slower than the small micelles molecule. For site 146 on the N-terminal of TMH2, the rotation correlation time value in DPC is much higher than that in SMA. We presumed a possible interaction between the 146 residue and DPC molecules, which restricted the motion of this residue. Besides, SCN- addition decreased the rotation correlation time value of site 146, but increased the rotation correlation time value of site 148. This may infer a movement of residue 146 away from DPC molecule but a movement of residue 148 towards the edge of micelles upon SCN- binding. Compared to DPC, the motion of all residues in SMA is milder, even after adding of SCN-. It indicated that SMAphospholipid environment is more uniform for YgaP protein.

|
Download:
|
| Fig. 4. Fluorescence anisotropy analysis of YgaP in different conditions. (a) (b) The fluorescence intensity decays with polarized detection and (c) (d) anisotropy analysis of YgaP-146HC in DPC and SMA respectively. (e) Rotational correlation time τ1 of YgaP at different sites in DPC and SMA. (f) The fluorescent unnatural amino acid, HC, moves within the motion of YgaP protein | |
In summary, the measurement of time-resolved fluorescence lifetime showed two different conformations existing in YgaP protein, which is consistent with the EPR spectroscopy-based distance restraints result. The residues (S156, G160) located in the middle of TMH2 may take part in the binding of SCN-, and the conformation change could transfer into the N-terminal of the helices. We speculated that the conformation change near extracellular side may play an important role in SCN- output. The results of time-resolved fluorescence lifetime and fluorescence anisotropy both revealed that the terminal of transmembrane helices in micelles may be in a different package from that in situ condition. Since SMA could extract the intact membrane components from cytomembrane, it can be a good material to reflect the protein conformation change in situ condition.
AcknowledgmentsThis work was supported by the National Key R & D Program of China (Nos. 2016YFA0400900, 2017YFA0505300), and the Instrument Developing Project of the Chinese Academy of Sciences (No. YZ201564).
Appendix A. Supplementary dataSupplementary material related to this article can be found, in the online version, at doi:https://doi.org/10.1016/j.cclet.2018.08.002.
| [1] |
B.P. Maliwal, J.R. Lakowicz, Biophys. Chem. 19 (1984) 337-344. DOI:10.1016/0301-4622(84)87016-7 |
| [2] |
C. Wang, X. Song, L. Chen, Y. Xiao, Biosens. Bioelectron. 91 (2017) 313-320. DOI:10.1016/j.bios.2016.11.018 |
| [3] |
A.J. Lee, W.B. Asher, H.A. Stern, K.L. Bren, T.D. Krauss, J. Phys. Chem. Lett. 4 (2013) 2727-2733. DOI:10.1021/jz401259y |
| [4] |
S. Liu, P. Lv, D. Li, et al., Chem. Commun. 51 (2015) 15971-15974. DOI:10.1039/C5CC06124E |
| [5] |
J. Lakowicz, Principles of Fluoresence Spectroscopy, Springer, Boston, 2006, pp. 1-27.
|
| [6] |
Y.C. Chen, R.M. Clegg, Photosynth. Res. 102 (2009) 143. DOI:10.1007/s11120-009-9458-7 |
| [7] |
J.M. Beechem, L. Brand, Annu. Rev. Biochem. 54 (1985) 43-71. DOI:10.1146/annurev.bi.54.070185.000355 |
| [8] |
S. Veiksina, S. Kopanchuk, A. Rinken, Anal. Biochem. 402 (2010) 32-39. DOI:10.1016/j.ab.2010.03.022 |
| [9] |
R. Cipollone, P. Ascenzi, P. Visca, IUBMB Life 59 (2007) 51-59. DOI:10.1080/15216540701206859 |
| [10] |
C. Tzitzilonis, C. Eichmann, I. Maslennikov, S. Choe, R. Riek, PLoS One 8 (2013). |
| [11] |
H.W. Li, Y.C. Bi, B. Xia, C.W. Jin, Biomol. NMR Assign. 5 (2011) 101-103. DOI:10.1007/s12104-010-9277-y |
| [12] |
R. Cipollone, P. Ascenzi, P. Tomao, F. Imperi, P. Visca, J. Mol. Microb. Biotech 15 (2008) 199-211. DOI:10.1159/000121331 |
| [13] |
D. Bordo, D. Deriu, R. Colnaghi, et al., J. Mol. Biol. 298 (2000) 691-704. DOI:10.1006/jmbi.2000.3651 |
| [14] |
C. Eichmann, C. Tzitzilonis, E. Bordignon, et al., J. Biol. Chem. 289 (2014) 23482-23503. DOI:10.1074/jbc.M114.571935 |
| [15] |
J.Y. Wang, J.M. Xie, P.G. Schultz, J. Am. Chem. Soc. 128 (2006) 8738-8739. DOI:10.1021/ja062666k |
| [16] |
J. Luo, R. Uprety, Y. Naro, et al., J. Am. Chem. Soc. 136 (2014) 15551-15558. DOI:10.1021/ja5055862 |
| [17] |
T.J. Knowles, R. Finka, C. Smith, et al., J. Am. Chem. Soc. 131 (2009) 7484-7485. DOI:10.1021/ja810046q |
| [18] |
D. Li, J. Li, Y. Zhuang, et al., Protein Cell 6 (2015) 229-233. DOI:10.1007/s13238-014-0129-x |
| [19] |
S. Ling, W. Wang, L. Yu, et al., Sci. Rep.-UK 6 (2016) 20025. DOI:10.1038/srep20025 |
| [20] |
D. Roy, S.K. Mondal, K. Sahu, et al., J. Phys. Chem. A 109 (2005) 7359-7364. DOI:10.1021/jp0520143 |