 2018, Vol. 29


Fluorescence techniques are crucial for life science and medicine and constantly evolving as the novel fluorescent markers and imaging equipment continue to be developed. The utility of fluorescence imaging has generated a tremendous incentive to develop new probes for biological applications. Conventional biological applications employing fluorescence usually include molecular imaging, cell tracking, and biosensing [1-7]. The broad applicability of fluorescence imaging has promoted the development of more versatile fluorescent markers which can be used for both single- and multi-color imaging purposes. Organic fluorophores such as genetically encoded fluorescent proteins and chemically synthesized fluorescent dyes are the most commonly used fluorophores [8-10]. However, there are two significant limitations of these organic fluorophores for further applications. First, they cannot fluoresce continuously for long periods. Second, they are not optimized for multicolor imaging applications, which may be due to their relatively broad emission spectra [11]. Thus, an ideal fluorescent marker for fluorescence imaging should be bright, biocompatible, and stable against photobleaching with narrow emission profiles, and it is highly desirable to develop various other fluoresecent probes to overcome the limitations of conventional organic fluorophores.
Recently, quantum dots (QDs) have been widely used as superior fluorescent materials for imaging and other biomedical applications [12-17]. More specifically, conventional QDs commonly refer to semiconductor QDs which are composed of a semiconductor material core such as cadmium selenide (CdSe), lead selenide (PbSe), or indium arsenide (InAs) and a shell [18]. Compared to organic small molecule dyes, the main advantages of semiconductor QDs include their modifiable nanoparticle surfaces for versatile bioconjugation, their adaptable photophysical properties for multiplexed detection, and their superior stability for longer investigation time [19], which enlarge their application fields and lead to an exponential increase of the related research articles [20-23]. However, the further applications of semiconductor QDs are limited by some shortcomings, among which the most serious one is the toxicity issue caused by the heavy metal elements that they contain [24]. Therefore, more efforts have been devoted to searching for alternative QD-like photoluminescent materials. Then, some new classes of semiconductor QD-like fluorescent nanomaterials have emerged such as carbon nanodots (or carbon dots, CDs) [25], silicon quantum dots (SiQDs) [26], and polymer dots (Pdots) [27]. CDs with the superior properties including facile and cost-effective fabrication, strong fluorescence emission, excellent photostability, and good biocompatibility, have gained significant attention in applications such as bioimaging, drug delivery, and sensing of metal cations [28-33]. SiQDs have also captured substantial attention over the last two decades due to the abundance of Si element, biocompatibility, and optical properties [34-36]. Additionally, Pdots have attracted great interest because of their extraordinary fluorescence brightness, fast emission rate, excellent photostability, and good biocompatibility [37, 38]. Collectively, the appearance of these new types of QDs opens new avenues for biomedical applications.
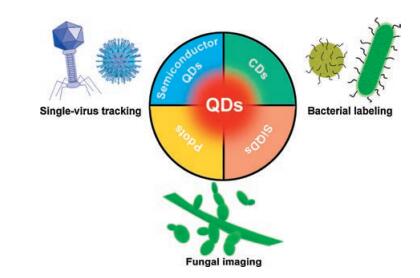
On the other hand, the microbial infection (e.g., virus, bacterial, or fungal infection) is a very complicated process, involving multiple infection steps and interactions with cellular structures [39-41]. Thus, an effective microbial imaging method is indispensable to study the spatio-temporal dynamics and mechanisms of microbial infection in live cells. Besides, microbial imaging can also be applied in microbial viability assessment, microbial distinguishment (such as Gram-type differentiation of bacteria), and microbial quantification. In this review, we mainly summarize the current developments of QDs for microbial imaging (Fig. 1).

|
Download:
|
| Fig. 1. QDs discussed in this review and their representative applications in microbial imaging. | |
2. Single-virus labeling and tracking
Single-virus tracking enables a better understanding of the interaction between viruses and the host cells through visualizing the process of infection, including attachment, entry, replication, and egress. To date, fluorophors for labeling viruses are mainly classified as organic dyes (e.g., cyanine5 (Cy5)) [42], fluorescent proteins (e.g., green fluorescent protein, GFP) [43], and nanoparticles (e.g., QDs) [44]. Compared with organic dyes and fluorescent proteins, QDs possess unique optical properties such as high quantum yield and photostability, so QDs are very suitable for long-term and highly sensitive single-virus tracking [45]. So far, QD labeling strategies (mainly via semiconductor QDs) for virus imaging have been mostly divided into three categories based on the labeled sites: (1) labeling external components, (2) labeling internal components, and (3) labeling other components.
2.1. Labeling external componentsSome researchers have reported the use of QDs to label external components of viruses [46, 47]. Based on the biotin-streptavidin interaction, a virus particle can be recognized by a primary antibody, bound by a biotinylated secondary antibody and then finally tagged by streptavidin-conjugated QDs [46-48]. Joo et al. successfully tagged retroviruses with QDs through the membrane incorporation of a short acceptor peptide (AP) that is susceptible to site-specific biotinylation for further attachment of streptavidinconjugated QDs (Fig. 2A) [49]. The transport of QD-labeled virus to endosomes was also monitored in real time. As shown in Fig. 2B, the colocalization of the green virus with a red endosome was maintained for an extended period of time (up to 708 s), demonstrating that QDs can be used to monitor the intracellular movement of lentiviruses in live cells. The two-step biotin streptavidin labeling is a very easy labeling strategy with high efficiency and stability. The labeled viruses still possess high infectivity, which is very crucial for tracking infection behaviors in situ [50].

|
Download:
|
| Fig. 2. (A) General strategy for the site-specific labeling of enveloped viruses with QDs. (B) Real-time monitoring of the transport of QD-labeled virus to endosomes. Rab5 (a small GTPase, red)-expressing 293T cells were incubated with QD-labeled lentiviruses (green) to initiate virus internalization. The arrows indicate the internalized viral particle. Reprinted with permission [49]. Copyright 2008, American Chemical Society. (C) Schematic illustration of the general strategy for the specific labeling of viruses with QDs via strain-promoted metal-free click chemistry. (D) Confocal imaging analysis to confirm the entry of viruses into A549 cells. Reprinted with permission [57]. Copyright 2012, American Chemical Society. | |
Direct chemical labeling methods have also been widely used. For example, Joo et al. reported a general method of labeling adenoassociated virus serotype 2 (AAV2) with QDs using amine-carboxyl crosslinking reaction for enhanced visualization of the intracellular behavior of viruses in living target cells [51]. Click chemistry provides another more efficient and facile conjugation strategy under mild conditions to eliminate undesirable side reactions, minimize steric hindrance, and improve reproducibility [52-54]. The copper-free click chemistry has also been used to label enveloped viruses with QDs [55, 56]. As shown in Fig. 2C, Zhang et al. synthesized a novel class of multifunctional imidazole-based multidentate polymer ligand to yield conjugation-ready QDs with superior stability and developed an efficient living virus labeling method by QDs via strain-promoted click chemistry [57]. The labeled viruses carrying a tubulin-GFP reporter gene effectively entered the cytoplasm of A549 cells, indicating that viruses labeled with QDs by click chemistry still maintained their infectivity (Fig. 2D). This method is less destructive, reliable, and universal, without specific requirements for the type and structure of viruses.
2.2. Labeling internal componentsUtilization of QDs for single virus tracking has attracted growing interest. Through modification of viral surface proteins, viruses can be labeled with various functionalized QDs for tracking the routes of viral infections. However, incorporation of QDs on the viral surface may affect the efficiency of viral entry, alter virus cell interactions, and cause the impossibility to monitor the late infection events after the loss of envelope [58, 59]. In contrast, encapsulating QDs into enveloped viral capsids may be one option to tackle these problems. Taking the advantage of the selfreplication capability of real viruses in their host cells, virus labeling has been achieved by coupling with genetic engineering during the virus replication process [60-64].
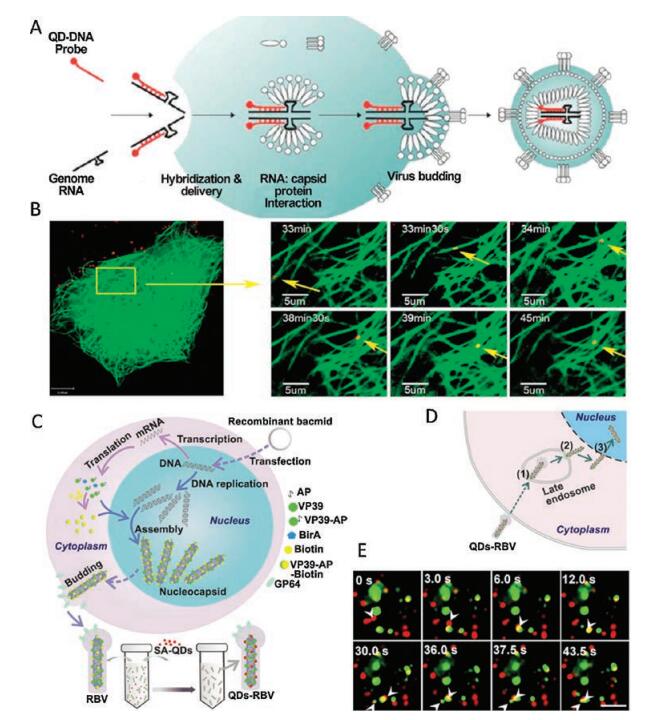
Zhang et al. encapsulated QDs inside the core of vesicular stomatitis virus glycoprotein (VSV-G) pseudotyped HIV-1-based lentivirus (PTLV) during virus assembly in living cells [58]. QDs conjugated with modified genomic RNAs (gRNAs), which contain a packaging signal sequence for viral genome encapsulation, can be packaged into viruses together with the gRNAs. The process of encapsulating QDs into the capsid of VSV-G PTLV in living cells was illustrated in Fig. 3A. It can be observed that PTLV-QD complexes moved along the microtubules (Fig. 3B), providing visible details for microtubule-dependent transport of VSV infection. Furthermore, Wen et al. proposed a host cell-assisted strategy to label the nucleocapsid of real enveloped viruses with QDs [59]. Their strategy was to first construct a recombinant bacmid inserted with genes encoding the fusion protein VP39-AP and the biotin ligase BirA. As shown in Fig. 3C, by transfecting host spodoptera frugiperda (Sf9) cells with the recombinant bacmid, VP39-AP and BirA can be co-expressed in the cytoplasm. VP39-AP-biotin can be biochemically acquired and transported to cell nucleus to assemble the biotinylated nucleocapsid, which finally results in the formation of the recombinant baculovirusn (RBV). Streptavidinconjugated QDs (SA-QDs) are subsequently used to site-specifically label the nucleocapsid of RBV to obtain QDs-RBV. The key steps for baculovirus infection of host Sf9 cells can be divided into the following three processes: (1) the entry of virus into late endosome, (2) the subsequent nucleocapsid release, and (3) the transportation of nucleocapsid into cell nucleus (Fig. 3D). As shown in Fig. 3E, QDs-RBV is entering a late endosome, which subsequently fuses with another late endosome already internalized with QDs-RBV, indicating that different endosomes containing viruses fuse together to form a large vesicle. Compared with the conventional labeling strategy by modifying viral proteins based on chemical reactions, such host cell-assisted labeling approaches have been proved to be milder, without damaging the infectivity of viruses.

|
Download:
|
| Fig. 3. (A) Working principle of encapsulating QDs into the capsid of VSV-G PTLV in living cells. (B) Real-time tracking of PTLV-QD transporting along the microtubules to the perinuclear region. Reprinted with permission [58]. Copyright 2013, American Chemical Society. (C) Schematic illustration of QDs-RBV production. (D) The key steps including the entry of virus into late endosome (1), the envelope loss and the nucleocapsid release (2), and the transportation of nucleocapsid into the nucleus (3) involved in the baculovirus infection process in host Sf9 cell. (E) Time-lapse confocal microscopy images of the arrowed QDs-RBV (red) being transported to the Lysotracker green-stained late endosome (green) of Sf9 cell (scale bar: 5 μm). Reprinted with permission [59]. Copyright 2014, Elsevier. | |
2.3. Labeling other components
Generally, viruses are composed of DNA/RNA that carry genetic information, a protein coat (called the capsid) which protects the genetic materials, and in some cases an envelope of lipids that surrounds the protein coat. Whereas, there are still a few viruses that do not possess the complex structures. For example, prion is only composed of protein, which is rich in histidine (His) that provides the specific binding site for divalent metal ions. In this context, Luo et al. employed polyethylene glycol (PEG)-interspersed nitrilotriacetic acid-modified QDs-Ni2+ complex to specifically label the His-rich prion protein, and the transport behaviors of prion were tracked in live cells [65].
As mentioned above, the QD-based single-virus tracking (SVT) technique is a favorable tool to investigate the real-time, in situ, and long-term dynamics of the virus in live cells. However, there are also several issues that need to be ironed out. For instance, the size of some QDs (~10 nm) is a bit large for labeling the small viruses. Besides, to minimize the influence of QDs on virus transport, it is optimal to track one virus labeled with one QD. Although labeling one protein with one QD is easy to be achieved [66], a virus with complex structures contains a variety of proteins, which poses a challenge for realizing the goal of labeling one virus with one QD. To overcome these drawbacks, it is highly desirable to develop new types of QDs and new conjugation/labeling methods.
3. Bacterial labelingDue to the wide spread of pathogenic bacteria and their serious threat to public health, the rapid and accurate detection of bacteria remains an important biomedical issue [67]. In the past years, many dyes have been applied to label bacteria, such as small molecule dyes and fluorescent polymers [68-70]. Except for these dyes, QDs have also been widely used as a kind of promising bioprobes for bacterial imaging [71, 72]. In this review, QDs used for bacterial labeling are divided into four categories: (1) semiconductor QDs, (2) CDs, (3) SiQDs, (4) Pdots.
3.1. Semiconductor QDs for bacterial labelingIn recent years, semiconductor QDs (also referred to as semiconductor nanocrystals) have drawn increasing attention due to their unique structural, electronic, and optical properties originating from their large surface area-to-volume ratio and quantum confinement effect [73-75]. Compared to organic dyes, semiconductor QDs are characterized by continuous absorption bands, narrow fluorescence emission spectra, and high chemical stability [76-78]. The fluorescence emission mechanism of semiconductor QDs is the radiative recombination of an excited electron-hole pair [79]. Their absorption spectra are very broad and contain quantum confinement features; while their emission spectra are rather narrow, which can be tuned by the variations of core size, composition, and surface chemistry. Besides, the quantum yields (QYs) of semiconductor QDs are usually in the range of 10%-80% [80]. In the following, we will focus on the numerous recent studies of using semiconductor QDs for bacterial targeting and labeling [81-90].
Leevy et al. treated the biotinylated Zn-dipicolylamine (DPA) probe with streptavidin-coated QDs and created extremely bright fluorescent imaging probes (Fig. 4A) [89]. Specifically, the Zn-DPA biotin conjugate 1 and streptavidin-coated red/green quantum dots (RQD/GQD) were mixed to give the 1- RQD/1-GQD nanoparticle complex. As shown in Fig. 4B, after treatment with 1-RQD and 1-GQD, Escherichia coli (E. coli) JM83 cells were stained with the probes and emitted red and green fluorescence signals, respectively. In addition, Aldeek et al. investigated how QDs capped by the hydrophilic 3-mercaptopropionic acid (MPA) or hydrophobic amino acids like leucine or phenylalanine (Phe) associate with the biofilm produced by the Gram-negative Shewanella oneidensis [90]. The structures of different types of QDs used in this work are listed in Fig. 4C. Spatial distribution/accumulation of the QDs in the biofilm was quantified by using autocorrelation function such as semi-variogram. The differences in semi-variograms γ(h, α) obtained from biofilms stained with amphiphilic CdSe/ZnS@dihydrolipoic acid (DHLA)-Phe QDs and CdSe(S)@MPA QDs indicate that the dispersion of the probes within the biofilm is sensitive to their amphiphilicity (Fig. 4D).

|
Download:
|
| Fig. 4. (A) Association of Zn-DPA-biotin conjugate 1 with a streptavidin-coated QD. (B) Fluorescence micrographs of E. coli cells stained with 1-RQD (left) and 1-GQD (right). Reprinted with permission [89]. Copyright 2008, Royal Society of Chemistry. (C) Structures of the different types of QDs used in the literature. (D) (a) and (c): Confocal microscopy images of a biofilm labeled with CdSe/ZnS@DHLA-Phe and CdSe(S)@MPA QDs, respectively. (b) and (d): Semi-variograms γ(h, α) obtained from the confocal microscopy images (a) and (c), respectively. Reprinted with permission [90]. Copyright 2011, Elsevier. | |
3.2. CDs for bacterial labeling
Semiconductor QDs have been used for optical bioimaging applications, but their long-term cytotoxic effects may limit their further uses [91]. The accidental discovery of CDs during the separation and purification of single-walled carbon nanotubes by Xu et al. in 2004 [92] triggered subsequent studies to explore the fluorescence properties of CDs and create a new class of fluorescent nanomaterials. Unlike semiconductor QDs, two classes of fluorescence emission mechanisms have been proposed for CDs. The first class is related with band gap transitions caused by conjugated π-domains, while the second one involves more intricate origins associated with surface defects in CDs [93]. CDs exhibit absorption in the near ultraviolet-visible region and emissions in the visible region or even the near-infrared (NIR) region. Besides, the fluorescence emission of CDs is usually excitation wavelengthdependent. The QYs of CDs with passivated surfaces can usually exceed 60%, much higher than those with unpassivated surfaces [93]. The superiority of CDs over semiconductor QDs for optical imaging is due to their good biocompatibility and excellent fluorescence properties (e.g., strong brightness, broad excitation spectra, high photostability, and multicolor fluorescence) [94-97]. Generally, CDs can be classified into the following four kinds according to their structures and properties [98]: (1) carbon quantum dots with obvious crystal lattices [93], (2) graphene QDs with single or a few graphene layers and connected chemical groups on the edges [99], (3) carbon nanodots without crystal lattices [100], and (4) carbonized polymer dots with polymeric structures or polymer/carbon hybrid structures [101]. However, there are few reports on the use of graphene QDs and carbonized polymer dots for microbial imaging [102]. Besides, since a large number of reports do not provide the X-ray diffraction patterns or high-resolution transmission electron microscopy images of CDs to determine whether the CDs have crystal lattices, herein, in this review, we will focus our discussions on carbon quantum dots with obvious crystal lattices and carbon nanodots without clear crystal lattices (collectively referred to as CDs) used for microbial imaging.
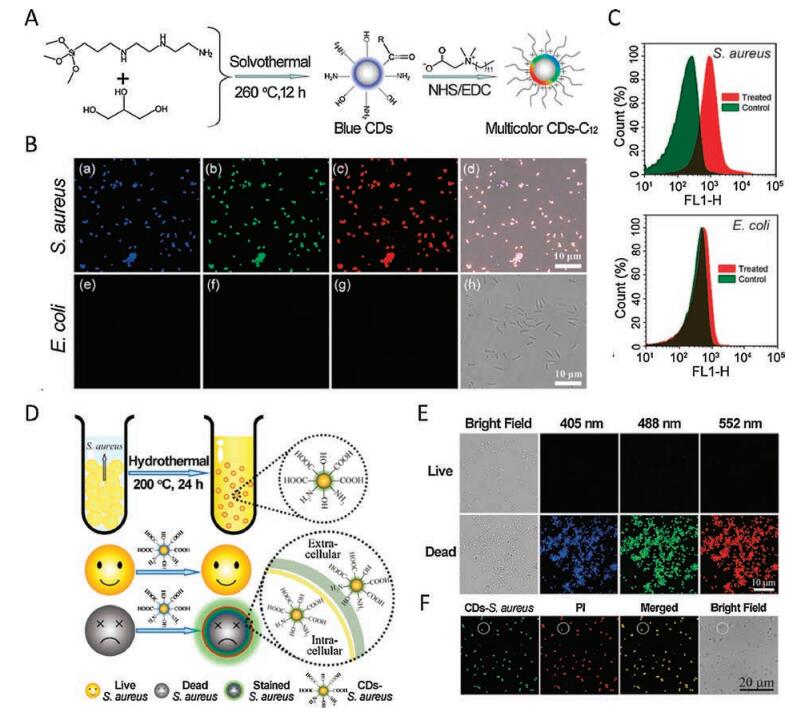
For ease of observation, the labeling of pathogens with proper fluorescent dyes is often required. Fluorescent CDs have been used to label pathogenic bacteria, and the recent advances of CDs used for bacterial imaging are summarized in Table 1 [103-119]. So far, our group has prepared quaternized CDs (abbreviated as CDs-C12) with the ability of selective imaging of Gram-positive bacteria using the carboxyl-amine reaction between lauryl betaine and amine-functionalized CDs (Fig. 5A) [114]. Typically, as shown in Fig. 5B, after incubating Staphylococcus aureus (S. aureus, Grampositive bacteria) with CDs-C12, different emission colors of CDsC12 in the bacteria are clearly visualized under different excitation wavelengths. In contrast, E. coli cells (Gram-negative bacteria) display no noticeable fluorescence signals under the same condition. Flow cytometric experiments were also performed to quantitatively analyze the fluorescence signals of CDs-C12-treated S. aureus and E. coli cells, and the results reveal that Gram-positive bacteria can be selectively stained by CDs-C12 (Fig. 5C). Besides, fluorescent CDs prepared by a one-step hydrothermal treatment of bacteria were first reported by our group for selectively imaging dead microbial cells (e.g., bacteria) (Fig. 5D) [116]. As shown in Fig. 5E, the dead S. aureus cells are clearly stained with the CDs-S. aureus (CDs prepared from the hydrothermal treatment of S. aureus cells) and visualized in all three channels with different colors including blue, green, and red when excited at 405, 488, and 552 nm, respectively. However, the live S. aureus cells display no noticeable fluorescence signals under the same condition, indicating that only the dead bacteria can be selectively stained by the CDs. Furthermore, the fluorescence of CDs colocalizes well with that of propidium iodide (PI, which can stain dead bacteria red) in dead bacterial cells, and the live bacteria are neither labeled by PI nor CDs (Fig. 5F), further confirming that the CDs could only stain dead bacteria.
|
|
Table 1 Summary of representative CDs used in bacterial imaging. |


|
Download:
|
| Fig. 5. (A) Schematic illustrating the preparation of multicolor CDs-C12. (B) Confocal images of E. coli and S. aureus bacteria after incubation with CDs-C12 under excitation of 405 (a, e), 488 (b, f), and 552 nm (c, g), respectively. (d) and (h) are the corresponding overlay channels. (C) Flow cytometry assay to quantify the fluorescence intensities of S. aureus and E. coli before and after treatment with CDs-C12. Reprinted with permission [114]. Copyright 2016, American Chemical Society. (D) Schematic of the synthetic route and selective dead bacterial staining of CDs-S. aureus. (E) Confocal images of live and dead S. aureus cells stained with CDs-S. aureus. (F) Confocal images of live and dead S. aureus cells stained by CDs-S. aureus and PI. Reprinted with permission [116]. Copyright 2017, Royal Society of Chemistry. | |
3.3. SiQDs for bacterial labeling
Silicon or silicon-containing nanomaterials, a series of important nanomaterials with attractive properties including huge surface area-to-volume ratios, favorable biocompatibility, improved multifunctionality, and excellent electronic/mechanical properties [120, 121], have been developed for various applications ranging from electronics to biology. Various silicon nanomaterials have been developed, such as silicon nanorods [122], silicon noanowires [123], and silicon nanodots [124]. Among these silicon nanomaterials, SiQDs as representative zero-dimensional silicon nanostructures, are considered an extremely biocompatible materials [125-129]. The fluorescence emission mechanism of SiQDs is the electron-hole radiative recombination via direct band gap transition [130], similar to that of semiconductor QDs. SiQDs usually show strong absorption in the visible spectrum [131] and emit light from the near infrared throughout the visible [132]. The QYs of SiQDs are usually higher than 10% [132]. Luminescent SiQDs hold great potential in biological imaging due to their low toxicity [133-137]. Strictly speaking, some fluorescent silicon nanodots do not necessarily possess size effect and quantum confinement effect.
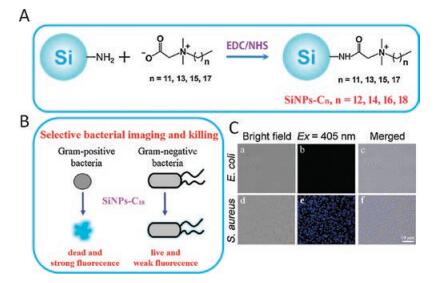
Our group has prepared a series of quaternized silicon nanoparticles (SiNPs) using a simple reaction between the amine groups on the surface of SiNPs (prepared via the microwave- assisted reaction between (3-aminopropyl)trimethoxysilane and trisodium citrate) and the carboxyl groups of N-alkyl betaines (Fig. 6A) [138]. The obtained quaternized SiNPs can realize the selective imaging of Gram-positive bacteria (Fig. 6B), as confirmed by our experimental results in Fig. 6C. The selective bacterial imaging capability of these quaternized SiNPs make them useful for the facile, fast, accurate, and cost-effective differentiation of Gram-positive bacteria from Gram-negative ones. This is especially important since the Gram-type differentiation of an unknown type of bacteria dictates the use of suitable antibiotics for efficient and timely infection treatment.

|
Download:
|
| Fig. 6. (A) Schematics of the synthetic route of quaternized SiNPs, and (B) the selective Gram-positive bacterial killing and imaging by quaternized SiNPs. (C) Confocal images of (a–c) E. coli and (d–f) S. aureus bacteria after incubation with SiNPs-C18 for 1 h. Scale bar is 10 μm. Reprinted with permission [138]. Copyright 2016, Wiley. | |
3.4. Pdots for bacterial labeling
Polymer dots (Pdots), a subset of semiconducting polymer nanoparticles, are required to contain semiconducting polymers with a volume or weight fraction higher than 50%, preferably 80% - 90% [139]. Besides, Pdots should also contain a hydrophobic polymerinterior which is essential to their colloidal stability, packing density of fluorophores, and fluorescence brightness. The fluorescence emission mechanism of Pdots is the recombination of the excited electrons with the holes, similar to that of semiconductor QDs or SiQDs. Pdots exhibit broad absorption bands and multi- color, narrow, and symmetric emissions that span the full range of the visible spectrum [139]. More importantly, the QYs of Pdots usually exceed 70%, higher than those of semiconductor QDs with comparable particle sizes [140]. Recently, Pdots have emerged as a new class of promising fluorescent nanoprobes that exhibit exceptional fluorescence brightness, excellent photostability, high emission rates, facile surface functionalization, and low cytotoxicity (Fig. 7A) [141-147]. These advantageous propertiesmake themwellsuited for applications in biological imaging and sensing [148].

|
Download:
|
| Fig. 7. (A) Advantageous properties and features of Pdots. Reprinted with permission [143]. Copyright 2015, Elsevier. (B) Synthetic route for the water-soluble polymer PBF. (C) Schematic preparation of PBF nanoparticles. (D) Phase-contrast (left image) and fluorescence microscopy image (right image) of E. coli incubated with PBF nanoparticles. Reprinted with permission [149]. Copyright 2012, American Chemical Society. (E) Schematic of covalently functionalized semiconducting polymer for specific bacterial targeting. (F) Fluorescence microscopy images of S. aureus (a and b) and P. aeruginosa (c and d) labeled with Van-Pdots (a and c) or PB-Pdots (b and d), respectively. Reprinted with permission [150]. Copyright 2014, Royal Society of Chemistry. | |
A new water-soluble conjugated polymer containing fluorene and boron-dipyrromethene repeat units in the backbones (PBF) that exhibits red emission was synthesized by Chong et al. (Fig. 7B) [149]. PBF nanoparticles were then prepared by adding excess amounts of 3, 30-dithiodipro-pionic acid (SDPA) aqueous solutions to the PBF solution (Fig. 7C). As shown in the fluorescence microscopy image, E. coli cells stained with PBF nanoparticles emit bright red fluorescence (Fig. 7D), which was the direct proof of the interaction between PBF nanoparticles and the bacteria. Besides, semiconducting polymers containing antibiotic units for specific bacterial cell labeling were realized by Wan et al. (Fig. 7E) [150]. First, Pdots were prepared by injection of a polymer suspended in a tetrahydrofuran solution into water under ultrasonication. Then, bioconjugates were prepared via carboxyl-amine reaction between the formed Pdots and vancomycin or polymyxin B. The obtained products are abbreviated as Van-Pdots and PB-Pdots, respectively. The fluorescence microscopy images of S. aureus and P. aeruginosa cells incubated with Van-Pdots or PB-Pdots (Fig. 7F) suggest that Van-Pdots and PB-Pdots can selectively recognize/image S. aureus and P. aeruginosa, respectively.
There have been ongoing efforts to develop Pdots with NIR fluorescence [151, 152]. One approach is based on the physical blending of NIR-emitting fluorophores into Pdot matrices [153]. However, the leaching of the dopant fluorophores from the Pdot matrix remains a critical problem in applications that require longterm monitoring [154]. Another method is to directly incorporate NIR fluorescent moieties into the semiconducting polymer backbones via robust covalent bonds [155]. However, some drawbacks still exist in these Pdots such as their broad emission spectra [146]. Thus developing Pdots with NIR fluorescence and narrow-bandemitting is promising for biological imaging and urgently needed.
4. Fungal labelingApproximately 400 of the known fungal species are human pathogens, 50 of which cause systemic or central nervous system infection [156]. For example, Fusarium oxysporum (F. oxysporum) is an opportunistic pathogen of immunocompromised patients which causes 100% mortality [157]. Thus, developing novel and highly sensitive methods for the early detection of fungi is required. Methods based on polymerase chain reactions have been developed to detect fungi [158]. However, these methods are costly and require a relatively large amount of the fungi [159]. Due to the unique optical properties of semiconductor QDs and CDs, recent decades have witnessed considerable research progress in their applications in fungal labeling [159-165].
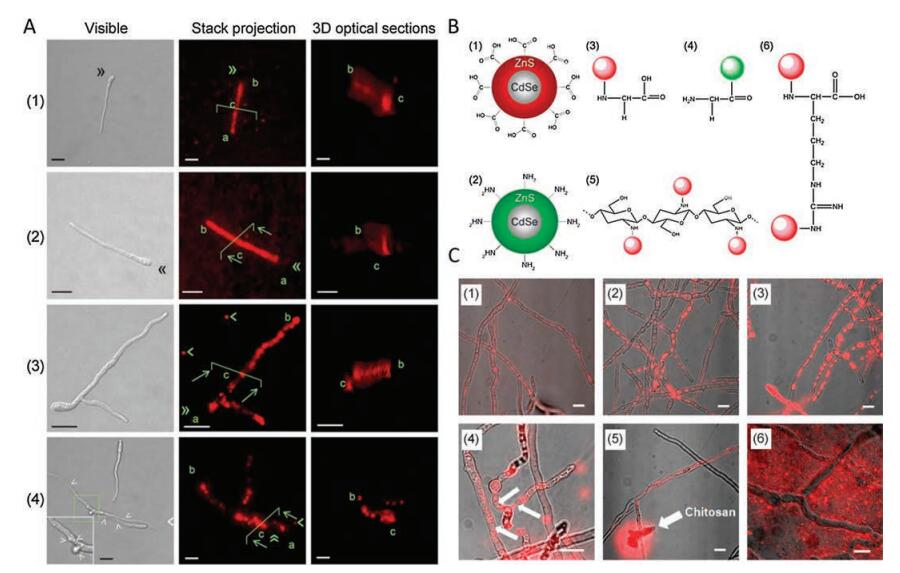
4.1. Semiconductor QDs for fungal labelingThe interaction between QDs and F. oxysporum cells was studied by Rispail et al. through evaluating the internalization of QDs at different concentrations [159]. As shown in the stack projections and 3D optical sections (Fig. 8A), after incubation for 10 min, MPAQDs were rapidly attracted and internalized by the fungal hyphae and this situation remained unchanged for 3 h. After 16 h of incubation, MPA-QDs were not homogeneously distributed but grouped in well-defined clusters in the hyphae. After removing MPA-QDs, the mycelium was resuspended in new medium without MPA-QDs for 4 h, MPA-QDs were still observed in discrete aggregates inside the fungus although in a slightly lower number. This work shows that MPA-QDs may be applied for the rapid and sensitive detection of F. oxysporum. Whiteside et al. assessed QDs as a new tool to observe uptake and translocation of organic nitrogen by fungi [160]. They conjugated QDs to the amine groups of glycine, arginine, and chitosan and incubated the products with Penicillium solitum fungi (a saprotroph) (Fig. 8B). After incubation with these QDs, Penicillium solitum fungi showed uptake and translocation of QD-labeled organic nitrogen, but no uptake of QD controls (Fig. 8C). This work represents one of the earliest studies to demonstrate the direct uptake of organic nitrogen by arbuscular mycorrhizal fungi.

|
Download:
|
| Fig. 8. (A) Dynamics of MPA-QDs in a suspension of growing F. oxysporum. F. oxysporum was incubated with MPA-QDs for (1) 10 min, (2) 3 h, and (3) 16 h. (4) Hyphal suspension was incubated with MPA-QDs for 16 h and then incubated in new medium without MPA-QDs for an additional 4 h. Reprinted with permission [159]. Copyright 2014, American Chemical Society. (B) Schematic diagram of quantum dots and configurations of quantum dot conjugates. (1) For quantum dots that bind to the amine groups of organic compounds, the receptor molecules are carboxyl groups. (2) For quantum dots that bind to carboxyl groups, the receptor molecules are amine groups. (3) Aminebound glycine, (4) carboxyl-bound glycine, (5) amine-bound chitosan, and (6) amine-bound arginine. (C) Superimposed (white light and fluorescence) confocal laser scans of Penicillium solitum uptake of quantum dot-organic nitrogen (QD-ON) conjugates. (1) At 2 h of incubation with QD-glycine, fungal hyphae showed evidence of uptake. (2) At 6 h, less labeled glycine was seen in solution and more within the hyphae. (3) After 24 h negligible labeled glycine was seen outside of the hyphae. (4) After 24 h, QD-arginine fluorescence appeared in the cytoplasm but not in vesicles (arrows). (5) Uptake of QD-labeled chitosan after 5 h of incubation. (6) QD controls (QDs unbound to glycine) after 24 h of incubation showed no signs of uptake. Reprinted with permission [160]. Copyright 2009, Ecological Society of America. | |
4.2. CDs for fungal labeling
Recently, CDs have also been used as fluorescent probes for imaging fungal cells [163]. For example, Kasibabu et al. developed a one-step hydrothermal route for the preparation of fluorescent CDs using Carica papaya juice as a carbon source (Fig. 9A) [164]. As shown in the confocal fluorescence images (Fig. 9B), the strong green and red fluorescence signals were observed in CD-labeled Aspergillus aculeatus cells when excited at 488 and 561 nm, respectively. Besides, Jin et al. synthesized pH-sensitive CDs by one-pot hydrothermal treatment of threonine [165]. The fluorescence of the obtained CDs is pH-dependent, with the intensity decreasing as pH increases. The fluorescence of the CDs distributed in apple tissue infected by the fungal cells was soon quenched by the basic buffer (Fig. 9C), indicating that there is no intracellular pH regulation in the dead cells. Consequently, intracellular pH regulation, a kind of physiological functions of living cells, can be visually expressed as the fluorescence signal variation of the CDs. Besides, the above-mentioned bacteria-derived CDs synthesized by our group can selectively stain the dead fungal cells but not the live ones [116], indicating the potential of the CDs as an excellent candidate for microbial live/dead differentiation and viability assessment.

|
Download:
|
| Fig. 9. (A) One-step hydrothermal synthesis of fluorescent C-dots (CDs) using Carica papaya juice as a precursor. (B) Confocal fluorescence images of Aspergillus aculeatus cells after incubation with CDs at excitation wavelengths of (1) 488 nm and (2) 561 nm. Reprinted with permission [164]. Copyright 2015, Springer. (C) Representative time-dependent confocal fluorescence images of plant pathogenic fungal cells and the infected apple tissue after co-incubation in the basic buffer. Arrowheads with black and red cores indicate living fungal cells and the infected apple tissue, respectively. Reprinted with permission [165] Copyright 2015, Elsevier. | |
Although several types of CDs have been used for the labeling and detection of fungi, most of the CDs used for imaging are excitable by ultraviolet (UV) light or blue light [166-174]. Thus, more efforts should be devoted to developing new types of CDs that can be efficiently excited by long-wavelength light for safe fungal imaging.
5. Conclusions and outlookIn this review, we have summarized the recent progress for fluorescent QDs in single-virus tracking, bacterial labeling, and fungal imaging. Compared with the traditional small molecule organic dyes, QDs have unique optical properties such as high fluorescence quantum yields, photostability, and modifiable surfaces, which are beneficial for potential applications in bioimaging. In the case of single- virus tracking, we introduce the labeling strategies from three aspects: labeling external components, internal components, and other components. Although many efforts have been devoted to exploring QDs for single-virus labeling in recent years, there are still several issues that need to be addressed in the future. First, to label the small viruses, the smaller QDs need to be synthesized. Second, to minimize the influence of QDs on virus transport, the labeling strategy based on one virus labeled with one QD need to be developed. Third, current QDs for virus imaging are mainly semiconductor QDs, and more other types of QDs such as CDs, SiQDs, and Pdots should also be developed and tested for potential virus labeling.
On the other hand, although various QDs such as semiconductor QDs, CDs, SiQDs, and Pdots have all been used for bacterial imaging, reports on the use of SiQDs and Pdots for fungal imaging are still lacking. Further, to obtain better imaging performance of QDs, there are still several issues that need to be addressed. First, the long-term cytotoxic effects of semiconductor QDs may limit their in vitro and in vivo imaging applications. Second, most of the CDs show strong emission only in the blue or green light wavelength regions, and the development of novel CDs with efficient red or NIR light emission is urgently desired. Besides, many CDs have multicolor emissions which may cause spectral overlap issues when other dyes are simutaneously used. Therefore, developing CDs with single-color emission is also important for practical fluorescence imaging applications. Third, some drawbacks exist in using Pdots for microbial imaging such as their broad emission spectra, so developing Pdots with narrow-band-emitting is highly needed. Finally, careful surfure functionalizations using various targeting ligands and/or microbial responsive moieties may hold great promise for enhancing the targeting efficiency and/or theranostic performance of the above-mentioned QDs. We believe that the traditional and emerging QDs will find increasing bioimaging applications in the future.
AcknowledgmentsWe thank the National Natural Science Foundation of China (No. 21673037), Natural Science Foundation of Jiangsu Province (No. BK20170078), Innovative and Entrepreneurial Talent Recruitment Program of Jiangsu Province, Fundamental Research Funds for the Central Universities, and Scientific Research Foundation of Graduate School of Southeast University (No. YBJJ1778) for financial support.
| [1] |
R. Alford, H.M. Simpson, J. Duberman, et al., Mol. Imaging 8 (2009) 341-354. |
| [2] |
Y. Yu, C. Feng, Y.N. Hong, et al., Adv. Mater. 23 (2011) 3298-3302. DOI:10.1002/adma.201101714 |
| [3] |
Z.H. Lei, P. Yue, X.L. Wang, et al., Chem. Commun. 53 (2017) 10938-10941. DOI:10.1039/C7CC06031A |
| [4] |
H.H. He, Z.W. Ye, Y. Zheng, et al., Chem. Commun. 54 (2018) 2842-2845. DOI:10.1039/C7CC08886H |
| [5] |
H.H. He, Z.W. Ye, Y. Xiao, et al., Anal. Chem. 90 (2018) 2164-2169. DOI:10.1021/acs.analchem.7b04510 |
| [6] |
J. Yao, M. Yang, Y.X. Duan, Chem. Rev. 114 (2014) 6130-6178. DOI:10.1021/cr200359p |
| [7] |
L.L. Song, Z.H. Lei, B.Y. Zhang, et al., Anal. Methods 6 (2014) 7597-7600. DOI:10.1039/C4AY01729C |
| [8] |
G. Miesenböck, D.A. De Angelis, J.E. Rothman, Nature 394 (1998) 192-195. DOI:10.1038/28190 |
| [9] |
R.N. Dsouza, U. Pischel, W.M. Nau, Chem. Rev. 111 (2011) 7941-7980. DOI:10.1021/cr200213s |
| [10] |
L.J. Jiao, C.J. Yu, T. Uppal, et al., Org. Biomol. Chem. 8 (2010) 2517-2519. DOI:10.1039/c001068e |
| [11] |
J.K. Jaiswal, S.M. Simon, Trends Cell Biol. 14 (2004) 497-504. DOI:10.1016/j.tcb.2004.07.012 |
| [12] |
L. Li, T.J. Daou, I. Texier, et al., Chem. Mater. 21 (2009) 2422-2429. DOI:10.1021/cm900103b |
| [13] |
H. Li, W.Q. Kong, J. Liu, et al., Carbon 91 (2015) 66-75. DOI:10.1016/j.carbon.2015.04.032 |
| [14] |
A. Gupta, M.T. Swihart, H. Wiggers, Adv. Funct. Mater. 19 (2009) 696-703. DOI:10.1002/adfm.v19:5 |
| [15] |
C.F. Wu, C. Szymanski, Z. Cain, J. McNeill, J. Am. Chem. Soc. 129 (2007) 12904-12905. DOI:10.1021/ja074590d |
| [16] |
R. Freeman, T. Finder, I. Willner, Angew. Chem. Int. Ed. 48 (2009) 7818-7821. |
| [17] |
Y.M. Yang, W.Q. Kong, H. Li, et al., ACS Appl. Mater. Interfaces 7 (2015) 27324-27330. DOI:10.1021/acsami.5b08782 |
| [18] |
M.A. Walling, J.A. Novak, J.R.E. Shepard, Int. J. Mol. Sci. 10 (2009) 441-491. DOI:10.3390/ijms10020441 |
| [19] |
K.D. Wegner, N. Hildebrandt, Chem. Soc. Rev. 44 (2015) 4792-4834. DOI:10.1039/C4CS00532E |
| [20] |
A.M. Smith, H.W. Duan, A.M. Mohs, S.M. Nie, Adv. Drug Deliv. Rev. 60 (2008) 1226-1240. DOI:10.1016/j.addr.2008.03.015 |
| [21] |
P. Zrazhevskiy, M. Sena, X.H. Gao, Chem. Soc. Rev. 39 (2010) 4326-4354. DOI:10.1039/b915139g |
| [22] |
Y.C. Wang, R. Hu, G.M. Lin, I. Roy, K.T. Yong, ACS Appl. Mater. Interfaces 5 (2013) 2786-2799. DOI:10.1021/am302030a |
| [23] |
B. Zhang, R. Hu, Y.C. Wang, et al., RSC Adv. 4 (2014) 13805-13816. DOI:10.1039/C4RA00288A |
| [24] |
P.G. Luo, S. Sahu, S.T. Yang, et al., J. Mater. Chem. B 1 (2013) 2116-2127. DOI:10.1039/c3tb00018d |
| [25] |
X.Q. Wu, J. Zhao, S.J. Guo, et al., Nanoscale 8 (2016) 17314-17321. DOI:10.1039/C6NR05864G |
| [26] |
J.H. Warner, A. Hoshino, K. Yamamoto, R.D. Tilley, Angew. Chem. Int. Ed. 44 (2005) 4550-4554. |
| [27] |
F.M. Ye, C.F. Wu, Y.H. Jin, et al., J. Am. Chem. Soc. 133 (2011) 8146-8149. DOI:10.1021/ja202945g |
| [28] |
G. Gao, Y.W. Jiang, J.J. Yang, F.G. Wu, Nanoscale 9 (2017) 18368-18378. DOI:10.1039/C7NR06764J |
| [29] |
X.W. Hua, Y.W. Bao, Z. Chen, F.G. Wu, Nanoscale 9 (2017) 10948-10960. DOI:10.1039/C7NR03658B |
| [30] |
J.J. Yang, G. Gao, X.D. Zhang, et al., Nanoscale 9 (2017) 15441-15452. DOI:10.1039/C7NR05613C |
| [31] |
L.Q. Wang, X.Y. Wang, A. Bhirde, et al., Adv. Healthcare Mater. 3 (2014) 1203-1209. DOI:10.1002/adhm.v3.8 |
| [32] |
X.W. Hua, Y.W. Bao, F.G. Wu, ACS Appl. Mater. Interfaces 10 (2018) 10664-10677. DOI:10.1021/acsami.7b19549 |
| [33] |
G. Gao, Y.W. Jiang, H.R. Jia, J.J. Yang, F.G. Wu, Carbon 134 (2018) 232-243. DOI:10.1016/j.carbon.2018.02.063 |
| [34] |
Z.H. Kang, Y. Liu, S.T. Lee, Nanoscale 3 (2011) 777-791. DOI:10.1039/C0NR00559B |
| [35] |
B.F.P. McVey, R.D. Tilley, Acc. Chem. Res. 47 (2014) 3045-3051. DOI:10.1021/ar500215v |
| [36] |
M. Dasog, K. Bader, J.G.C. Veinot, Chem. Mater. 27 (2015) 1153-1156. DOI:10.1021/acs.chemmater.5b00115 |
| [37] |
L.P. Fernando, P.K. Kandel, J.B. Yu, et al., Biomacromolecules 11 (2010) 2675-2682. DOI:10.1021/bm1007103 |
| [38] |
C.F. Wu, T. Schneider, M. Zeigler, et al., J. Am. Chem. Soc. 132 (2010) 15410-15417. DOI:10.1021/ja107196s |
| [39] |
G. Seisenberger, M.U. Ried, T. Endreβ, et al., Science 294 (2001) 1929-1932. DOI:10.1126/science.1064103 |
| [40] |
A.G. White, N. Fu, W.M. Leevy, et al., Bioconjugate Chem. 21 (2010) 1297-1304. DOI:10.1021/bc1000998 |
| [41] |
S. Ascioglu, J.H. Rex, B. de Pauw, et al., Clin. Infect. Dis. 34 (2002) 7-14. DOI:10.1086/323335 |
| [42] |
J.Y. Chen, X.M. Xu, Z.M. Huang, et al., Chem. Commun. 54 (2018) 291-294. DOI:10.1039/C7CC08403J |
| [43] |
B. Manicassamy, S. Manicassamy, Belicha-Villanueva A., et al., Proc. Natl. Acad. Sci. U. S. A. 107 (2010) 11531-11536. DOI:10.1073/pnas.0914994107 |
| [44] |
X.P. Li, D.L. Lu, Z.H. Sheng, et al., Talanta 100 (2012) 1-6. DOI:10.1016/j.talanta.2012.08.041 |
| [45] |
S.L. Liu, Z.G. Wang, Z.L. Zhang, D.W. Pang, Chem. Soc. Rev. 45 (2016) 1211-1224. DOI:10.1039/C5CS00657K |
| [46] |
E.L. Bentzen, F. House, T.J. Utley, et al., Nano Lett. 5 (2005) 591-595. DOI:10.1021/nl048073u |
| [47] |
A. Agrawal, R.A. Tripp, L.J. Anderson, S.M. Nie, J. Virol. 79 (2005) 8625-8628. DOI:10.1128/JVI.79.13.8625-8628.2005 |
| [48] |
I.L. Medintz, K.E. Sapsford, J.H. Konnert, et al., Langmuir 21 (2005) 5501-5510. DOI:10.1021/la0468287 |
| [49] |
K.I. Joo, Y.N. Lei, C.L. Lee, et al., ACS Nano 2 (2008) 1553-1562. DOI:10.1021/nn8002136 |
| [50] |
S.L. Liu, Z.Q. Tian, Z.L. Zhang, et al., Biomaterials 33 (2012) 7828-7833. DOI:10.1016/j.biomaterials.2012.07.026 |
| [51] |
K.I. Joo, Y. Fang, Y.R. Liu, et al., ACS Nano 5 (2011) 3523-3535. DOI:10.1021/nn102651p |
| [52] |
H.S. Han, N.K. Devaraj, J. Lee, et al., J. Am. Chem. Soc. 132 (2010) 7838-7839. DOI:10.1021/ja101677r |
| [53] |
A. Bernardin, A. Cazet, L. Guyon, et al., Bioconjugate Chem. 21 (2010) 583-588. DOI:10.1021/bc900564w |
| [54] |
W.R. Algar, D.E. Prasuhn, M.H. Stewart, et al., Bioconjugate Chem. 22 (2011) 825-858. DOI:10.1021/bc200065z |
| [55] |
M.A. Bruckman, G. Kaur, L.A. Lee, et al., ChemBioChem 9 (2008) 519-523. |
| [56] |
J. Hao, L.L. Huang, R. Zhang, H.Z. Wang, H.Y. Xie, Anal. Chem. 84 (2012) 8364-8370. DOI:10.1021/ac301918t |
| [57] |
P.F. Zhang, S.H. Liu, D.Y. Gao, et al., J. Am. Chem. Soc. 134 (2012) 8388-8391. DOI:10.1021/ja302367s |
| [58] |
Y. Zhang, X.L. Ke, Z.H. Zheng, et al., ACS Nano 7 (2013) 3896-3904. DOI:10.1021/nn305189n |
| [59] |
L. Wen, Y. Lin, Z.H. Zheng, et al., Biomaterials 35 (2014) 2295-2301. DOI:10.1016/j.biomaterials.2013.11.069 |
| [60] |
P. Zhou, Z.H. Zheng, W. Lu, et al., Angew. Chem. Int. Ed. 51 (2012) 670-674. DOI:10.1002/anie.201105701 |
| [61] |
B.H. Huang, Y. Lin, Z.L. Zhang, et al., ACS Chem. Biol. 7 (2012) 683-688. DOI:10.1021/cb2001878 |
| [62] |
L.L. Huang, P. Zhou, H.Z. Wang, et al., Chem. Commun. 48 (2012) 2424-2426. DOI:10.1039/c2cc17069h |
| [63] |
F.X. Zhang, Z.H. Zheng, S.L. Liu, et al., Biomaterials 34 (2013) 7506-7518. DOI:10.1016/j.biomaterials.2013.06.030 |
| [64] |
L.L. Huang, G.H. Lu, J. Hao, et al., Anal. Chem. 85 (2013) 5263-5270. DOI:10.1021/ac4008144 |
| [65] |
K. Luo, S. Li, M. Xie, et al., Biochem. Biophys. Res. Commun. 394 (2010) 493-497. DOI:10.1016/j.bbrc.2010.02.159 |
| [66] |
F. Pinaud, S. Clarke, A. Sittner, M. Dahan, Nat. Methods 7 (2010) 275-285. DOI:10.1038/nmeth.1444 |
| [67] |
D. Cheng, M.Q. Yu, F. Fu, et al., Anal. Chem. 88 (2016) 820-825. DOI:10.1021/acs.analchem.5b03320 |
| [68] |
E.G. Zhao, Y.N. Hong, S.J. Chen, et al., Adv. Healthcare Mater. 3 (2014) 88-96. DOI:10.1002/adhm.v3.1 |
| [69] |
H.Y. Wang, X.W. Hua, H.R. Jia, et al., ACS Biomater. Sci. Eng. 2 (2016) 987-997. DOI:10.1021/acsbiomaterials.6b00130 |
| [70] |
H.R. Jia, Y.X. Zhu, Z. Chen, F.G. Wu, ACS Appl. Mater. Interfaces 9 (2017) 15943-15951. DOI:10.1021/acsami.7b02562 |
| [71] |
M.D. Hirschey, Y.J. Han, G.D. Stucky, A. Butler, J. Biol. Inorg. Chem. 11 (2006) 663-669. DOI:10.1007/s00775-006-0116-7 |
| [72] |
C.C. Mi, Y.Y. Wang, J.P. Zhang, et al., J. Biotechnol. 153 (2011) 125-132. DOI:10.1016/j.jbiotec.2011.03.014 |
| [73] |
Y. Li, Y.Z. Zheng, D.K. Zhang, et al., Chin. Chem. Lett. 28 (2017) 184-188. DOI:10.1016/j.cclet.2016.07.020 |
| [74] |
M.A. El-Sayed, Acc. Chem. Res. 37 (2004) 326-333. DOI:10.1021/ar020204f |
| [75] |
Q.S. Wang, F.Y. Ye, T.T. Fang, et al., J. Colloid Interface Sci. 355 (2011) 9-14. DOI:10.1016/j.jcis.2010.11.035 |
| [76] |
X. Michalet, F.F. Pinaud, L.A. Bentolila, et al., Science 307 (2005) 538-544. DOI:10.1126/science.1104274 |
| [77] |
T. Jamieson, R. Bakhshi, D. Petrova, et al., Biomaterials 28 (2007) 4717-4732. DOI:10.1016/j.biomaterials.2007.07.014 |
| [78] |
Y.P. Du, B. Xu, T. Fu, et al., J. Am. Chem. Soc. 132 (2010) 1470-1471. DOI:10.1021/ja909490r |
| [79] |
X. Michalet, F. Pinaud, T.D. Lacoste, et al., Single Mol. 2 (2001) 261-276. |
| [80] |
U. Resch-Genger, M. Grabolle, S. Cavaliere-Jaricot, R. Nitschke, T. Nann, Nat. Methods 5 (2008) 763-775. DOI:10.1038/nmeth.1248 |
| [81] |
J.A. Kloepfer, R.E. Mielke, J.L. Nadeau, Appl. Environ. Microbiol. 71 (2005) 2548-2557. DOI:10.1128/AEM.71.5.2548-2557.2005 |
| [82] |
Z.S. Lu, C.M. Li, H.F. Bao, et al., Langmuir 24 (2008) 5445-5452. DOI:10.1021/la704075r |
| [83] |
X.H. Xue, J. Pan, H.M. Xie, J.H. Wang, S. Zhang, Talanta 77 (2009) 1808-1813. DOI:10.1016/j.talanta.2008.10.025 |
| [84] |
Z.Y. Yan, J. Qian, Y.Q. Gu, et al., Mater. Res. Express 1 (2014) 015401. DOI:10.1088/2053-1591/1/1/015401 |
| [85] |
H.N. Abdelhamid, H.F. Wu, Spectrochim. Acta A 188 (2018) 50-56. DOI:10.1016/j.saa.2017.06.047 |
| [86] |
N.I. Chalmers, R.J. Palmer, Du-Thumm L., et al., Appl. Environ. Microbiol. 73 (2007) 630-636. DOI:10.1128/AEM.02164-06 |
| [87] |
F. Aldeek, R. Schneider, Fontaine-Aupart M.P., et al., Appl. Environ. Microbiol. 79 (2013) 1400-1402. DOI:10.1128/AEM.03054-12 |
| [88] |
X.N. Li, Y.C. Yeh, K. Giri, et al., Chem. Commun. 51 (2015) 282-285. DOI:10.1039/C4CC07737G |
| [89] |
W.M. Leevy, T.N. Lambert, J.R. Johnson, J. Morris, B.D. Smith, Chem. Commun. 20 (2008) 2331-2333. |
| [90] |
F. Aldeek, C. Mustin, L. Balan, et al., Biomaterials 32 (2011) 5459-5470. DOI:10.1016/j.biomaterials.2011.04.019 |
| [91] |
X.L. Huang, F. Zhang, L. Zhu, et al., ACS Nano 7 (2013) 5684-5693. DOI:10.1021/nn401911k |
| [92] |
X.Y. Xu, R. Ray, Y.L. Gu, et al., J. Am. Chem. Soc. 126 (2004) 12736-12737. DOI:10.1021/ja040082h |
| [93] |
S.Y. Lim, W. Shen, Z.Q. Gao, Chem. Soc. Rev. 44 (2015) 362-381. DOI:10.1039/C4CS00269E |
| [94] |
Y.B. Song, S.J. Zhu, B. Yang, RSC Adv. 4 (2014) 27184-27200. DOI:10.1039/c3ra47994c |
| [95] |
N. Zhou, S.J. Zhu, S. Maharjan, et al., RSC Adv. 4 (2014) 62086-62095. |
| [96] |
Y.B. Song, S.J. Zhu, S.T. Zhang, et al., J. Mater. Chem. C 3 (2015) 5976-5984. DOI:10.1039/C5TC00813A |
| [97] |
M.C. Rong, K.X. Zhang, Y.R. Wang, X. Chen, Chin. Chem. Lett. 28 (2017) 1119-1124. DOI:10.1016/j.cclet.2016.12.009 |
| [98] |
S.J. Zhu, Y.B. Song, X.H. Zhao, et al., Nano Res. 8 (2015) 355-381. DOI:10.1007/s12274-014-0644-3 |
| [99] |
J.H. Shen, Y.H. Zhu, X.L. Yang, C.Z. Li, Chem. Commun. 48 (2012) 3686-3699. DOI:10.1039/c2cc00110a |
| [100] |
S.J. Zhu, X.H. Zhao, Y.B. Song, S.Y. Lu, B. Yang, Nano Today 11 (2016) 128-132. DOI:10.1016/j.nantod.2015.09.002 |
| [101] |
J.J. Liu, D.W. Li, K. Zhang, et al., Small 14 (2018) 1703919. DOI:10.1002/smll.201703919 |
| [102] |
B.Z. Ristic, M.M. Milenkovic, I.R. Dakic, et al., Biomaterials 35 (2014) 4428-4435. DOI:10.1016/j.biomaterials.2014.02.014 |
| [103] |
B.S.B. Kasibabu, D'souza S.L., S. Jha, et al., Anal. Methods 7 (2015) 2373-2378. DOI:10.1039/C4AY02737J |
| [104] |
V.N. Mehta, S. Jha, S.K. Kailasa, Mater. Sci. Eng. C 38 (2014) 20-27. DOI:10.1016/j.msec.2014.01.038 |
| [105] |
K.M. Tripathi, A.K. Sonker, S.K. Sonkar, S. Sarkar, RSC Adv. 4 (2014) 30100-30107. DOI:10.1039/C4RA03720K |
| [106] |
C.I. Weng, H.T. Chang, C.H. Lin, et al., Biosens. Bioelectron. 68 (2015) 1-6. DOI:10.1016/j.bios.2014.12.028 |
| [107] |
N. Wang, H. Fan, J.C. Sun, et al., Carbon 109 (2016) 141-148. DOI:10.1016/j.carbon.2016.08.004 |
| [108] |
N. Wang, Y.T. Wang, T.T. Guo, et al., Biosens. Bioelectron. 85 (2016) 68-75. DOI:10.1016/j.bios.2016.04.089 |
| [109] |
Y.Q. Zhang, X.Y. Liu, Y. Fan, et al., Nanoscale 8 (2016) 15281-15287. DOI:10.1039/C6NR03125K |
| [110] |
A. Sachdev, I. Matai, S.U. Kumar, et al., RSC Adv. 3 (2013) 16958-16961. DOI:10.1039/c3ra42415d |
| [111] |
M.M.F. Baig, Y.C. Chen, J. Colloid Interface Sci. 501 (2017) 341-349. DOI:10.1016/j.jcis.2017.04.045 |
| [112] |
F.M. Lin, C.C. Li, L. Dong, D.G. Fu, Z. Chen, Nanoscale 9 (2017) 9056-9064. DOI:10.1039/C7NR01975K |
| [113] |
A. Pramanik, S. Jones, F. Pedraza, et al., ACS Omega 2 (2017) 554-562. DOI:10.1021/acsomega.6b00518 |
| [114] |
J.J. Yang, X.D. Zhang, Y.H. Ma, et al., ACS Appl. Mater. Interfaces 8 (2016) 32170-32181. DOI:10.1021/acsami.6b10398 |
| [115] |
Y.X. Song, H. Li, F. Lu, et al., J. Mater. Chem. B 5 (2017) 6008-6015. DOI:10.1039/C7TB01092C |
| [116] |
X.W. Hua, Y.W. Bao, H.Y. Wang, Z. Chen, F.G. Wu, Nanoscale 9 (2017) 2150-2161. DOI:10.1039/C6NR06558A |
| [117] |
F. Lu, Y.X. Song, H. Huang, et al., Carbon 120 (2017) 95-102. DOI:10.1016/j.carbon.2017.05.039 |
| [118] |
M. Ritenberg, S. Nandi, S. Kolusheva, et al., ACS Chem. Biol. 11 (2016) 1265-1270. DOI:10.1021/acschembio.5b01000 |
| [119] |
F.M. Lin, C.C. Li, Z. Chen, Front. Microbiol. 9 (2018) 259. DOI:10.3389/fmicb.2018.00259 |
| [120] |
G.F. Grom, D.J. Lockwood, J.P. McCaffrey, et al., Nature 407 (2000) 358-361. DOI:10.1038/35030062 |
| [121] |
X.K. Chen, X.D. Zhang, L.Y. Xia, et al., Nano Lett. 18 (2018) 1159-1167. DOI:10.1021/acs.nanolett.7b04700 |
| [122] |
J.G. Fan, X.J. Tang, Y.P. Zhao, Nanotechnology 15 (2004) 501-504. DOI:10.1088/0957-4484/15/5/017 |
| [123] |
V. Schmidt, J.V. Wittemann, S. Senz, U. Gösele, Adv. Mater. 21 (2009) 2681-2702. DOI:10.1002/adma.200803754 |
| [124] |
M. Cavarroc, M. Mikikian, G. Perrier, L. Boufendi, Appl. Phys. Lett. 89 (2006) 013107. DOI:10.1063/1.2219395 |
| [125] |
F. Erogbogbo, K.T. Yong, I. Roy, et al., ACS Nano 2 (2008) 873-878. DOI:10.1021/nn700319z |
| [126] |
F. Erogbogbo, K.T. Yong, R. Hu, et al., ACS Nano 4 (2010) 5131-5138. DOI:10.1021/nn101016f |
| [127] |
H. Sugimoto, M. Fujii, Y. Fukuda, K. Imakita, K. Akamatsu, Nanoscale 6 (2014) 122-126. DOI:10.1039/C3NR03863G |
| [128] |
Y.X. Zhang, X. Han, J.M. Zhang, et al., Nanoscale 4 (2012) 7760-7765. DOI:10.1039/c2nr32375c |
| [129] |
R. Ban, F.F. Zheng, J.R. Zhang, Anal. Methods 7 (2015) 1732-1737. DOI:10.1039/C4AY02729A |
| [130] |
Y. He, C.H. Fan, S.T. Lee, Nano Today 5 (2010) 282-295. DOI:10.1016/j.nantod.2010.06.008 |
| [131] |
E.C. Cho, S. Park, X.J. Hao, et al., Nanotechnology 19 (2008) 245201. DOI:10.1088/0957-4484/19/24/245201 |
| [132] |
P.M. Fauchet, Mater. Today 8 (2005) 26-33. |
| [133] |
A. Shiohara, S. Prabakar, A. Faramus, et al., Nanoscale 3 (2011) 3364-3370. DOI:10.1039/c1nr10458f |
| [134] |
Y. He, Y.L. Zhong, F. Peng, et al., J. Am. Chem. Soc. 133 (2011) 14192-14195. DOI:10.1021/ja2048804 |
| [135] |
J.J. Li, J.J. Zhu, Analyst 138 (2013) 2506-2515. DOI:10.1039/c3an36705c |
| [136] |
K. Bagga, A. Barchanski, R. Intartaglia, et al., Laser Phys. Lett. 10 (2013) 065603. DOI:10.1088/1612-2011/10/6/065603 |
| [137] |
S. Chinnathambi, S. Chen, S. Ganesan, et al., Adv. Healthcare Mater. 3 (2014) 10-29. DOI:10.1002/adhm.v3.1 |
| [138] |
X.D. Zhang, X.K. Chen, J.J. Yang, et al., Adv. Funct. Mater. 26 (2016) 5958-5970. DOI:10.1002/adfm.v26.33 |
| [139] |
C.F. Wu, D.T. Chiu, Angew. Chem. Int. Ed. 52 (2013) 3086-3109. DOI:10.1002/anie.201205133 |
| [140] |
C.F. Wu, B. Bull, C. Szymanski, K. Christensen, J. McNeill, ACS Nano 2 (2008) 2415-2423. DOI:10.1021/nn800590n |
| [141] |
Y.H. Chan, C.F. Wu, F.M. Ye, et al., Anal. Chem. 83 (2011) 1448-1455. DOI:10.1021/ac103140x |
| [142] |
X.L. Feng, G.M. Yang, L.B. Liu, et al., Adv. Mater. 24 (2012) 637-641. DOI:10.1002/adma.201102026 |
| [143] |
M. Massey, M. Wu, E.M. Conroy, W.R. Algar, Curr. Opin. Biotechnol. 34 (2015) 30-40. DOI:10.1016/j.copbio.2014.11.006 |
| [144] |
X.B. Zhou, H. Liang, P.F. Jiang, et al., Adv. Sci. 3 (2016) 1500155. DOI:10.1002/advs.201500155 |
| [145] |
J.Y. Sun, H. Mei, S.F. Wang, F. Gao, Anal. Chem. 88 (2016) 7372-7377. DOI:10.1021/acs.analchem.6b01929 |
| [146] |
C.S. Ke, C.C. Fang, J.Y. Yan, et al., ACS Nano 11 (2017) 3166-3177. DOI:10.1021/acsnano.7b00215 |
| [147] |
K. Sun, Y.K. Yang, H. Zhou, et al., ACS Nano 12 (2018) 5176-5184. DOI:10.1021/acsnano.8b02188 |
| [148] |
Y.H. Chan, P.J. Wu, Part. Part. Syst. Charact. 32 (2015) 11-28. DOI:10.1002/ppsc.201400123 |
| [149] |
H. Chong, C.Y. Nie, C.L. Zhu, et al., Langmuir 28 (2012) 2091-2098. DOI:10.1021/la203832h |
| [150] |
Y. Wan, L.B. Zheng, Y. Sun, D. Zhang, J. Mater. Chem. B 2 (2014) 4818-4825. DOI:10.1039/C4TB00288A |
| [151] |
X.J. Zhang, J.B. Yu, Y. Rong, et al., Chem. Sci. 4 (2013) 2143-2151. DOI:10.1039/c3sc50222h |
| [152] |
P.J. Wu, S.Y. Kuo, Y.C. Huang, C.P. Chen, Y.H. Chan, Anal. Chem. 86 (2014) 4831-4839. DOI:10.1021/ac404237q |
| [153] |
Y.H. Jin, F.M. Ye, M. Zeigler, C.F. Wu, D.T. Chiu, ACS Nano 5 (2011) 1468-1475. DOI:10.1021/nn103304m |
| [154] |
J.B. Yu, C.F. Wu, X.J. Zhang, et al., Adv. Mater. 24 (2012) 3498-3504. DOI:10.1002/adma.201201245 |
| [155] |
Y. Rong, C.F. Wu, J.B. Yu, et al., ACS Nano 7 (2013) 376-384. DOI:10.1021/nn304376z |
| [156] |
M. Aribandi, V.A. McCoy, C. Bazan Ⅲ, RadioGraphics 27 (2007) 1283-1296. DOI:10.1148/rg.275065189 |
| [157] |
E.I. Boutati, E.J. Anaissie, Blood 90 (1997) 999-1008. |
| [158] |
D. Jiménez-Fernández, M. Montes-Borrego, J.A. Navas-Cortés, R.M. Jiménez-Díaz, B.B. Landa, Appl. Soil Ecol. 46 (2010) 372-382. DOI:10.1016/j.apsoil.2010.10.001 |
| [159] |
N. Rispail, L. De Matteis, R. Santos, et al., ACS Appl. Mater. Interfaces 6 (2014) 9100-9110. DOI:10.1021/am501029g |
| [160] |
M.D. Whiteside, K.K. Treseder, P.R. Atsatt, Ecology 90 (2009) 100-108. DOI:10.1890/07-2115.1 |
| [161] |
M.D. Whiteside, M.A. Digman, E. Gratton, K.K. Treseder, Soil Biol. Biochem. 55 (2012) 7-13. DOI:10.1016/j.soilbio.2012.06.001 |
| [162] |
D.P.L.A. Tenório, C.G. Andrade, P.E. Cabral Filho, et al., J. Photochem. Photobiol. B 142 (2015) 237-243. DOI:10.1016/j.jphotobiol.2014.11.010 |
| [163] |
V.N. Mehta, S. Jha, H. Basu, R.K. Singhal, S.K. Kailasa, Sens. Actuator B 213 (2015) 434-443. DOI:10.1016/j.snb.2015.02.104 |
| [164] |
B.S.B. Kasibabu, S.L. D'souza, S. Jha, S.K. Kailasa, J. Fluoresc. 25 (2015) 803-810. DOI:10.1007/s10895-015-1595-0 |
| [165] |
X.Z. Jin, X.B. Sun, G. Chen, et al., Carbon 81 (2015) 388-395. DOI:10.1016/j.carbon.2014.09.071 |
| [166] |
S.N. Baker, G.A. Baker, Angew. Chem. Int. Ed. 49 (2010) 6726-6744. DOI:10.1002/anie.200906623 |
| [167] |
S.Y. Lu, X.H. Zhao, S.J. Zhu, Y.B. Song, B. Yang, Nanoscale 6 (2014) 13939-13944. DOI:10.1039/C4NR03965C |
| [168] |
J. Wang, F. Peng, Y.M. Lu, et al., Adv. Optical Mater. 3 (2015) 103-111. DOI:10.1002/adom.v3.1 |
| [169] |
S.Y. Lu, R.D. Cong, S.J. Zhu, et al., ACS Appl. Mater. Interfaces 8 (2016) 4062-4068. DOI:10.1021/acsami.5b11579 |
| [170] |
J.J. Liu, S.Y. Lu, Q.L. Tang, et al., Nanoscale 9 (2017) 7135-7142. DOI:10.1039/C7NR02128C |
| [171] |
S.Y. Tao, Y.B. Song, S.J. Zhu, J.R. Shao, B. Yang, Polymer 116 (2017) 472-478. DOI:10.1016/j.polymer.2017.02.039 |
| [172] |
C. Sun, Y. Zhang, K. Sun, et al., Nanoscale 7 (2015) 12045-12050. DOI:10.1039/C5NR03014E |
| [173] |
N.A. Travlou, D.A. Giannakoudakis, M. Algarra, et al., Carbon 135 (2018) 104-111. DOI:10.1016/j.carbon.2018.04.018 |
| [174] |
W. Song, H.J. Zhang, Y.H. Liu, C.L. Ren, H.L. Chen, Chin. Chem. Lett. 28 (2017) 1675-1680. DOI:10.1016/j.cclet.2017.05.001 |